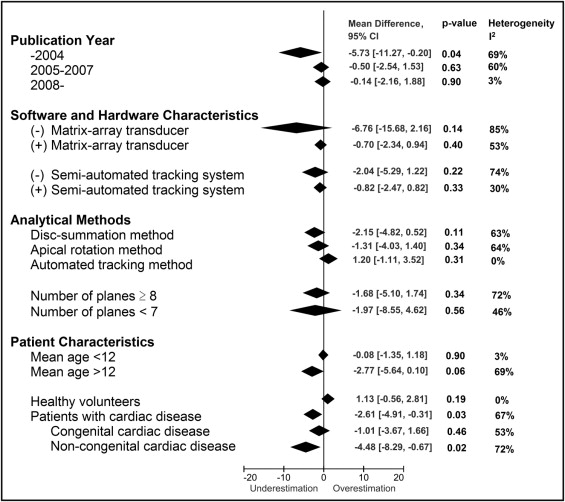
Left ventricular (LV) hypertrophy is a fundamental prognostic factor in a variety of cardiac diseases. Three-dimensional echocardiography (3DE) has achieved better estimation of LV mass than 2-dimensional echocardiography. However, significant underestimation has often been reported, and no previous study has synthesized these data. The aim of this meta-analysis was to investigate if there has been improvement in the accuracy in LV mass measurement by 3DE over time. Studies comparing LV mass between 3DE and magnetic resonance imaging were eligible. A cumulative meta-analysis was performed to investigate improvement in accuracy, followed by subgroup and meta-regression analysis to reveal factors affecting the bias. A total of 25 studies including 671 comparisons were analyzed. Studies published in or before 2004 showed high heterogeneity (I 2 = 69%) and significant underestimation of LV mass by 3DE (−5.7 g, 95% confidence interval −11.3 to −0.2, p = 0.04). Studies published from 2005 to 2007 were still heterogenous (I 2 = 60%) but showed less systematic bias (−0.5 g, 95% confidence interval −2.5 to 1.5, p = 0.63). In contrast, studies published in or after 2008 were highly homogenous (I 2 = 3%) and showed excellent accuracy (−0.1 g, 95% confidence interval −2.2 to 1.9, p = 0.90). Investigation of factors affecting the bias revealed that evaluation of cardiac patients compared to healthy volunteers led to larger bias (p <0.05). In conclusion, this meta-analysis elucidates the underestimation of LV mass by 3DE, its improvement over the past decade, and factors affecting the bias. These data provide a more detailed basis for improving the accuracy of 3DE, an indispensable step toward further clinical application.
The accurate assessment of left ventricular (LV) mass is crucial, because LV hypertrophy is an independent and potent risk factor for morbidity and mortality in patients with hypertension and congenital aortic stenosis and even in patients without cardiovascular disease. Assessment of LV mass by 2-dimensional echocardiography is limited because it depends on geometric assumptions and imaging plane positioning. Magnetic resonance imaging (MRI) has been used as the clinical gold standard, but it is time and resource intensive and is sometimes contraindicated. Three-dimensional echocardiography (3DE) has shown better correlation than 2-dimensional echocardiography with MRI measurements. However, previous studies have suggested that 3DE significantly underestimates LV mass, whereas nonsignificant bias and overestimation have been reported. Therefore, we aimed in this meta-analysis to investigate (1) the systematic bias in LV mass measured by 3DE compared to MRI, (2) if there has been any improvement in accuracy over the past decade, and (3) if patient characteristics and the use of new software and hardware affect the systematic bias.
Methods
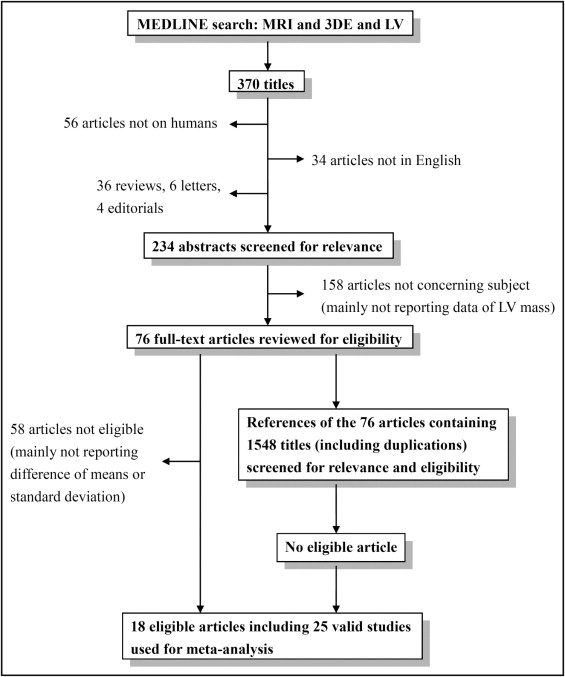
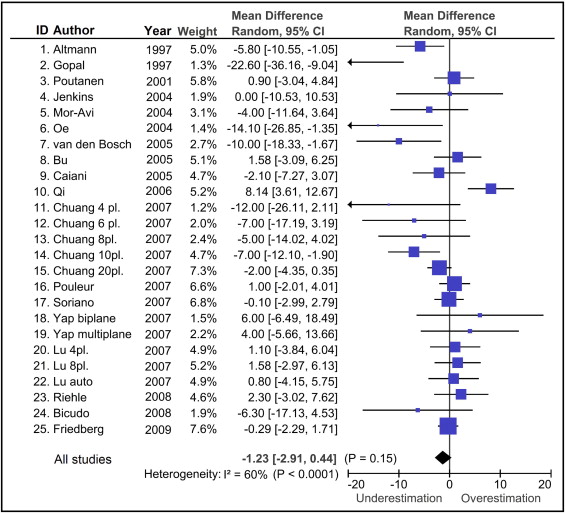
We searched MEDLINE using Medical Subject Headings through February 24, 2012. The keywords as text words and terms used for the search were “magnetic resonance imaging,” “left ventricle,” “3-dimensional echocardiography,” and relevant phrases. Reports including all 3 keywords were screened by title and abstract for relevance. The search was restricted to human studies in English. The reference lists of relevant reports were also reviewed. Abstracts without following full-text publications, reviews, comments, letters, and publications that were not original reports were excluded ( Figure 1 ). Studies were considered eligible if they assessed difference of LV mass between 3DE and MRI, reporting the mean difference and its standard deviation, or if these data could be calculated from the original reports. Independent reviewers (Y.J.S. and T.S.) retrieved the full text of the relevant reports for eligibility. Mean differences of LV mass with standard deviations between 3DE and MRI were obtained from the text, tables, or figures. If a report included different populations or methods of 3DE, the results of each population and method were considered separate individual studies ( Figure 2 ).
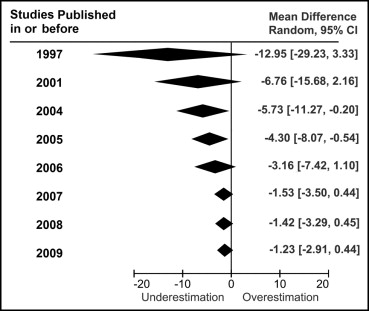
Cumulative meta-analysis is a method used to investigate trend of studies over years described by Antman et al in 1992. For each year, a meta-analysis was performed to accumulate data of studies that had been published in or before the year. To assess the study period more accurately, the publication year in this report refers to the year when the report was first submitted to the journal. The results of these meta-analyses were then displayed in 1 graph to show the trend over the years, as shown in Figure 3 . Each meta-analysis was performed using a random-effects model weighted by inverse variance to evaluate the systematic bias of LV mass between 3DE and MRI. Heterogeneity was assessed with Cochrane’s Q test using a chi-square test at the p <0.10 level of significance and was quantified with the I 2 test. An I 2 value >50% was considered to indicate substantial heterogeneity. Testing for publication bias was performed using funnel plots.
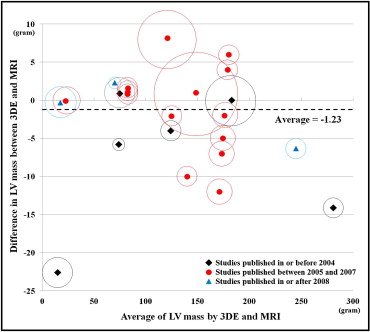
Subgroup analysis was performed to investigate the factors related to the bias in LV mass. Study groups were separated into subgroups by prespecified factors, as detailed in Figure 4 . If the factors had significant associations with the bias with p values <0.10 in univariate analysis, these factors were included in the multivariate metaregression analysis. Metaregression analysis was performed with an inverse variance–weighted, random-intercept, fixed-slopes model. Modified Bland-Altman analysis was performed by taking the average of LV mass values by 3DE and MRI on the x-axis and the difference on the y-axis, with each point on the graph representing each study. In addition, a circle centered at each point was added to represent the number of patients in the study ( Figure 5 ).
Continuous values are presented as mean ± SD and discrete variables as percentages. Review Manager 5.1 (Nordic Cochrane Centre, Cochrane Collaboration, Copenhagen, Denmark) and SPSS version 20.0 for Windows (SPSS, Inc., Chicago, Illinois) with Macro Syntax for meta-analysis and metaregression analysis ( http://mason.gmu.edu/∼dwilsonb/ma.html ) were used for analysis. A p value <0.05 was considered statistically significant.
Results
A total of 76 titles were screened for relevance, of which 18 were considered eligible, including 25 studies, 513 subjects, and 671 comparisons between 3DE and MRI (average number of subjects per study 26 ± 15; Figure 1 ). Table 1 lists the characteristics of the included studies. As shown in Figure 2 , the included studies were heterogenous (heterogeneity by Q test, p = 0.0001, I 2 = 60%), and there was no significant bias in the measurement of LV mass by 3DE (−1.2 g, 95% confidence interval [CI] −2.9 to 0.4, p = 0.15). Funnel plots revealed no publication bias.
| Study | Publication Year | n (Male) | Age (years) | Patient Characteristics | Volumetry Method | Matrix-Array Transducer | Semiautomated Tracking | Hardware | Software |
|---|---|---|---|---|---|---|---|---|---|
| Altmann et al | 1997 | 12 (8) | 8.6 (0.5–22) | Single left ventricle | DS | − | − | Acoustic spatial locator GP 8-3D ⁎ with Model 77020AC † | |
| Gopal et al | 1997 | 30 (13) | 56.6 ± 15.9 (15–87) | 15 IC, 5 idiopathic or hypertensive CM, 5 VHD, 2 alcoholic CM, 1 primary PAH, 2 congenital heart disease | DS | − | − | Acoustic spatial locator (Freepoint 3D ‡ ) with Model 77020AC † | |
| Poutanen et al | 2001 | 30 (15) | 10.6 ± 1.4 (8.4–13.2) | Healthy volunteers | DS | − | + | GE Vingmed System FiVe § ultrasound scanner (3.5 or 5 MHz) | |
| Jenkins et al | 2004 | 50 (41) | 64 ± 8 | 7 normal, 41 regional WMA, 7 global WMA due to hypertension | AR (12 planes) | + | + | Sonos 7500 ∥ with X4 transducer (2–4 MHz) | 4D Analysis, TomTec ¶ |
| Mor-Avi et al | 2004 | 19 (NR) | 48 ± 16 | 7 suspected CAD, 7 DC, 2 post-MI, 3 with aortic abnormalities, 1 with right atrial mass, 1 with mitral valve disorder | DS | + | − | Sonos 7500 ∥ with X4 transducer (2–4 MHz) | QLAB-3DQ ∥ |
| Oe et al | 2004 | 21 (17) | 54 ± 15 (18–78) | 17 HC, 4 hypertensive heart disease | AR (8 planes) | + | − | Sonos 7500 ∥ with X4 transducer (2–4 MHz) | 4D CardioView, TomTec ¶ |
| van den Bosch et al | 2005 | 29 (19) | 31 ± 9 (19–51) | Distorted LV geometry from congenital heart malformation | AR (8 planes) | + | − | Sonos 7500 ∥ with X4 transducer (2–4 MHz) | 4D LV Analysis 1.2 and EchoView 5.2 ¶ |
| Bu et al | 2005 | 19 (10) | 10.6 ± 2.8 | Normal subjects | AR (8 planes) | + | − | Sonos 7500 ∥ with X4 transducer (2–4 MHz) | 4D CardioView RT, version 1.2 ∥ |
| Caiani et al | 2005 | 19 (NR) | 48 ± 16 | 7 suspected CAD, 7 DC, 2 post-MI, 3 aortic abnormalities, 1 right atrial mass, 1 mitral valve disorder | AR (4 planes) | + | − | Sonos 7500 ∥ with X4 transducer (2–4 MHz) | QLAB-3DQ ∥ |
| Qi et al | 2006 | 58 (40) | 59 (21–83) | 14 normal, 23 CAD, 7 DC, 3 ASD or VSD, 3 VHD | AR (8 planes) | + | − | iE33 ∥ with a 4X matrix-array transducer | TomTec ¶ EchoView 5.2 |
| Chuang et al | 2007 | 16 (9) | (28–68) | 11 healthy volunteers, 7 IC with focal WMA, 7 nonischemic DC | AR (4 planes) | + | + | NR | NR |
| Chuang et al | 2007 | 16 (9) | (28–68) | As above | AR (6 planes) | + | + | NR | NR |
| Chuang et al | 2007 | 16 (9) | (28–68) | As above | AR (8 planes) | + | + | NR | NR |
| Chuang et al | 2007 | 16 (9) | (28–68) | As above | AR (10 planes) | + | + | NR | NR |
| Chuang et al | 2007 | 16 (9) | (28–68) | As above | AR (20 planes) | + | + | NR | NR |
| Pouleur et al | 2007 | 83 (67) | 54 ± 19 (7–85) | 20 normal subjects, 20 aortic valve disease, 10 severe MR, 33 post-MI | NR | + | + | Sonos 7500 ∥ or IE33 with matrix-array transducer | Qlab ∥ |
| Soriano et al | 2007 | 27 (NR) | 7 months | Functional single ventricle | NR | + | − | Sonos 7500 ∥ with X4 transducer (2–4 MHz) | 4-D EchoView, TomTec ¶ |
| Yap et al | 2007 | 18 (13) | 30 ± 8 | Congenital aortic stenosis | AR (2 planes) | + | − | Sonos 7500 ∥ with X4 transducer (2–5 MHz) | QLAB-3DQ ∥ and 4-D EchoView, TomTec ¶ |
| Yap et al | 2007 | 18 (13) | 30 ± 8 | As above | AR (8 planes) | + | − | As above | As above |
| Lu et al | 2007 | 20 (11) | 10.6 ± 2.8 (6–18) | 19 healthy volunteers, 1 secundum ASD | AR (4 planes) | + | + | Matrix-array transducer (X4, 2–4 MHz) | 4D EchoView 5.4, TomTec ¶ |
| Lu et al | 2007 | 20 (11) | 10.6 ± 2.8 (6–18) | As above | AR (8 planes) | + | + | As above | As above |
| Lu et al | 2007 | 20 (11) | 10.6 ± 2.8 (6–18) | As above | Automated | + | + | As above | QLAB-3DQ ∥ |
| Riehle et al | 2008 | 12 (7) | 15.9 (1–33) | 5 repaired ToF, 2 PS status post valvotomy, 2 aortic coarctation, 1 midaortic stenosis, 1 AS, 1 anomalous left coronary artery | AR (2 planes) | + | + | iE33 ∥ with X3-1 transducer (1–3 MHz) | QLAB-3DQ ∥ |
| Bicudo et al | 2008 | 20 (13) | 32 ± 14 | HC | NR | + | − | Sonos 7500 ∥ with X4 transducer (2–4 MHz) | QLAB versions 4.0 and 4.2.1 ∥ |
| Friedberg et al | 2009 | 35 (NR) | 9.5 months (0.03–46.1) | Congenital heart disease | DS | + | − | Sonos 7500 ∥ with X4 transducer (2–4 MHz) | 4D EchoView, TomTec ¶ |
Stay updated, free articles. Join our Telegram channel

Full access? Get Clinical Tree


