FIGURE 23.1. Color flow image in transverse view of the origin of the celiac artery from the aorta. The “seagull sign” is formed by the celiac artery bifurcation into the common hepatic and splenic arteries. The blue color in the splenic artery is caused by flow away from the transducer relative to the ultrasound scan lines.
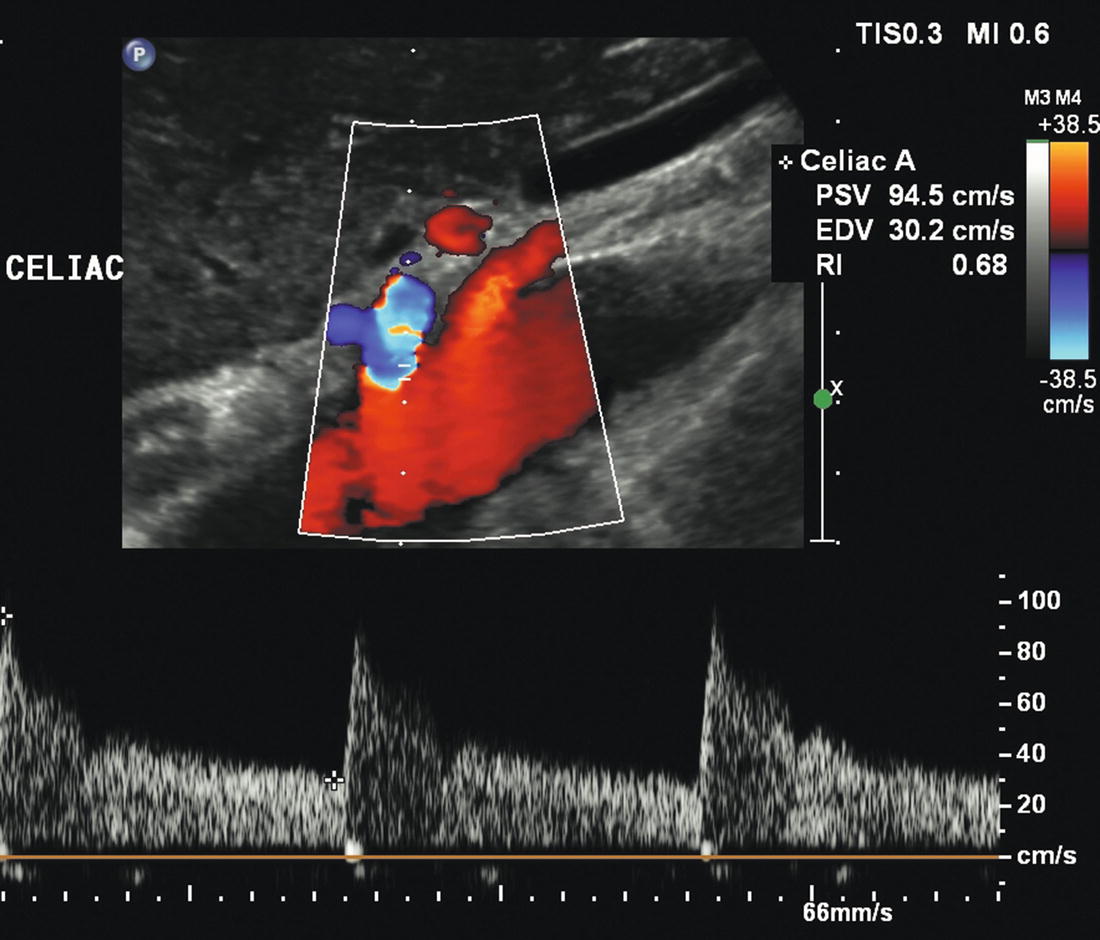
FIGURE 23.2. Color flow image and Doppler spectral waveform from a normal celiac artery. The flow pattern is typical of a low-resistance vascular bed, with forward flow throughout the cardiac cycle. Peak systolic velocity (PSV) is 94 cm/s and end-diastolic velocity (EDV) is 30 cm/s.
Careful attention to Doppler angle correction for velocity measurements is necessary because these vessels may be tortuous. Close attention should also be given to the Doppler pulse repetition frequency (PRF) and the orientation of the color-scale bar. The colors on the top half of the scale are assigned to flow coming toward the scan head, and the colors on the bottom half represent flow away from the scan head. Flow direction becomes especially important when the celiac artery is occluded or severely stenotic. In this situation, low pressure in the celiac artery induces SMA collaterals to divert blood toward the liver and spleen through the gastroduodenal artery (GDA). The GDA backfills the common hepatic artery such that retrograde flow in the common hepatic crosses the celiac artery origin to perfuse the splenic artery (Fig. 23.3). The finding of retrograde flow direction in the common hepatic artery is always associated with severe celiac artery stenosis or occlusion. Additionally, poststenotic turbulence in the splenic and hepatic arteries can be indirect signs of a celiac artery stenosis.
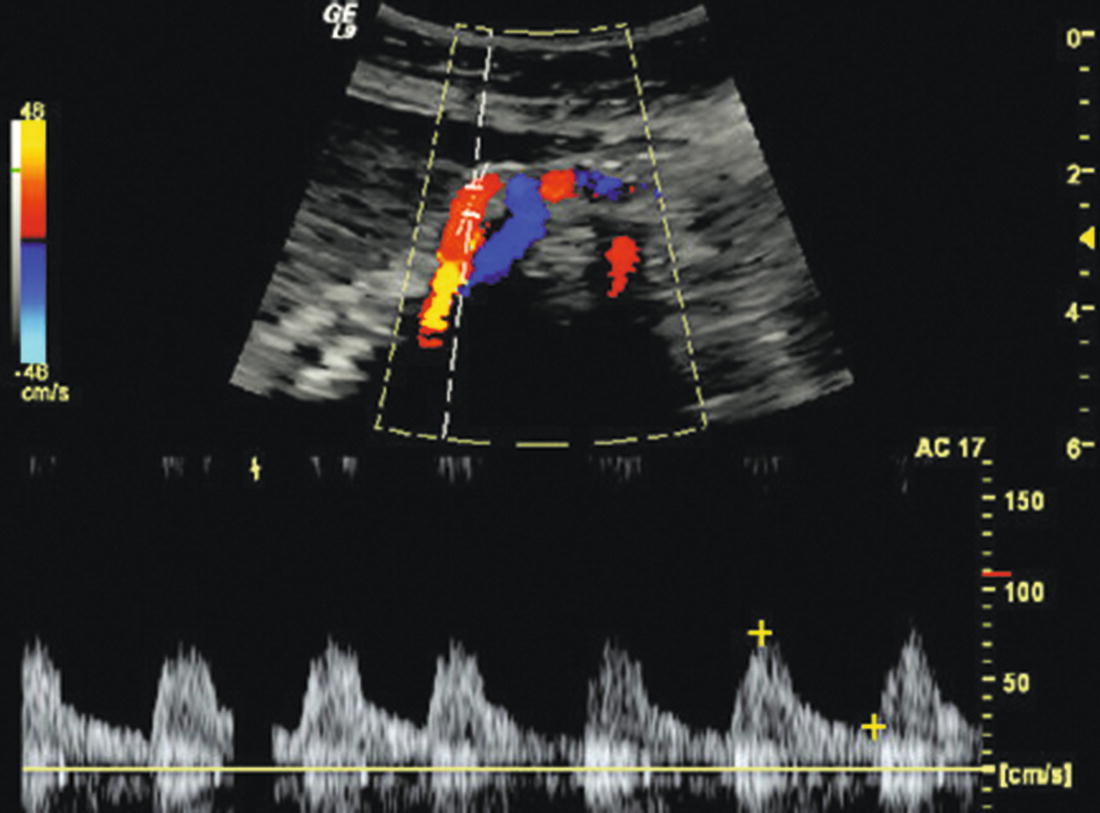
FIGURE 23.3. Color flow image and Doppler spectral waveform illustrating the importance of color scale and pulse repetition frequency (PRF). The pulsed Doppler sample volume is positioned in the common hepatic artery, and both the spectral waveform and the color flow image (red) indicate flow toward the scan head. This represents retrograde collateral flow in the common hepatic artery, crossing the celiac bifurcation and providing antegrade flow in the splenic artery away from the scan head (blue).
The SMA typically originates from the anterior surface of the aorta 1 to 2 cm below the celiac artery. It is best visualized in a sagittal plane as it courses parallel to the aorta with the left renal vein running between the SMA and aorta. The normal fasting SMA Doppler spectral waveform is triphasic (high resistance) with a brief phase of reversed flow followed by little or no flow in the second half of the cardiac cycle, similar to the pattern found in the major upper and lower extremity arteries (Fig. 23.4). The SMA should be scanned as far distally as possible, obtaining Doppler spectral waveforms from the proximal, middle, and distal segments.
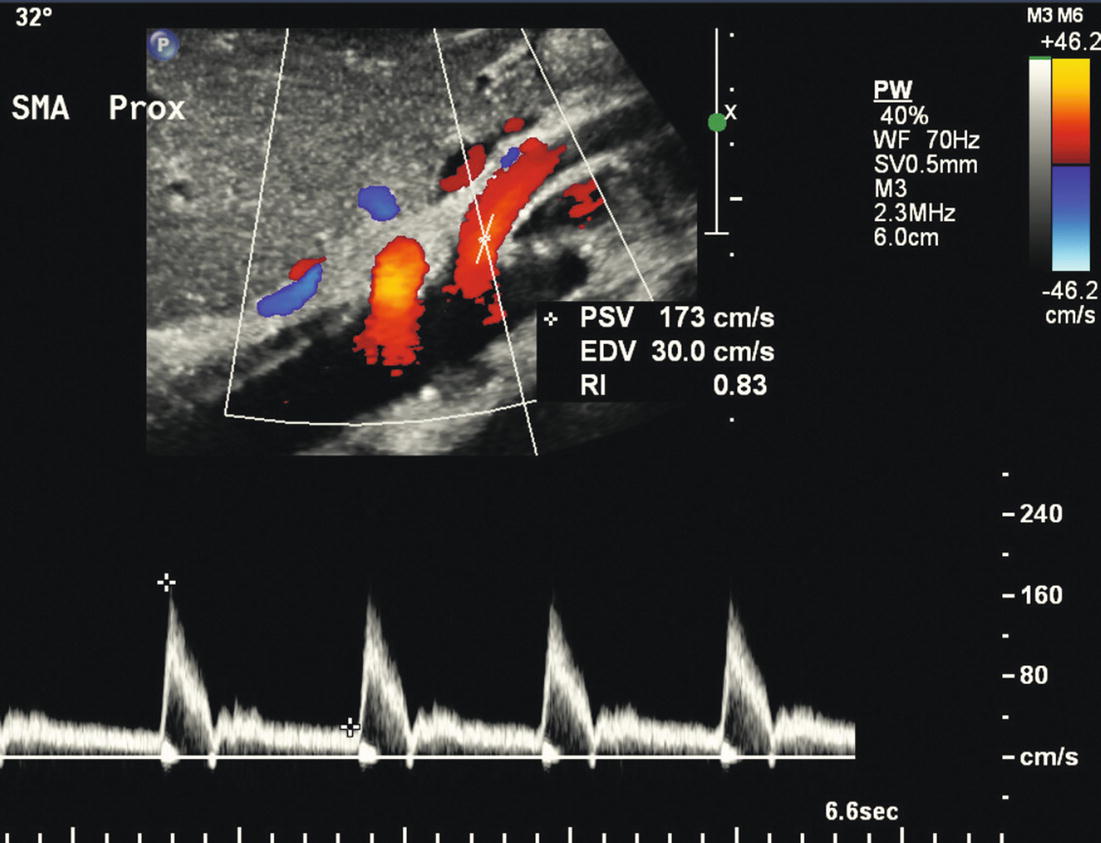
FIGURE 23.4. Color flow image and Doppler spectral waveform from a normal superior mesenteric artery (SMA) showing a high-resistance triphasic flow pattern in a fasting patient. The color flow image shows the origin and proximal segment of the SMA in sagittal view. Note placement of the angle cursor for Doppler angle correction along the curve near the vessel origin. Peak systolic velocity (PSV) is 173 cm/s and end-diastolic velocity (EDV) is 30 cm/s.
The IMA is most easily identified in a transverse view by locating the aortic bifurcation and then scanning proximally up the distal abdominal aorta for 1 to 2 cm. The IMA usually originates from the aorta slightly to the left of the anterior midline (i.e., the 1 or 2 o’clock position on a transverse image) (Fig. 23.5). Normal Doppler spectral waveforms from the IMA resemble those from the fasting SMA with a high-resistance pattern.
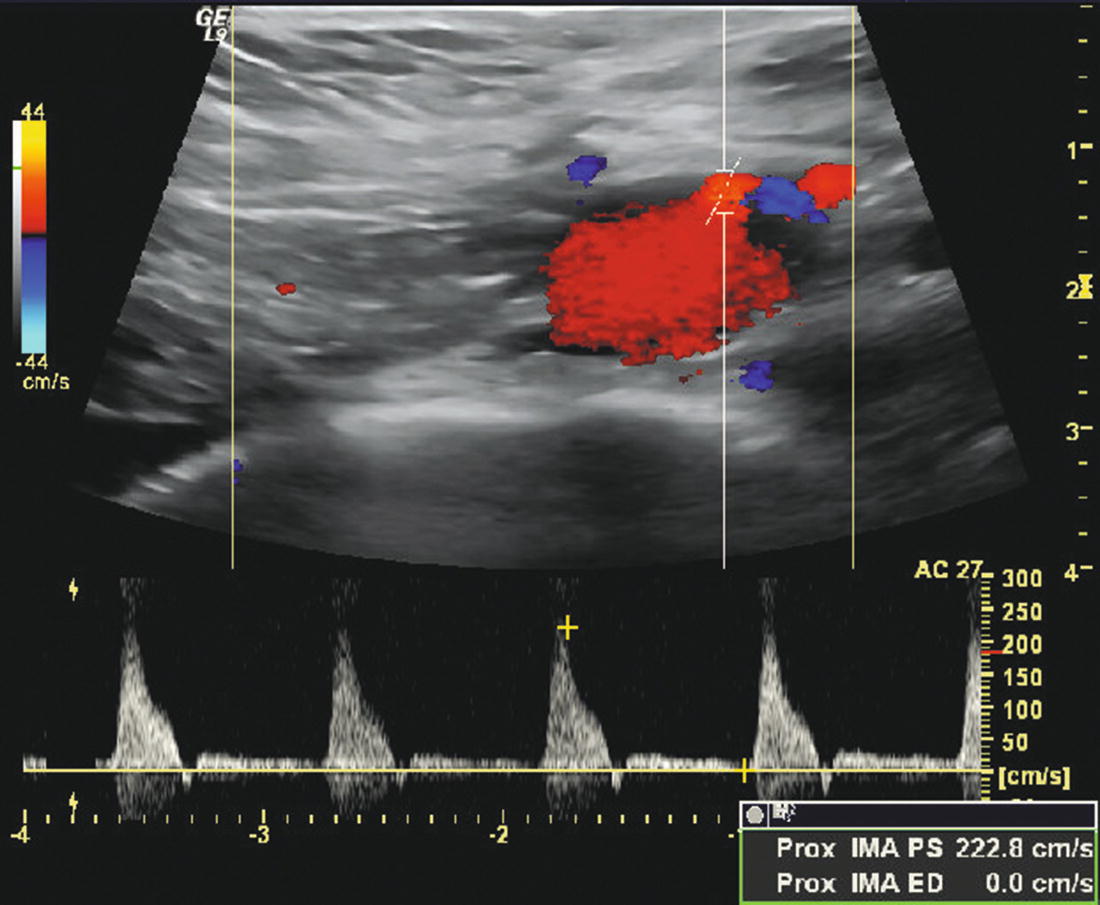
FIGURE 23.5. Transverse color flow image of a normal inferior mesenteric artery (IMA) originating from the distal aorta slightly to the left of the anterior midline at about the 1 o’clock position. The spectral waveform shows a high-resistance (triphasic) flow pattern with a peak systolic velocity of 223 cm/s.
Scanning Tips
Attempts should be made to visualize the origins of both the celiac artery and the SMA in the same duplex image to confirm correct identification of these vessels, particularly when both arteries have elevated velocities and abnormal Doppler spectral waveforms (Fig. 23.6). This may require rotating the scan head slightly or moving laterally and angling the scan head back toward the midline. As with the renal duplex examination, there is movement of these arteries with respiration, and asking the patient to suspend breathing momentarily while recording Doppler waveforms can be very helpful. It is possible for the Doppler sample volume to inadvertently slip from one artery to the other, and keeping these vessels as still as possible helps avoid errors. If there is air in the epigastrium, light pressure with the scan head can push it out of the way. When midline scars from abdominal surgery cause shadowing, moving the scan head laterally and angling toward the midline may help with visualization.
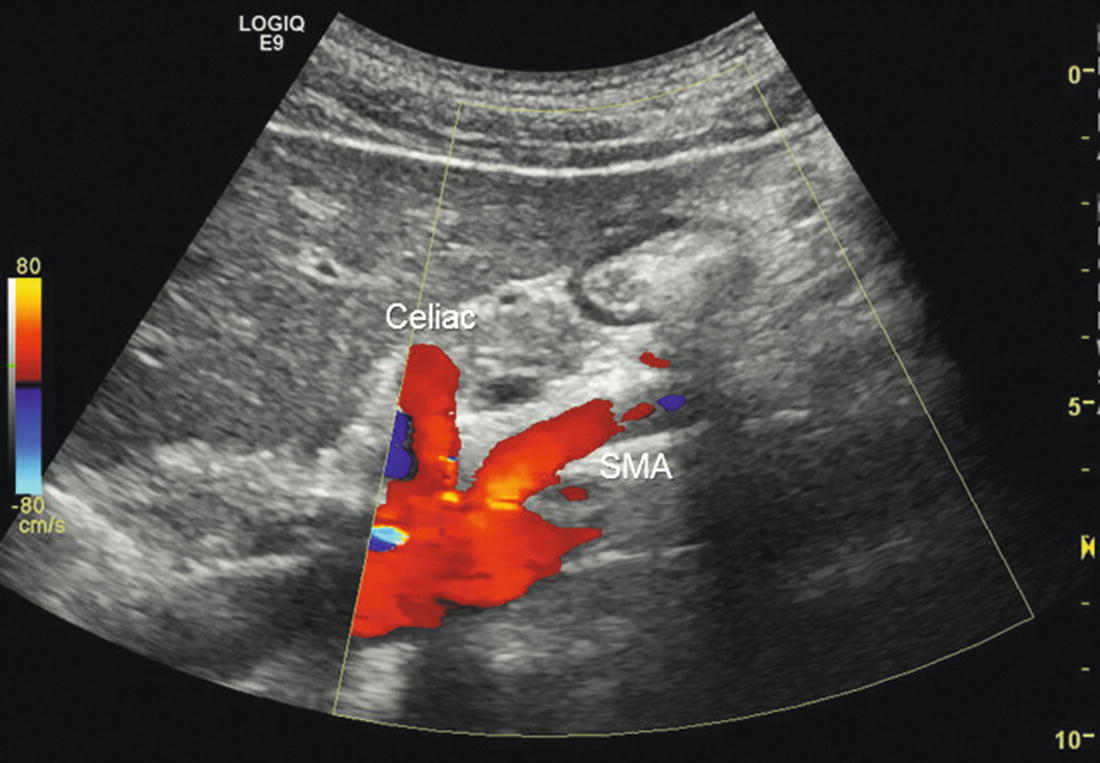
FIGURE 23.6. Color flow image showing the origins of both the celiac artery and the superior mesenteric artery (SMA) from the aorta in a sagittal view.
Measurement of both fasting and postprandial blood flow velocities is not necessary to identify hemodynamically significant SMA stenosis, and a postprandial evaluation adds little information to the fasting duplex examination.24,25 Comparison of fasting and postprandial duplex ultrasound velocities with angiographic stenosis measurements in the SMA of healthy controls and vascular disease patients slightly increased the specificity and positive predictive value but did not improve overall accuracy.24 However, it has been shown that PSV and EDV increase following a meal in the SMA but not in the celiac artery, reaching a maximum around 45 minutes after eating, with the EDV showing the largest proportional increase (Fig. 23.7).25 Ingestion of water alone does not result in an increase in the SMA velocity parameters.
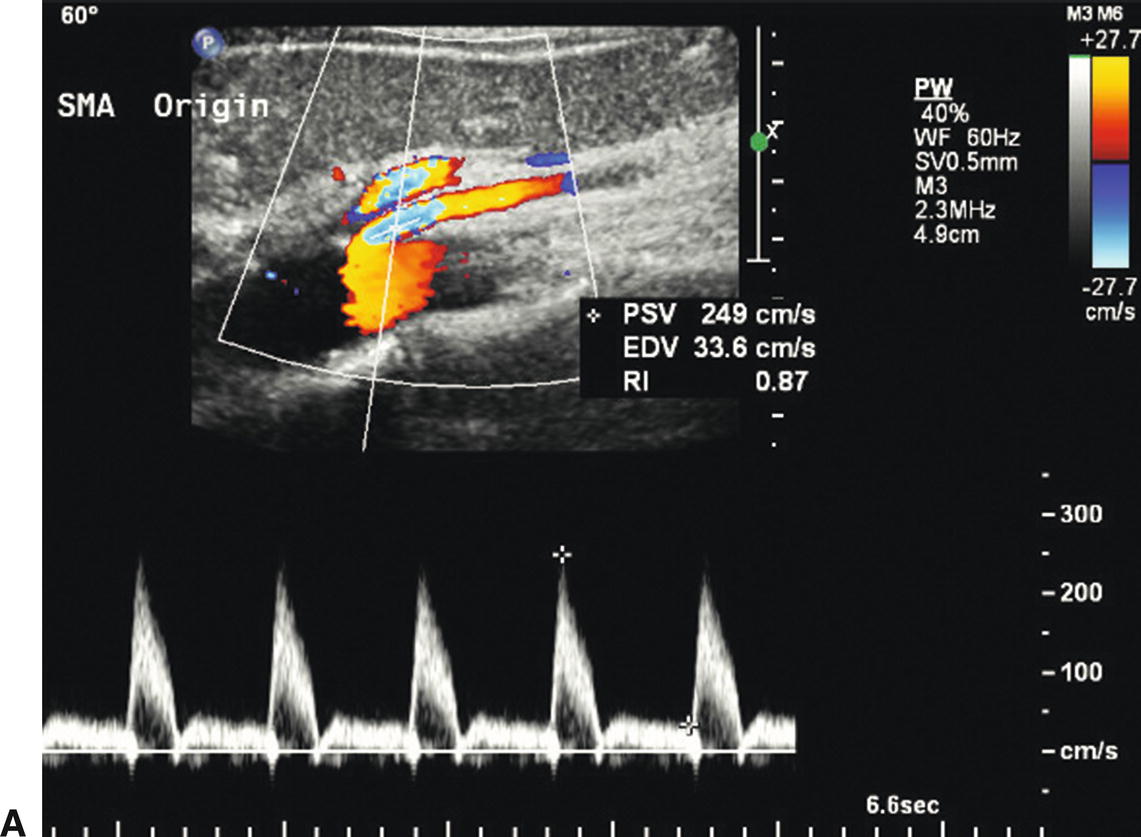
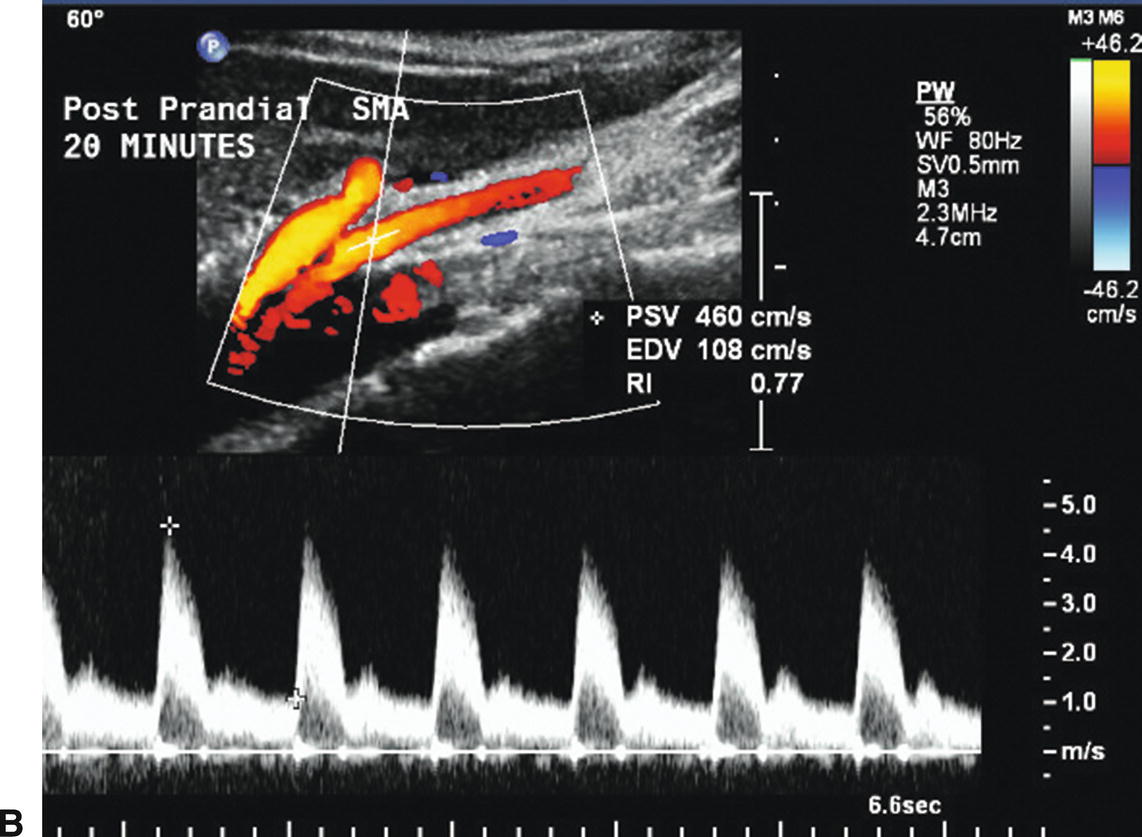
FIGURE 23.7. Fasting and postprandial flow velocities in a normal superior mesenteric artery (SMA). A,Color flow image and Doppler spectral waveform in the fasting state with peak systolic velocity (PSV) of 249 cm/s and end-diastolic velocity (EDV) of 34 cm/s. B,Repeat evaluation 20 minutes after eating shows PSV of 460 cm/s and EDV of 108 cm/s.
When scanning patients with possible median arcuate ligament compression syndrome, representative Doppler spectral waveforms should be obtained from the celiac artery and SMA during deep inspiration and compared with waveforms obtained during complete expiration and normal respiration (Fig. 23.8). Transient compression of the celiac artery origin by the median arcuate ligament of the diaphragm is apparent during expiration but resolves with descent of the diaphragm during inspiration.
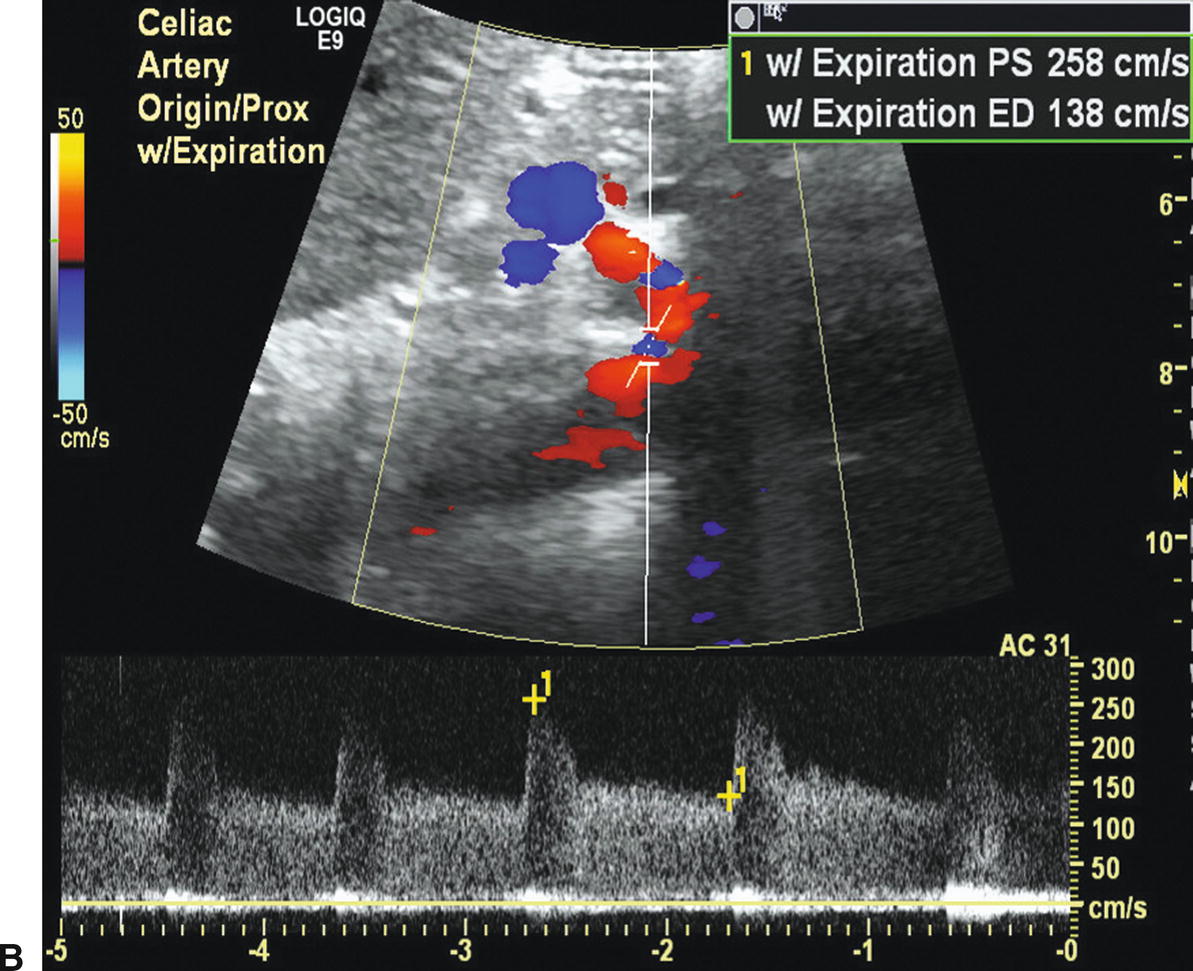
FIGURE 23.8 Color flow images and Doppler spectral waveforms from the celiac artery during inspiration (A) and expiration (B) illustrate the findings with median arcuate ligament compression. Note the change in peak systolic velocity (PSV) from 184 (inspiration) to 258 cm/s (expiration) and end-diastolic velocity (EDV) from 64 (inspiration) to 138 cm/s (expiration). These changes are due to compression of the celiac artery by the median arcuate ligament during expiration that resolves with inspiration. The color flow images also show some “straightening” of the proximal celiac artery during inspiration.
For mesenteric bypass grafts and stented mesenteric arteries, it is important to know the locations of the proximal and distal anastomoses or the sites of stent placement before attempting to perform the scan, as these reconstructions are quite variable in configuration (Fig. 23.9). In some cases, review of the procedure based on operative notes or discussion with the treating physician may be necessary. When evaluating bypassed or stented mesenteric arteries, representative B-mode images and Doppler spectral waveforms with velocity measurements should be recorded at the proximal, mid, and distal sites. The inflow and outflow arteries must be included along with Doppler spectral waveforms throughout the stent or graft. The Doppler sample volume should be “walked” through the proximal anastomosis, the body of the graft, the distal anastomosis, and into the outflow artery (Figs. 23.10 to 23.12).
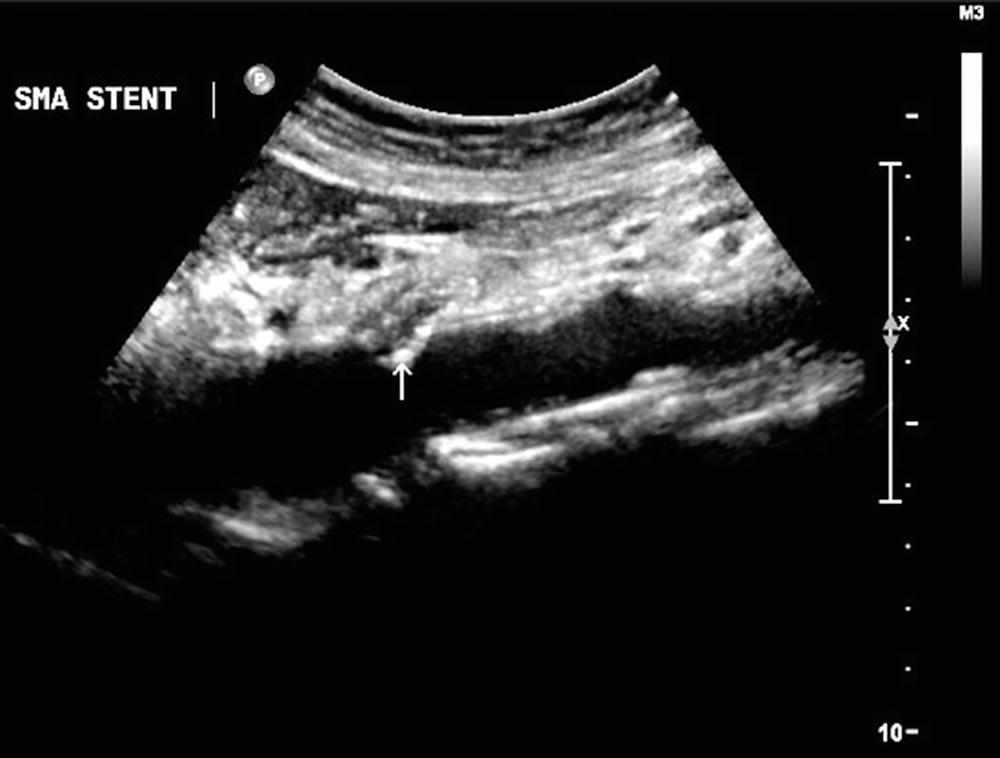
FIGURE 23.9. B-mode image of a stent in the superior mesenteric artery (SMA). In this sagittal plane view, the proximal end of the stent is protruding slightly into the adjacent aorta (arrow).
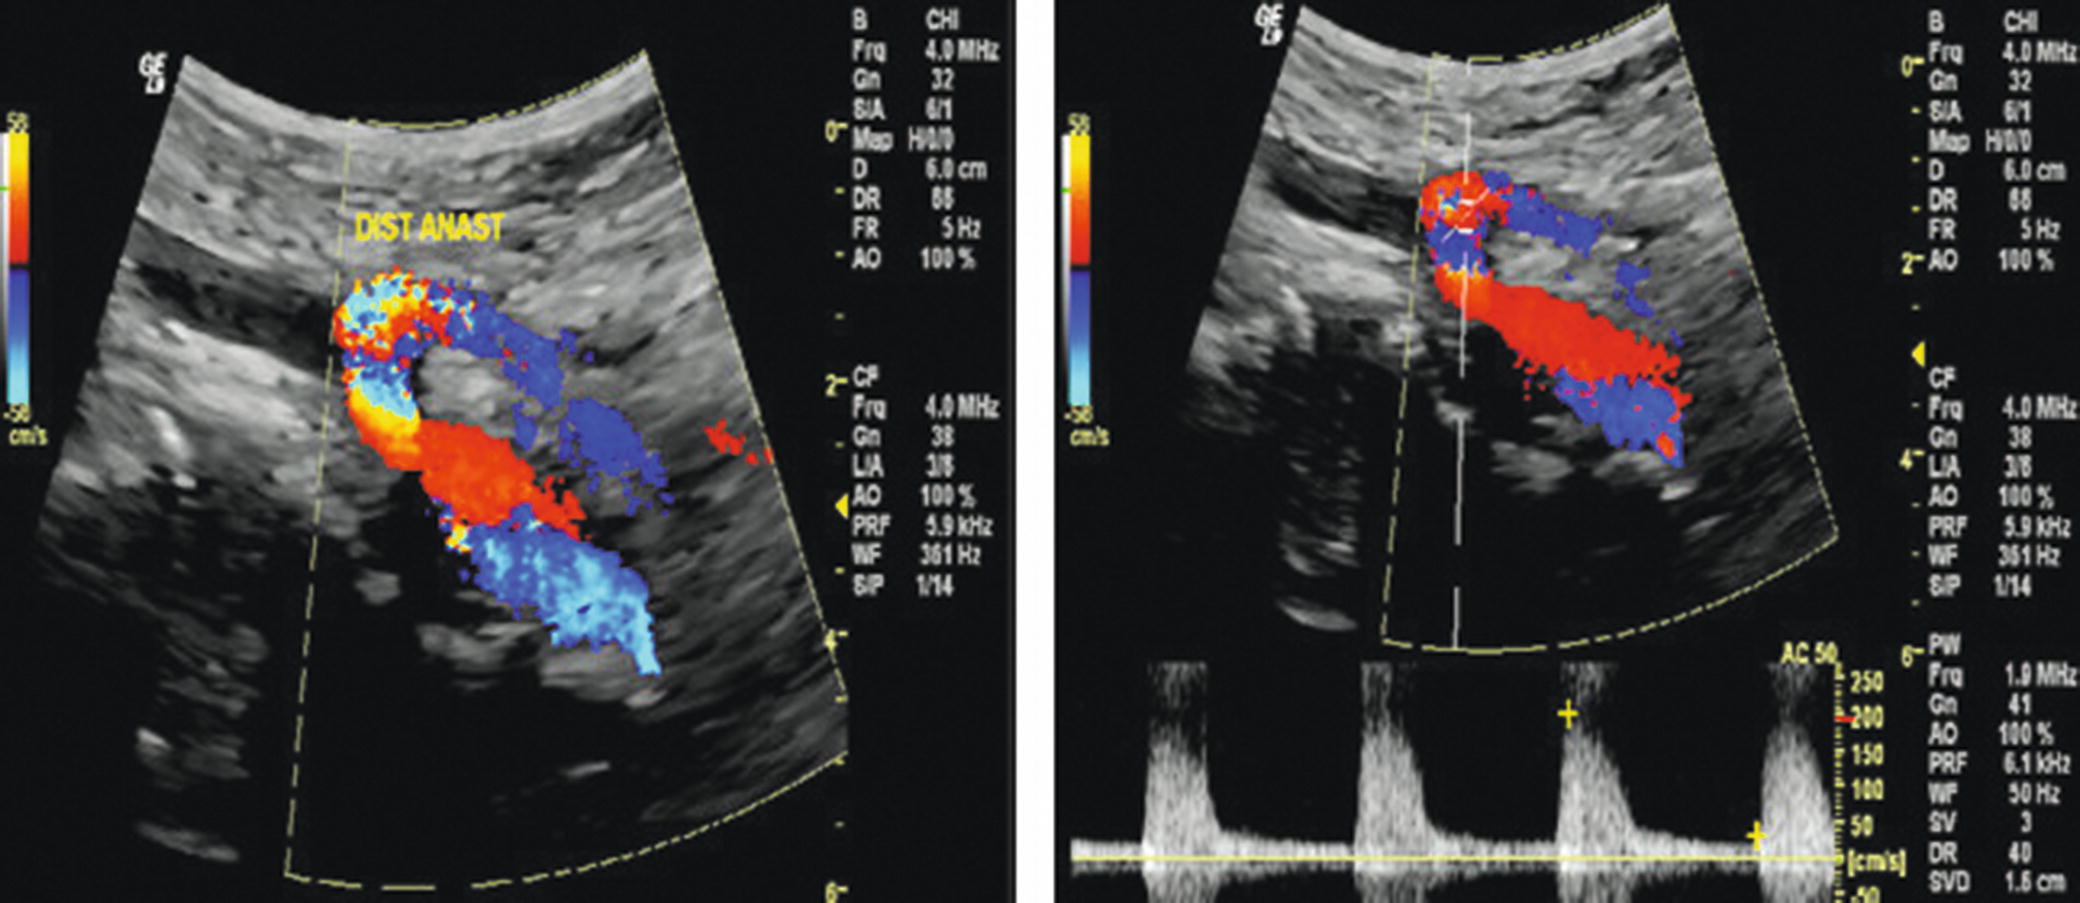
FIGURE 23.10. Duplex images of a retrograde external iliac artery to superior mesenteric artery (SMA) bypass graft. Left,color flow image shows a patent bypass graft with the distal anastomosis to the SMA. Right,Doppler spectral waveform at the distal anastomosis shows a high-resistance flow pattern.
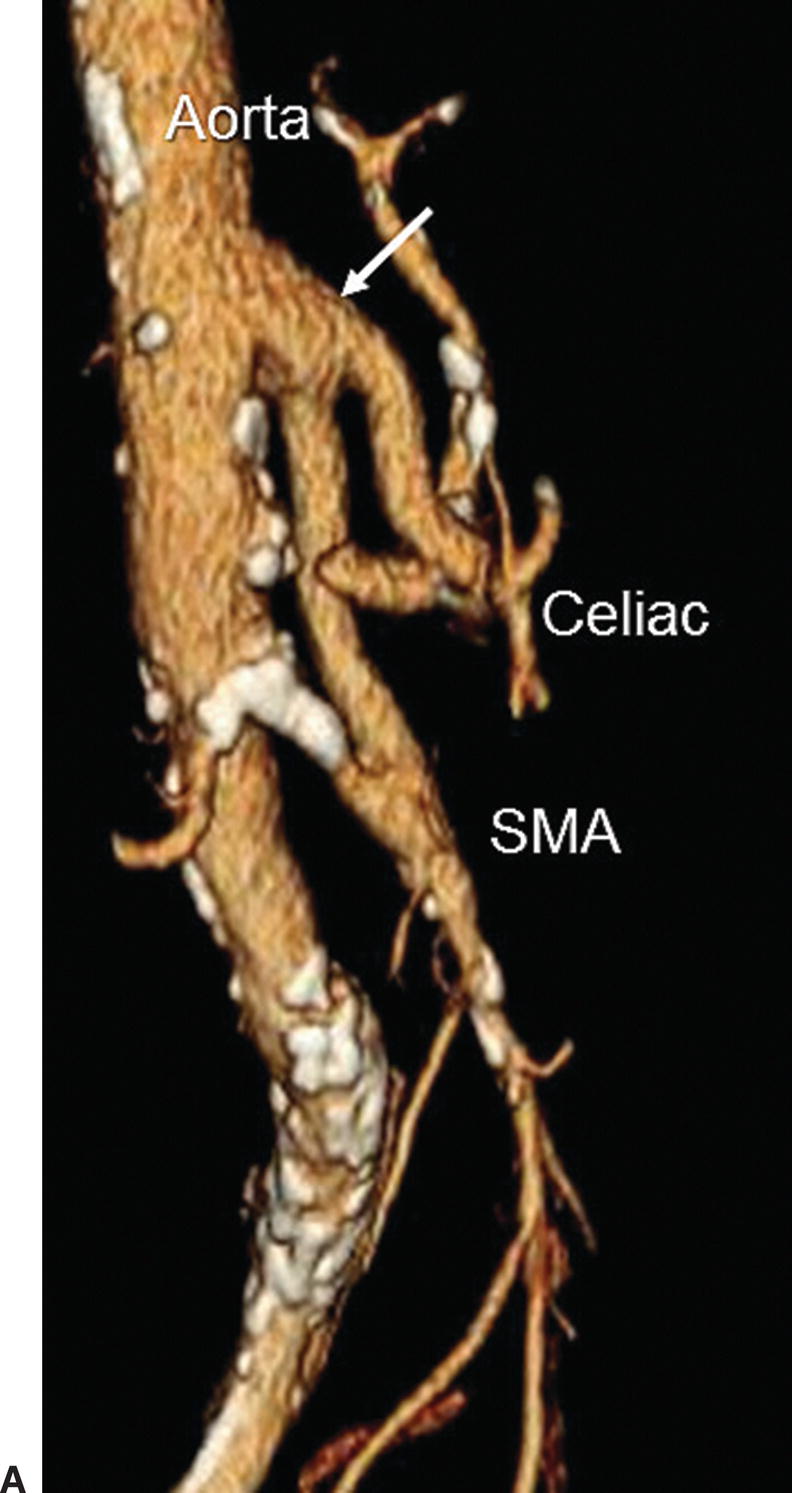
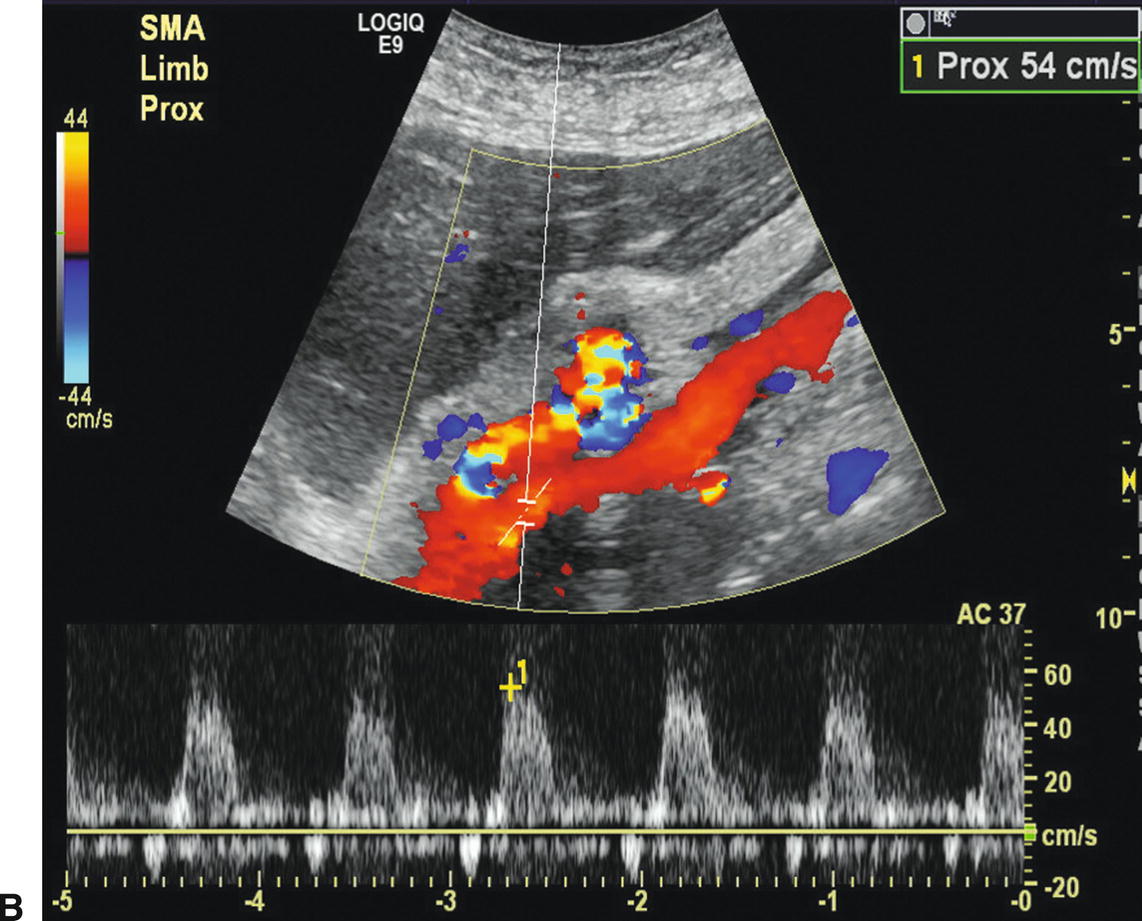
FIGURE 23.11. A,3D rendering from a CT angiogram showing an antegrade bypass graft from the supraceliac aorta to the celiac artery and superior mesenteric artery (SMA). The main body of the bifurcated graft is indicated by the arrow. B,Duplex image of the bypass graft with the pulsed Doppler sample volume positioned in the SMA limb and a peak systolic velocity of 54 cm/s.
Stay updated, free articles. Join our Telegram channel

Full access? Get Clinical Tree


