Mediastinum
Computed tomography (CT) is indispensable in imaging the mediastinum. Although conventional radiographs can show recognizable abnormalities in many patients with mediastinal pathology, radiographs are limited in their sensitivity and ability to delineate the extent of mediastinal abnormalities and the relationship of masses to specific mediastinal structures.
Because of its excellent density resolution and tomographic format, CT is able to identify normal mediastinal structures, opacified vessels, and vascular abnormalities and is often able to characterize masses based on their attenuation and precisely localize them as to their extent and site of origin.
The indications for mediastinal CT can be divided into two broad categories. First, CT is commonly used to define and characterize a mediastinal abnormality suspected or diagnosed on plain chest radiographs. When a mediastinal contour abnormality is visible on plain films, CT should generally be the next imaging procedure performed. Second, CT is often used to evaluate the mediastinum in patients who have normal chest radiographs yet a clinical reason to suspect mediastinal disease. For example, CT has been shown to be of significant value in the detection and assessment of mediastinal masses or lymph node abnormalities in patients with neoplasm or granulomatous disease and in the detection of a pathologic process in patients with conditions such as myasthenia gravis or surgically resistant hyperparathyroidism, which can be associated with a mediastinal mass (thymoma and ectopic parathyroid adenoma, respectively) (1,2,3,4).
The clinical indications for mediastinal magnetic resonance imaging (MRI) are somewhat more limited (5,6,7,8,9,10,11,12). In certain situations, MRI provides diagnostic information superior to that available from CT, and MRI can be used as the primary imaging modality. Primary uses of MRI include (a) the diagnosis of mediastinal abnormalities that are suspected to be vascular, (b) the evaluation of posterior mediastinal or paravertebral masses and neurogenic tumors, and (c) distinguishing mass and fibrous tissue in a patient with treated lymphoma or carcinoma in whom tumor recurrence may be present. These primary uses of MRI generally relate to its ability (a) to image vessels, (b) to distinguish different tissues, (c) to image in non-transaxial planes, or (d) to obviate iodinated contrast material. In many other instances, however, MRI is best reserved as a secondary or problem-solving tool, in patients who have equivocal or confusing CT findings, or in whom specific anatomic information is required, which is less clearly demonstrated using CT (5,9,10,13). In such cases, a limited number of MR images can be helpful.
It is important to understand, however, that if MRI provides diagnostic information that is merely equivalent to that of CT, then CT is usually the more appropriate clinical study (5). CT is less expensive, is more available, takes less time, is easier for debilitated patients to tolerate, often provides more ancillary information, and has an established role in the clinical diagnosis of a number of entities. However, it is a mistake to think of CT and MRI as necessarily competitive. Rather, CT and MRI can be complementary
in many instances—each has its own particular strengths that may be advantageous in specific circumstances.
in many instances—each has its own particular strengths that may be advantageous in specific circumstances.
Computed Tomography Techniques
The use of helical CT to acquire a volumetric dataset during a single breath-hold period is fundamental to imaging the mediastinum and thorax. This technique eliminates misregistration between adjacent slices, and because of the rapid scan time, minimizes respiratory and, to a lesser degree, cardiac motion artifacts. As important, rapid acquisition of scan data ensures optimal delivery and utilization of intravenous contrast material, not only ensuring that all mediastinal vessels will be opacified on all sections but allowing a more accurate assessment of normal and abnormal vessels.
It is best to think of helical CT as a method for acquiring a volumetric dataset, which may then be interrogated by the viewer to create two-dimensional (2D) or three-dimensional (3D) displays of varying thickness and in various planes anywhere within the scan volume; examples of 3D reconstructions include shaded surface displays, 3D displays from an endoluminal perspective (e.g., virtual bronchoscopy, endoscopy, or aortography), and maximum and minimum intensity projection imaging (13,14,15,16,17,18,19,20,21,22,23,24,25).
However, despite the ease of performing multiplanar or 3D reconstructions with current CT scanners, routine transaxial images are well suited to the assessment of a number of mediastinal structures, such as the trachea, esophagus, aorta, and superior vena cava, which are oriented perpendicular to the plane of scan and are thus imaged in cross section; provide a good display of most lymph node–bearing regions in the mediastinum; and are usually sufficient for the diagnosis of mediastinal abnormalities. The use of image reconstruction in non-transaxial planes is most useful in demonstrating the aorta, great vessels, pulmonary arteries, or trachea along their longitudinal axes (25,26,27,28,29). In selected cases, reconstructions may be of value in showing the relationship of a mediastinal mass to structures such as the heart, aorta, pleura, or diaphragm, but generally their use is of limited value. For example, the role of multiplanar image reconstruction in staging lung cancer was assessed in 41 consecutive patients with lung cancer who underwent multislice helical CT (30). Although a significant increase in confidence was found when diagnosing various features of the primary tumor by using multiplanar reconstructions, no significant difference was demonstrated in the diagnosis of mediastinal lymphadenopathy (30). A meta-analysis of virtual bronchoscopy, including 17 studies and 459 patients, has indicated a sensitivity of 84% and a specificity of 75% in the diagnosis of central airway lesions (20). The use of virtual bronchoscopy may also be of value in guiding the bronchoscopic biopsy of mediastinal lesions (24).
Performing a helical examination requires a number of technical choices. In addition to standard options such as kVp, mAs, field of view, and reconstruction algorithm, these include contrast administration (intravenous or oral), detector width, pitch, reconstruction interval, and reconstruction plane. In addition, important choices regarding contrast administration must be made, including type of contrast agent, rate and method of infusion, and optimal scan delay. These decisions are further complicated by the frequent need to integrate chest imaging with neck and/or abdominal examinations.
Using multidetector CT, scanning the entire thorax during suspended respiration is easily achieved. It is optimal to acquire the scan data using a narrow detector width (e.g., 1 mm), with the volumetric data reconstructed as thicker images (e.g., 5 mm) for routine viewing. Thinner slices may also be reconstructed and are sometimes required for (a) small lesions, (b) imaging regions in which anatomic structures are not oriented perpendicular to the scan plane [such as in the aortopulmonary window (APW)], (c) when mediastinal fat is lacking, or (d) if hilar structures and bronchi also need to be assessed. Non-transaxial image reconstructions may be obtained as needed for diagnosis but are not generally considered routine.
Although adequate images can often be obtained without the use of intravenous contrast media, especially if the primary indication for CT is to determine the presence or absence of a mediastinal mass, in our experience whenever possible the use of contrast administration should be encouraged (31). Contrast infusion can be indispensable in identifying and differentiating between vascular and nonvascular structures. Contrast media should be used routinely if clinical or radiographic findings suggest the possibility of (a) a vascular abnormality (Fig. 4-1), (b) a hilar mass or hilar lymph node enlargement (as in patients with lung cancer) (Fig. 4-2), or (c) a mediastinal mass that may be invading or compressing vessels (as in the presence of superior vena cava syndrome) (Fig. 4-2). Also, the enhancement characteristics of some mediastinal lesions can be helpful in diagnosis or differential diagnosis. For example, in patients with active tuberculosis (TB), enlarged mediastinal lymph nodes often show a low-attenuation center and an enhancing rim on contrast-enhanced CT, findings that can strongly suggest the diagnosis (32,33,34). Similarly, contrast enhancement may be an invaluable aid in assessing the presence and extent of tumor necrosis as occurs in some patients with lymphomas or germ-cell tumors (35,36). Use of contrast enhancement also allows differentiation of highly vascular lymph nodes and tumors from patients with avascular masses or cysts. In patients with a contraindication to administration of iodinated contrast agents, gadolinium may be used as an alternate contrast agent with rapid multidetector scanners (37).
Obtaining both precontrast and postcontrast images is not usually necessary but may be of value in some cases. On enhanced images it may be impossible to distinguish a high-attenuation mass (e.g., containing calcium or blood) from an enhancing mass. Unenhanced images are also valuable in the diagnosis of aortic intramural hematoma.
Delayed images may also be obtained if unenhanced images were not obtained prospectively.
Delayed images may also be obtained if unenhanced images were not obtained prospectively.
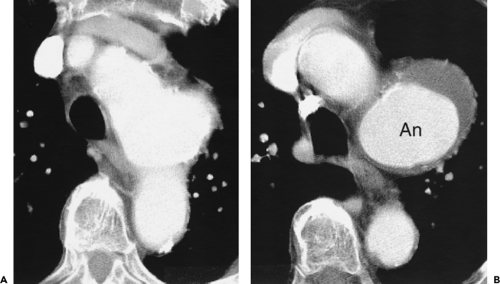 Figure 4-1 Vascular disease: value of contrast-enhanced helical CT. A: Helical CT sections following the bolus injection of 120 mL 60% iodinated contrast media at a rate of 2 mL/second in a patient with a left mediastinal mass visible on chest radiographs shows a focal saccular aneurysm of the aortic arch. Note that in B the contrast-opacified lumen of the aneurysm (An) can be clearly distinguished from clot lining its wall. |
If contrast injection is required, it is best administered in the form of a rapid bolus, preferably utilizing a power injector. Because of the rapid scan acquisition possible with current scanners, the use of reduced amounts of contrast is possible, even when injection at a high rate. It has been suggested that the use of reduced iodine concentration, achieved by diluting full-strength contrast medium with saline, may be useful by reducing venous flow artifacts and
improving image quality (38). However, this technique is not in wide use. Contrast administration at the rate of 3 to 4 mL/second is typical.
improving image quality (38). However, this technique is not in wide use. Contrast administration at the rate of 3 to 4 mL/second is typical.
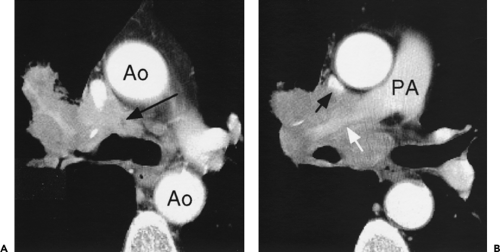 Figure 4-2 Superior vena caval obstruction: bronchogenic carcinoma. A: Contrast-enhanced helical CT in a patient with radiographic evidence of a right hilar mass obtained following a bolus of 120 mL of 60% iodinated contrast media injected at a rate of 2 mL/second confirms the presence of tumor invading the mediastinum (arrow) anterior to the right main bronchus and carina. The aorta (Ao) and superior vena cava are densely opacified at this rate of contrast infusion. B: At a lower level, tumor surrounds and narrows the right pulmonary artery (white arrow) and compresses the superior vena cava (black arrow). PA, main pulmonary artery. |
It should be noted that regardless of technique, although it is common to see small bubbles of air in the most anterior part of the left brachiocephalic vein or main pulmonary artery after contrast infusion, clinically significant venous air embolism is an unusual complication of intravenous contrast injection (39,40).
The use of retrospective electrocardiographic (ECG) and respiratory gating has been used to advantage with current multidetector scanners to significantly reduce cardiac and respiratory motion artifacts (41,42,43,44). It likely will be widely used, particularly when imaging small vessels such as the coronary arteries (43,45,46,47).
Magnetic Resonance Imaging Techniques
In our experience, MRI is best utilized to evaluate vascular structures in patients who cannot tolerate radiographic contrast agents or as a problem-solving modality when CT has proven inconclusive (5,6,7,12,48,49). MRI is useful in confirming the cystic nature of mediastinal lesions that appear of soft tissue attenuation on CT and, by revealing small amounts of intralesional fat, can suggest the diagnosis of hemangioma, teratoma, or extramedullary hematopoiesis. MRI is the preferred modality for imaging neurogenic tumors, because of its multiplanar capability and high contrast resolution; it is optimal for delineating the intraspinal extension and craniocaudad extent of neurogenic lesions (48).
Each case is individualized according to the information needed, and no standard algorithm is universally applicable. As a rule, following acquisition of initial coronal scout images, cardiac-gated, T1-weighted axial sections are obtained through regions of interest and are most valuable in demonstrating mediastinal structures and delineating the presence of a mediastinal mass. With gating, the effective repetition time (TR) is determined by the heart rate. Coronal and sagittal images are generally best reserved for specific indications, such as analyzing the chest wall, the APW, or subcarinal space (5,6,7).
T1-weighted images obtained following contrast administration or T2-weighted images are usually required only in those cases for which tissue characterization is deemed necessary. T2-weighted images may be acquired either utilizing a prolonged TR (2,000 ms) without cardiac gating or preferably utilizing cardiac gating (especially if the region of interest is near the heart or hila) with images obtained every second or third cardiac cycle. Gradient-refocused sequences with breath-holding also may be of value to reduce scan time and optimize visualization of vascular pathology. With this technique, flowing blood results in an intense signal, whereas soft tissue contrast is reduced.
Although, as noted previously, evaluation of mediastinal masses with MRI has traditionally relied on acquisition of conventional spin-echo (SE) T1- and T2-weighted images with ECG triggering supplemented with cine gradient-echo images as needed, image quality is heavily dependent on a good ECG signal. As a consequence, examinations are often suboptimal or even nondiagnostic in patients with abnormal cardiac rhythms. Even with optimal triggering, examination times are lengthy, which predisposes to degradation from patient motion. Finally, respiratory motion may also degrade image quality.
Technologic advances, which include the widespread use of echo-train fast spin-echo (ETFSE) pulse sequences, specialized phased-array multicoils and magnets with high performance gradient systems now provide for a comprehensive evaluation of the mediastinum with short acquisition times. Because of these advances, many sequences can be performed during a comfortable breath-hold, thus eliminating respiratory artifacts.
A typical imaging protocol for evaluation of a mediastinal mass now includes ECG-triggered ETFSE T1- and T2-weighted images. These can be acquired with breath-holding if the TR is sufficiently shortened at the expense of less slice coverage. Alternatively an ETFSE short T1 inversion recovery sequences could be used instead of T2-weighted images. In patients with abnormal cardiac rhythms and those who cannot breath-hold or are otherwise uncooperative, a diagnostic quality examination can still be performed with single shot ETFSE sequences with half Fourier reconstruction (HASTE). Because each slice is acquired in less than 1 second, these sequences are impervious to respiratory motion.
Finally, a comprehensive vascular evaluation can be performed with breath-hold 3D gadolinium-enhanced MRI. The ultrashort TR and echo time (TE) inherent to these pulse sequences allows for imaging the great vessels with a temporal resolution of as little as 10 seconds. This allows clear distinction between arteries and veins. In addition the 3D technique is amenable to high-quality multiplanar reformations and can be postprocessed with maximum intensity projection (MIP) algorithms. These MIP images resemble conventional angiographic images. Gadolinium-enhanced 3D MRI represents a significant advance from the traditional time-of-flight techniques because saturation effects and pulsatility artifacts are minimized.
Normal Mediastinum: Regional Anatomy
The accurate interpretation of mediastinal images, whether obtained using CT or MRI, requires a detailed knowledge of normal cross-sectional anatomy. Transverse imaging is fundamental to most imaging studies. In addition, sagittal and coronal images can be valuable in selected cases and
may be obtained using MRI or by reformation of spiral CT data; some knowledge of mediastinal anatomy in these planes is also essential.
may be obtained using MRI or by reformation of spiral CT data; some knowledge of mediastinal anatomy in these planes is also essential.
Transverse Plane
Cross-sectional anatomy is best learned using CT. In most respects, the anatomy of mediastinal structures shown using MRI is identical to that shown on CT, although the gray-scale representation of various tissues is different with the two techniques.
The anatomy of the mediastinal great vessels and airways is discussed in detail in subsequent chapters, but it also is reviewed briefly in this section, as a knowledge of this anatomy is important in understanding the mediastinum as a whole. The aorta and its branches, the great veins, the pulmonary arteries, and the trachea and main bronchi serve as reliable guides to localizing other important mediastinal structures. Furthermore, the relationship between vessels and other mediastinal structures is important to know if the potential effects of masses on vascular structures is to be assessed.
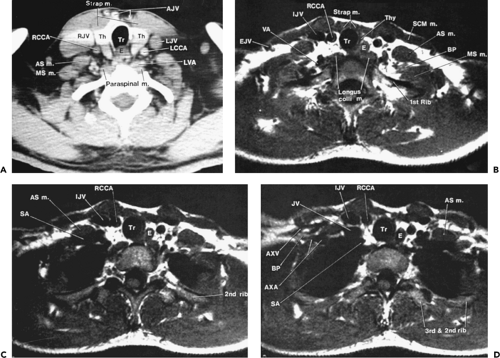 Figure 4-3 Thoracic inlet: CT and MRI evaluation. A: CT section through the lower neck, just above the thoracic inlet. Note the close proximity of the thyroid gland to the trachea. B–D: Sequential MR images from above-downward through the thoracic inlet. The anatomy of the thoracic inlet is especially well visualized with MRI. Note the relationship between the anterior scalene muscle and the subclavian artery that lies immediately posteriorly. The brachial plexus usually can be identified just above the subclavian artery as it passes behind the anterior scalene. AJV, anterior jugular veins; ASm, anterior scalene muscle; AXA, axillary artery; AXV, axillary vein; BP, brachial plexus; E, esophagus; EJV, external jugular vein; IJV, internal jugular vein; JV, jugular vein; LCCA, left common carotid artery; LJV, left jugular vein; LVA, left vertebral artery; MSm, middle scalene muscle; RCCA, right common carotid artery; RJV, right jugular vein; SA, subclavian artery; SCMm, sternocleidomastoid muscle; Th, Thy, thyroid; Tr, trachea; VA, vertebral artery. |
As an aid to understanding regional mediastinal anatomy, the mediastinum can be conceptualized as divided into several compartments, respectively, from superior to inferior, (a) the superior or supra-aortic mediastinum; (b) the region of the aortic arch, subaortic mediastinum, and APW; (c) the subcarinal space and azygoesophageal recess; and (d) the paracardiac mediastinum.
Superior or Supra-aortic Mediastinum
At or near the thoracic inlet (Figs. 4-3 and 4-4), the mediastinum is relatively narrow from anterior to posterior.
The trachea appears central in the supra-aortic mediastinum. The esophagus lies posterior to the trachea at this level, but depending on the position of the trachea relative to the spine, the esophagus can be displaced to right or left. It is usually collapsed and appears as a flattened structure of soft tissue attenuation, but small amounts of air or air and fluid may sometimes be seen in its lumen (Fig. 4-4A).
The trachea appears central in the supra-aortic mediastinum. The esophagus lies posterior to the trachea at this level, but depending on the position of the trachea relative to the spine, the esophagus can be displaced to right or left. It is usually collapsed and appears as a flattened structure of soft tissue attenuation, but small amounts of air or air and fluid may sometimes be seen in its lumen (Fig. 4-4A).
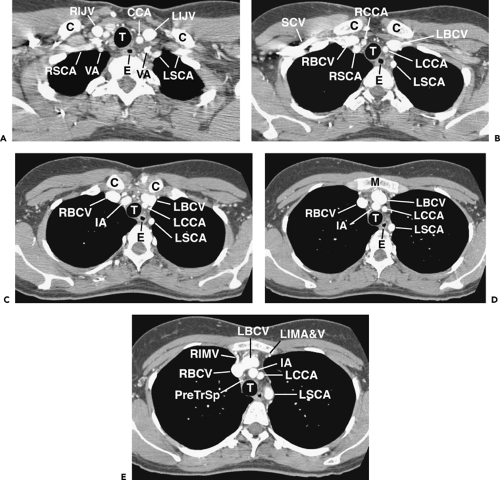 Figure 4-4 Supra-aortic mediastinum: normal CT anatomy. Sections were obtained using 1.25-mm slice thickness during contrast injection at a rate of 4.5 mL/sec. A: At the level of the lung apices, the trachea (T) is clearly seen, with the air-filled esophagus posterior and to the left of it. The right (RIJV) and left internal jugular (LIJV) veins are located lateral to the trachea, being seen medial to the clavicles (C). The common carotid arteries (CCA) are medial to the jugular veins. The vertebral arteries (VA) and the right (RSCA) and left (LSCA) subclavian arteries are also visible at this level. B: At 2.5 mm below A, the right (RBCV) and left (LBCV) brachiocephalic veins are visible posterior to the clavicular heads (C). The large arterial branches of the aorta are situated anterior and lateral to the trachea (T). The left subclavian artery (LSCA) is most posterior and is situated lateral to the trachea and esophagus (E), contacting the mediastinal pleura. The left common carotid artery (LCCA) is anterior to the left subclavian artery and is somewhat variable in position. The right common carotid artery (RCCA) is usually anterior and to the right of the tracheal midline. The right subclavian artery (RSCA) lies to the right of the trachea and is posterolateral to the right common carotid. The right subclavian vein (SCV) is densely opacified because of contrast injection into the right arm. C: At 5 mm below B, the right (RBCV) and left (LBCV) brachiocephalic veins are visible in the anterior mediastinum, posterior to the clavicles (C). The left subclavian (LSCA) and common (LCCA) carotid arteries maintain the same positions relative to the trachea (T) and esophagus (E) as in B. The innominate artery (IA) is visible at this level, anterior and to the right of the trachea. D: At 2.5 mm below C, the left (LBCV) brachiocephalic vein begins to cross the mediastinum and is located posterior to the manubrium (M). The right brachiocephalic vein (RBCV) is anterior and to the right of the trachea (T), contacting the mediastinal pleura. The innominate artery (IA) is anterior to the trachea at this level. LSCA, left subclavian artery; LCCA, left common carotid artery; E, esophagus. E: At 2.5 mm below D, the left (LBCV) brachiocephalic vein joins the right (RBCV) to form the superior vena cava. The right internal mammary vein (RIMV) is visible arising from the anterior right brachiocephalic vein. The left internal mammary artery and vein are also visible (LIMA&V). The innominate artery (IA) and the left common carotid (LCCA) arteries are closely opposed near their origins from the aortic arch. Mediastinal fat and normal lymph nodes occupy the pretracheal space (PreTrSp), anterior to the trachea (T) and posterior to the vascular structures. |
Above the level of the aortic arch, the large arterial branches of the aorta (i.e., the innominate artery, the left common carotid artery, and the left subclavian artery) and the brachiocephalic veins are the most apparent normal structures, other than the trachea and esophagus (Figs. 4-4 and 4-5). At or near the thoracic inlet, the brachiocephalic veins are the most anterior and lateral vascular branches visible, lying immediately behind the clavicular heads. Although they vary in size, their positions are relatively constant. The great arterial branches lie posterior to the veins and adjacent to the anterior and lateral walls of the trachea. These can be reliably identified by their consistent positions.
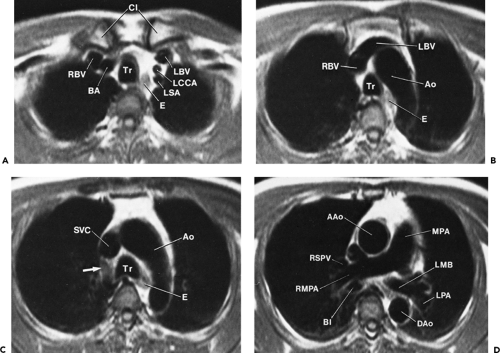 Figure 4-5 Cross-sectional MRI anatomy. A–D: Cardiac-gated MR images through the mediastinum from above-downward. Note that signal is present within the azygos vein, posterior to the SVC (arrow in C), presumably secondary to slow flow. Tr, trachea; LBV, left brachiocephalic vein; LCCA, left common carotid artery; LSA, left subclavian artery; E, esophagus; RBV, right brachiocephalic vein; BA, brachiocephalic artery; Cl, clavicles; Ao, aorta; SVC, superior vena cava; MPA, main pulmonary artery; LMB, left mainstem bronchus; LPA, left interlobar pulmonary artery; DAo, descending aorta; BI, bronchus intermedius; AAo, ascending aorta; RSPV, right superior pulmonary vein; RMPA, right main pulmonary artery. |
Below the thoracic inlet, the left brachiocephalic vein crosses the mediastinum from left to right, anterior to the arterial branches of the aorta (Figs. 4-4D and E). The two brachiocephalic veins have very different configurations. The right brachiocephalic vein has a nearly vertical course throughout its length; the left brachiocephalic vein is longer and courses horizontally as it crosses the mediastinum. The horizontal segment of the left brachiocephalic vein is a convenient anatomic landmark, being the line of demarcation between the anterior mediastinum (the prevascular space) that is anterior to it and the middle mediastinum posterior to it. The precise cephalocaudal location of this vein is quite variable;
although it is most frequently visible at the level of the great vessels, the horizontal portion of the left brachiocephalic vein also can be seen at the level of the aortic arch (Fig. 4-5B). Because of the central location of the left brachiocephalic vein in the supra-aortic mediastinum, when a mass is suspected in this region, intravenous contrast medium can be injected using a left-sided arm vein. This maximizes visualization of the full length of the left brachiocephalic vein.
although it is most frequently visible at the level of the great vessels, the horizontal portion of the left brachiocephalic vein also can be seen at the level of the aortic arch (Fig. 4-5B). Because of the central location of the left brachiocephalic vein in the supra-aortic mediastinum, when a mass is suspected in this region, intravenous contrast medium can be injected using a left-sided arm vein. This maximizes visualization of the full length of the left brachiocephalic vein.
The innominate artery is located in close proximity to the anterior tracheal wall, near its midline or slightly to the right of midline in most normal patients; it is the most variable of all the great arteries (Figs. 4-4C–E and 4-5A). The left common carotid artery lies to the left and slightly posterolateral to the innominate artery; generally it has the smallest diameter of the three major arterial branches. The left subclavian artery is a relatively posterior structure throughout most of its course, lying to the left of and frequently directly lateral to the trachea. The lateral border of the left subclavian artery typically indents the mediastinal surface of the left upper lobe.
Other than the great vessels, trachea, normal lymph nodes, and esophagus, little is usually seen in the supra-aortic mediastinum. Small vascular branches, particularly the internal mammary veins, can sometimes be seen in this part of the mediastinum (Fig. 4-4D). In some patients, the thyroid gland may extend into the superior mediastinum, and the right and left thyroid lobes may be visible on each side of the trachea. This appearance is not abnormal and does not imply thyroid enlargement. On CT, the thyroid can be distinguished from other tissues or masses; because of its iodine content, its attenuation is greater than that of soft tissue.
Aortic Arch, Subaortic Mediastinum, and Aortopulmonary Window
Although the supra-aortic region largely contains arterial and venous branches of the aorta and vena cava, this compartment contains the undivided mediastinal great vessels, including the aorta, superior vena cava, and pulmonary arteries. This compartment also contains a number of important lymph node groups.
The aortic arch has a characteristic but somewhat variable appearance. The anterior aspect of the arch is located anterior and to the right of the trachea, with the arch passing to the left and posteriorly (Figs. 4-5B and C and 4-6). The posterior arch usually lies anterior and lateral to the spine. The aortic arch tapers slightly along its length, from anterior to posterior. The position of the anterior and posterior aspects of the arch can vary in the presence of atherosclerosis and aortic tortuosity; typically the anterior arch is located more anteriorly and to the right in patients with a tortuous aorta, although the posterior aorta lies more laterally and posteriorly, in a position to the left of the spine. At this level, the superior vena cava is visible anterior and to the right of the trachea, usually being elliptical (Figs. 4-5C and 4-6). The esophagus appears the same as at higher levels, being posterior to the trachea but variable in position (50). Often it lies somewhat to the left of the midline of the trachea.
The aortic arch on the left, the right brachiocephalic vein or superior vena cava and mediastinal pleura on the right, and the trachea posteriorly serve to define the pretracheal or anterior paratracheal space (Fig. 4-6A) (51,52). This fat-filled space contains middle mediastinal lymph nodes in the pretracheal or anterior paratracheal chain. Other mediastinal node groups are closely related to this group both spatially and in regard to lymphatic drainage. It is not uncommon to see a few normal-sized lymph nodes in this compartment.
Anterior to the great vessels (aorta and superior vena cava) at this level is another triangular space called the prevascular space. This compartment, which is anterior mediastinal, primarily contains lymph nodes, the thymus, and fat (Figs. 4-5C and 4-6). The apex of this triangular space represents the anterior junction line, which can sometimes be seen on chest radiographs. At higher levels in the mediastinum (Fig. 4-4), the prevascular space is anterior to the great arterial branches of the aorta and the brachiocephalic veins.
In young patients, usually in their teens or early twenties, CT shows the thymus to be of soft tissue attenuation (39,53,54,55,56,57,58). The thymus has two lobes, the right and the left, but the left thymic lobe often predominates. On CT, the thymus often appears bilobed or arrowhead shaped, with each of the two thymic lobes contacting the mediastinal pleura. Each lobe usually measures 1 to 2 cm in thickness (measured perpendicular to the pleura), but this is variable. In patients in whom the left thymic lobe predominates, the thymus appears to be predominantly left sided, paralleling the aortic arch. In adulthood, the thymus gradually involutes, and soft tissue attenuation elements are replaced by fat (53,54,55,57). Thus, in patients older than 30 years, the prevascular space appears to be primarily fat filled, with thin strands of wispy tissue passing through the fat. Most of this, including the fat, actually represents the thymus. At higher levels, the thymus is sometimes visible anterior to the brachiocephalic arteries and veins, within the prevascular space.
At a level slightly below the aortic arch, the ascending aorta and descending aorta are visible as separate structures (Fig. 4-6B and C). Characteristically, the descending aorta is slightly smaller (mean diameter 2.6 cm) than the ascending aorta (mean diameter 3.5 cm) (40).
At or near this level, the trachea bifurcates into the right and left main bronchi (Fig. 4-6C and D). Near the carina, the trachea commonly assumes a somewhat triangular shape (51,52). The carina itself is usually visible on CT. On the right side, the arch of the azygos vein enters
the posterior wall of the superior vena cava, passes over the right main bronchus, and continues posteriorly along the mediastinum, to lie to the right and anterior of the spine (59). Below the level of the azygos arch, the azygos vein is consistently seen in this position. The azygos arch is often visible on one or two adjacent slices and sometimes appears nodular (60). However, its characteristic location is usually sufficient to allow its correct identification. When the azygos arch is visible, it marginates the right border of the pretracheal space.
the posterior wall of the superior vena cava, passes over the right main bronchus, and continues posteriorly along the mediastinum, to lie to the right and anterior of the spine (59). Below the level of the azygos arch, the azygos vein is consistently seen in this position. The azygos arch is often visible on one or two adjacent slices and sometimes appears nodular (60). However, its characteristic location is usually sufficient to allow its correct identification. When the azygos arch is visible, it marginates the right border of the pretracheal space.
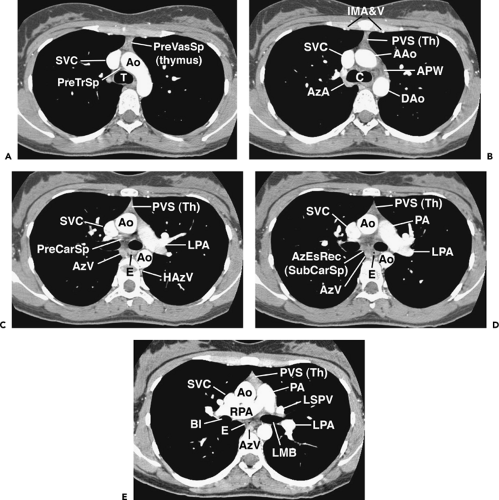 Figure 4-6 Aortic arch, subaortic mediastinum, and aortopulmonary window: normal CT anatomy. This is the same scan series as in Figure 4-4. A: Aortic arch level, 2.5 mm below Figure 4-5E. The superior vena cava (SVC) contacts the right mediastinal pleura, and along with the aortic arch (Ao) delineates the anterior aspect of the pretracheal space (PreTrSp). The trachea (T) delineates the posterior aspect of the pretracheal space. The prevascular space (PreVasSp) is anterior to the great vessels, and contains the thymus, which is of soft tissue attenuation in this patient. B: Subaortic mediastinum. Aorticopulmonary window level, 2.5 mm below A. At the level of the tracheal carina (C), the aorticopulmonary window (APW) is visible under the aortic arch, and between the ascending aorta (AAo) and proximal descending aorta (DAo). On the right side of the mediastinum, the azygos arch (AzA) is visible arising from the posterior aspect of the superior vena cava (SVC), contacting the right mediastinal pleura, and forming the lateral margin of the pretracheal (or in this instance, the precarinal) space. PVS, prevascular space; Th, thymus; IMA&V, internal mammary arteries and veins. C: Subaortic mediastinum. Left pulmonary artery level, 2.5 mm below B. The left pulmonary artery (LPA) marginates the caudal aspect of the aortopulmonary window. At this level the right and left main bronchi are visible. The precarinal space (PreCarSp) is continuous with the pretracheal space seen at higher levels. The triangular prevascular space (PVS) containing thymus (Th) remains visible. SVC, superior vena cava; Ao, aorta; AzV, posterior azygos vein; HAzV, hemiazygos vein; E, esophagus. D: Subcarinal space and azygoesophageal recess level, 2.5 mm below C. The superior aspect of the azygoesophageal recess (AzEsRec) is visible, in close relationship to the posterior azygos vein (AzV), esophagus (E), and subcarinal space (SubCarSp). PVS, prevascular space, Th, thymus; SVC, superior vena cava; Ao, aorta; PA, main pulmonary artery; LPA, left pulmonary artery. E: Right pulmonary artery and azygoesophageal recess, 3.75 mm below D. The right pulmonary artery (RPA) arises from the main pulmonary artery (PA) and crosses the mediastinum anterior to the subcarinal space, azygoesophageal recess, azygos vein (AzV), and esophagus (E). It is closely associated with the superior vena cava (SVC) and ascending aorta (Ao) along its anterior wall. PVS, prevascular space, Th, thymus; LPA, left pulmonary artery; LMB, left main bronchus; BI, bronchus intermedius; LSPV, left superior pulmonary vein. |
On the left side of the mediastinum, caudal to the aortic arch, but cephalad to the main pulmonary artery, is the region termed the aortopulmonary window (APW) (61). The APW contains fat, lymph nodes, the left recurrent laryngeal nerve, and the ligamentum arteriosum; the latter two are usually invisible. These lymph nodes freely communicate with those in the pretracheal space, and, in fact, a distinction between nodes in the medial APW from those in the left pretracheal space is rather arbitrary and generally unnecessary. In some patients, the APW is not well seen, with the main pulmonary artery lying immediately below the aortic arch. In such patients, it is usually difficult to distinguish APW lymph nodes from volume averaging of the adjacent aorta and pulmonary artery, unless thin collimation is used.
At or slightly below the APW, the level of the ascending aorta is first clearly seen in cross section (i.e., it is round or nearly round); a portion of the pericardial space, usually containing a small amount of pericardial fluid, extends cephalad, into the pretracheal space, immediately behind the ascending aorta. This part of the pericardium is called the superior pericardial recess (62,63). Although it can sometimes be confused with a lymph node, its typical location, immediately behind and contacting the aortic wall, its oval or crescentic shape, and its relatively low (water) attenuation allow it to be distinguished from a significant abnormality (see Fig. 4-81). Another part of the pericardial recess can sometimes be seen anterior to the ascending aorta and pulmonary artery.
Subcarinal Space and Azygoesophageal Recess
Below the level of the tracheal carina and azygos arch, the medial aspect of the right lung contacts the posterior aspect of the middle mediastinum, in close association to the azygos vein and esophagus (Figs. 4-6D and E). This part of the mediastinum, called the azygoesophageal recess, is important because of adjacent subcarinal lymph nodes and its close relationship to the esophagus and main bronchi. The contour of the azygoesophageal recess is concave laterally in the large majority of normal subjects, and a convexity in this region should be regarded as suspicious of mass, and the scan examined closely for a pathologic process. However, a convexity in this region may also be produced by a prominent normal esophagus or azygos vein and is particularly common in patients with a narrow mediastinum and in children (64).
In many subjects, the azygoesophageal recess is somewhat posterior to the node-bearing subcarinal space, which lies between the main bronchi (65). Normal nodes are commonly visible in this space, being larger than normal nodes in other parts of the mediastinum and up to 1.2 cm in short axis diameter (66,67). The esophagus usually is seen immediately behind the subcarinal space, and distinguishing nodes and esophagus may be difficult, unless the esophagus contains air or contrast material, or its course is traced on adjacent scans. At levels below the subcarinal space, the appearance of the azygoesophageal recess is relatively constant, although it narrows anteroposteriorly in the retrocardiac region (Figs. 4-6D and E and 4-7A–C).
Also, at or near this level, the main pulmonary artery divides into its right and left branches. The left pulmonary artery is somewhat higher than the right, usually being seen 1 cm above it, and appears as the continuation of the main pulmonary artery, directed posterolaterally and to the left (Figs. 4-6C–E and 4-7A). The right pulmonary artery arises at an angle of nearly 90 degrees to the main and left pulmonary arteries and crosses the mediastinum from left to right, anterior to the carina or main bronchi (Fig. 4-6E). The right pulmonary artery limits the most caudal extent of the pretracheal space.
The azygos vein parallels the esophagus along the right side of the mediastinum and laterally contacts the medial pleural reflections of the right lower lobe, defining the medial and posterior border of the azygoesophageal recess (Fig. 4-6D and E and 4-7A–C) (59). On the left side, the hemiazygos vein parallels the descending aorta, lying posterior to it; it is not always visible. The hemiazygos vein generally drains into the azygos vein via communicating branches that cross the midline, behind the aorta, in the vicinity of the T8 vertebral body. The communicating vein or veins are sometimes seen on CT in normal individuals (68,69).
Paracardiac Mediastinum
The heart occupies most of the inferior mediastinum, but other important structures at this level include the descending aorta, esophagus, azygos and hemiazygos veins, thoracic duct, vagus and inferior phrenic nerves, and the pericardium (Fig. 4-7). Important lymph node groups are found in relation to the azygoesophageal recess and esophagus at this level, the inferior pulmonary ligaments, the paravertebral regions, the diaphragm, and the pericardium.
The descending aorta and esophagus maintain the same relative positions as at higher levels. The azygos and hemiazygos veins are often but not always visible at this level; the azygos vein is larger and more easily seen.
The thoracic duct enters the thorax through the aortic hiatus, along the right anterior aspect of the spine. It
crosses to the left side near the T6 or T7 vertebral body, lying along the left lateral wall of the esophagus, adjacent to the descending aorta, and terminates near the junction of the left internal jugular and subclavian veins (see Fig. 4-117) (70,71,72). The thoracic duct measures a few millimeters in diameter in normal subjects. It is difficult to recognize on CT and distinguish from other vascular structures unless it is dilated (71). When visible on CT, it is low in attenuation. The thoracic duct is commonly visible on unenhanced MRI obtained with respiratory gating and using a 3D, half-Fourier, fast SE sequence. Using this technique, the thoracic duct has been reported to have a maximum diameter of 3.7 mm (SD 0.81 mm) in normal subjects (73).
crosses to the left side near the T6 or T7 vertebral body, lying along the left lateral wall of the esophagus, adjacent to the descending aorta, and terminates near the junction of the left internal jugular and subclavian veins (see Fig. 4-117) (70,71,72). The thoracic duct measures a few millimeters in diameter in normal subjects. It is difficult to recognize on CT and distinguish from other vascular structures unless it is dilated (71). When visible on CT, it is low in attenuation. The thoracic duct is commonly visible on unenhanced MRI obtained with respiratory gating and using a 3D, half-Fourier, fast SE sequence. Using this technique, the thoracic duct has been reported to have a maximum diameter of 3.7 mm (SD 0.81 mm) in normal subjects (73).
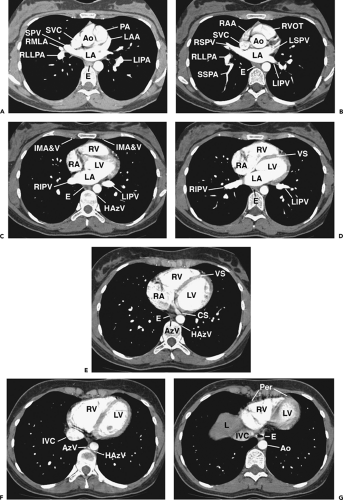 Figure 4-7 Paracardiac mediastinum: normal CT anatomy. This is the same scan series as in Figures 4-4 and 4-6. A: Left atrium and main pulmonary artery, 3.75 mm below E. The main pulmonary artery (PA) and ascending aorta (Ao) are anterior. The superior aspect of the left atrium (LA) is visible. The subcarinal space is no longer visible at this level, and the prevascular space becomes inconspicuous, although the inferior thymus is present anteriorly. The azygoesophageal recess remains visible. SVC, superior vena cava; SPV, superior pulmonary vein; RMLA, right middle lobe artery; RLLPA, right lower lobe pulmonary artery; LAA, left atrial appendage; LIPA, left interlobar pulmonary artery; E, esophagus. B: Left atrium, aortic root, and right ventricular outflow tract, 2.5 mm below Figure 4-8A. The right ventricular outflow tract (RVOT) and is anterior and the left atrium (LA) is posterior. The azygoesophageal recess remains visible. RAA, right atrial appendage; SVC, superior vena cava; RSPV, right superior pulmonary vein; RLLPA, right lower lobe pulmonary artery; SSPA, superior segment lower lobe pulmonary artery; Ao, aortic root; LSPV, left superior pulmonary vein; LIPV, left inferior pulmonary vein; E, esophagus. C: Cardiac chambers and paracardiac mediastinum, 2.5 mm below 8A. The prevascular space is nearly obliterated, as the heart fills the anterior mediastinum. The esophagus (E) is visible in the azygoesophageal recess, also containing lymph nodes. Similarly, the internal mammary artery and vein (IMA&V) indicate the location of the internal mammary chain of lymph nodes. The hemiazygos vein (HAzV) is associated with paravertebral lymph nodes. RV, right ventricle; LV, left ventricle; RA, right atrium; LA, left atrium; RIPV, right inferior pulmonary vein; LIPV, left inferior pulmonary vein. D: Cardiac chambers and paracardiac mediastinum, 2.5 mm below C. RV, right ventricle; LV, left ventricle; VS, ventricular septum; RA, right atrium; LA, left atrium; RIPV, right inferior pulmonary vein; LIPV, left inferior pulmonary vein; E, esophagus. E: Cardiac chambers and paracardiac mediastinum, 2.5 mm below D. RV, right ventricle; LV, left ventricle; VS, ventricular septum; RA, right atrium; CS, coronary sinus; E, esophagus; AzV, azygos vein; HAzV, hemiazygos vein. F: Cardiac chambers and paracardiac mediastinum, 5 mm below E. RV, right ventricle; LV, left ventricle; IVC, inferior vena cava; AzV, azygos vein; HazV, hemiazygos vein. Lymph nodes may be seen in relation to the azygos and hemiazygos veins, but are not visible in this normal subject. G: Cardiac chambers and paracardiac mediastinum, 3.75 mm below E. RV, right ventricle; LV, left ventricle; Per, pericardium; IVC, inferior vena cava; Ao, descending aorta; E, esophagus; L, liver dome. Lymph nodes may be seen in relation to the pericardium and diaphragm, but are not visible in this normal subject. The pericardium is usually visible as a thin line, a few millimeters in thickness and separated from the myocardium by a layer of fat. |
Caudally, the thoracic duct arises from the cisterna chili or a confluence of lymphatic vessels in the upper abdomen. Using T2-weighted images obtained with a single-shot fast SE technique, an abdominal confluence of lymphatics was visible anterior to the spine in 96% of subjects as a very intense structure (74). On routine MRI, it is less often seen (75). It was located at the level of L1–2 in one third of cases and in the midline in 70%. It most often appears tubular or sausage shaped, but it may also be recognized as parallel or converging tubular structures, as a focal round or oval fluid collection, or as a plexus of lymphatic channels (75). It is typically visible in a retrocrural location, lying between the azygos vein and descending aorta. Its mean longitudinal, anteroposterior, and transverse diameters measured in one study were 33.5±1.7 (SD) mm, 5.2±0.13 mm, and 5.2±0.15 mm, respectively (74).
The pericardium is often visible anterior and to the left of the heart, and normally measures 3 mm or less, although its visibility and appearance vary with slice thickness. Using rapid scan times to reduce cardiac pulsation artifacts, the normal pericardium appears 2 mm or less in thickness in 95% of subjects (76). Using 1-mm high-resolution CT (HRCT) slices, the upper limit of the thinnest portion of the normal pericardium (mean value + 2 SD) measured 0.7 mm (77). Focal thickening or a localized fluid collection is often visible in normal persons posterior to the lower sternum (78,79). Pericardial recesses and sinuses are also commonly visible using CT or MRI (80).
Sagittal and Coronal Planes
Although cross-sectional imaging of the mediastinum (Figs. 4-4, 4-6 and 4-7) is generally adequate to visualize most pathologic processes, sagittal and coronal imaging using MRI (Figs. 4-8, 4-9, 4-10 and 4-11) or reformatted spiral CT can sometimes add to our understanding of the origin and extent of disease. Utilization of multiplanar images, however, requires a detailed knowledge of normal relationships between mediastinal structures in both standard coronal
and sagittal planes. Once familiar, these images can be augmented by use of select parasagittal planes that maximize visualization of select regions, such as the APW.
and sagittal planes. Once familiar, these images can be augmented by use of select parasagittal planes that maximize visualization of select regions, such as the APW.
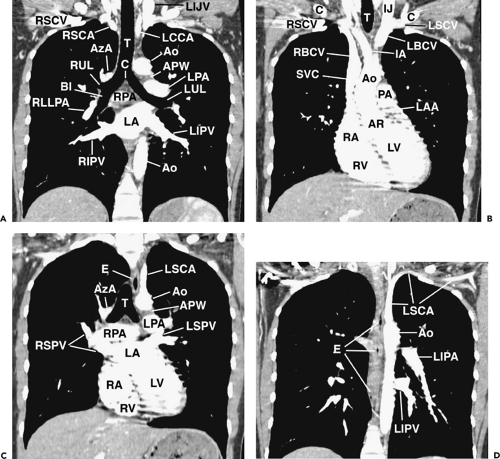 Figure 4-8 Coronal reformations in the same normal subject as shown in Figures 4-4, 4-6, and 4-7. A: Oblique coronal reformation in the plane of the trachea and main bronchi. T, trachea; C, carina; RSCV, right subclavian vein; RSCA, right subclavian artery; LIJV, left internal jugular vein; LCCA, left common carotid artery; AzA, azygos arch; RUL, right upper lobe bronchus; BI, bronchus intermedius; RLLPA, right lower lobe pulmonary artery; RIPV, right inferior pulmonary vein; LA; left atrium; LIPV, left inferior pulmonary vein; LUL, left upper lobe bronchus; LPA, left pulmonary artery; RPA, right pulmonary artery; APW, aortopulmonary window; Ao, aorta. The fat-filled subcarinal space lies between the carina and right pulmonary artery. B: Coronal reformation anterior to the trachea (T) primarily shows great vessels. C, clavicle; IJ, internal jugular vein; RSCV, right subclavian vein; LSCV, left subclavian vein; RBCV, left brachiocephalic vein; LBCV, left brachiocephalic vein; IA, innominate artery; SVC, superior vena cava; Ao, ascending aorta; AR, aortic root; PA, pulmonary artery; LAA, left atrial appendage; RA, right atrium; RV, right ventricle; LV, left ventricle. Serration of the cardiac and vascular margins is due to pulsation. C: Coronal reformation through the distal trachea (T) and carina. E, esophagus; LSCA, left subclavian artery; Ao, aorta; AzA, azygos arch; APW, aortopulmonary window; LPA, left pulmonary artery; RPA, right pulmonary artery; Ao, aortic arch; RSPV, right superior pulmonary vein; LSPV, left superior pulmonary vein; LA, left atrium; RA, right atrium; RV, right ventricle; LV, left ventricle. D: Coronal reformation through the descending aorta (Ao). E, esophagus; LSCA, left subclavian artery; LIPA, left interlobar pulmonary artery; LIPV, left inferior pulmonary vein. |
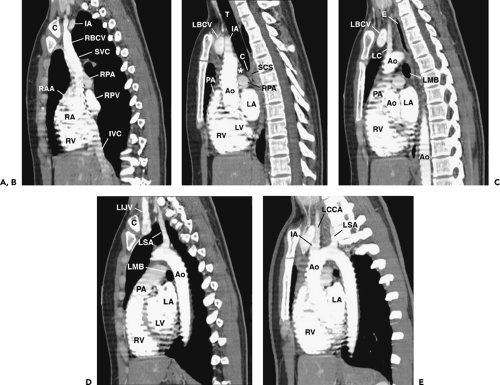 Figure 4-9 Sagittal reformations, from right to left, in the same normal subject as shown in Figures 4-5, 4-7, and 4-8. A: Reformation through the right mediastinum and superior vena cava (SVC). C, clavicle; IA, innominate artery; RBCV, right brachiocephalic vein; RPA, right pulmonary artery; RPV, right pulmonary veins; RAA, right atrial appendage; RA, right atrium; RV, right ventricle; IVC, inferior vena cava. B: Reformation through the trachea (T), slightly to the left of A. IA, innominate artery; LBCV, left brachiocephalic vein; PA, pulmonary artery; RPA, right pulmonary artery; RV, right ventricle; Ao, ascending aorta; RV, right ventricle; LV, left ventricle; LA, left atrium. Anterior mediastinal soft tissues are visible anterior to the aorta. The subcarinal space (SCC) is visible inferior to the carina (C) and the pretracheal space (*) is anterior to the distal trachea. C: Reformation to the left of B. LC, left common carotid artery; LBCV, left brachiocephalic vein; Ao, aorta; E, esophagus; LMB, left main bronchus; PA, pulmonary artery; RV, right ventricle; RV, right ventricle; LA, left atrium. D: Reformation to the left of C. C, clavicle. LIJV, left internal jugular vein; LSA, left subclavian artery; Ao, aorta; LMB, left main bronchus; PA, pulmonary artery; RV, right ventricle; LA, left atrium; LV, left ventricle. E: Oblique reformation through the aorta and its branches, 7 mm maximum intensity projection image. Ao, aorta; LSA, left subclavian artery; LCCA, left common carotid artery; IA, innominate artery; RV, right ventricle; LA, left atrium. |
Diagnosis of Mediastinal Mass
The differential diagnosis of a mediastinal mass on CT is usually based on several findings, including its location and identification of the structure from which it is arising; whether it is single, multifocal (involving several different areas or lymph node groups), or diffuse; its size and shape and its attenuation (fatty, fluid, soft tissue, or a combination of these); the presence of calcification and its character and amount; and its opacification following administration of contrast agents (8).
The mediastinum is divided anatomically into superior, anterior, middle, and posterior compartments, and
localizing a mediastinal mass to one of these divisions can facilitate their differential diagnosis on conventional radiographs (81). On CT, however, it is more appropriate to base the differential diagnosis of a mediastinal mass on a direct observation of the tissue or structure from which the mass is arising (e.g., lymph nodes, veins and arteries, thymus, thyroid, parathyroid, trachea, esophagus, vertebral column) rather than its location in the anterior, middle, or posterior mediastinum. If this is not possible, then localizing the mass to specific regions of the mediastinum (e.g., prevascular space, pretracheal space, subcarinal space, APW, anterior cardiophrenic angle, paraspinal region) can be valuable in differential diagnosis (Table 4-1). However, it is also important to keep in mind that, although many pathologic processes have a typical location or locations, most can be seen in any part of the mediastinum (82).
localizing a mediastinal mass to one of these divisions can facilitate their differential diagnosis on conventional radiographs (81). On CT, however, it is more appropriate to base the differential diagnosis of a mediastinal mass on a direct observation of the tissue or structure from which the mass is arising (e.g., lymph nodes, veins and arteries, thymus, thyroid, parathyroid, trachea, esophagus, vertebral column) rather than its location in the anterior, middle, or posterior mediastinum. If this is not possible, then localizing the mass to specific regions of the mediastinum (e.g., prevascular space, pretracheal space, subcarinal space, APW, anterior cardiophrenic angle, paraspinal region) can be valuable in differential diagnosis (Table 4-1). However, it is also important to keep in mind that, although many pathologic processes have a typical location or locations, most can be seen in any part of the mediastinum (82).
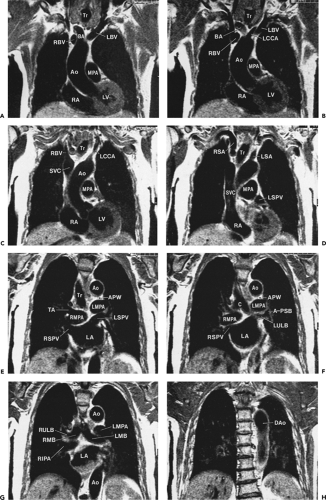 Figure 4-10 Mediastinal anatomy: coronal MR images. A–H: Sequential coronal MR images from anterior to posterior. Identification of individual structures is easiest when comparison is made to the sections immediately adjacent, limiting potential problems of interpretation caused by partial volume averaging. Note that the thyroid gland is easily identified adjacent to the trachea in A and B. Ao, aorta; RA, right atrium; LV, left ventricle; MPA, main pulmonary artery; BA, brachiocephalic artery; RBV, right brachiocephalic vein; LBV, left brachiocephalic vein; Tr, trachea; LCCA, left common carotid artery; SVC, superior vena cava; RSPV, right superior pulmonary vein; RIPA, right interlobar pulmonary artery; RSA, right subclavian artery; LSA, left subclavian artery; TA, truncus anterior; RMPA, right main pulmonary artery; LMPA, left main pulmonary artery; LSPV, left superior pulmonary vein; APW, aorticopulmonary window; RULB, right upper lobe bronchus; LMB, left mainstem bronchus; RMB, right mainstem bronchus; LA, left atrium; RMPA, right main pulmonary artery; LULB, left upper lobe bronchus; A-PSB, apical-posterior segmental bronchus; DAo, descending aorta. |
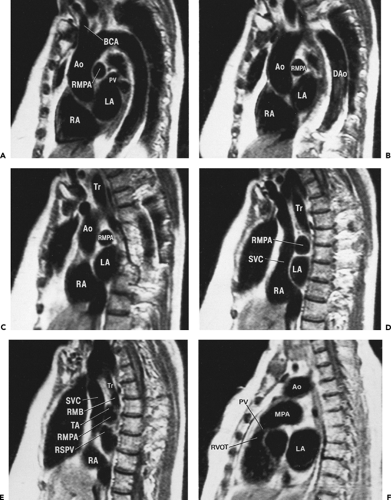 Figure 4-11 Mediastinal anatomy: parasagittal MR images. A–E: Sequential parasagittal images through the mediastinum, from the level of the aortic arch to the right hilum, respectively. Familiarity with this particular plane is especially important, as it intersects both the ascending and descending aorta, thus allowing visualization of the entire aorta in a single plane (see A). Ao, ascending aorta; BCA, brachiocephalic artery; RA, right atrium; LA, left atrium; RMPA, right main pulmonary artery; PV, left superior pulmonary vein; DAo, descending aorta; Tr, trachea; SVC, superior vena cava; RSPV, right superior pulmonary vein; TA, truncus anterior; RMB, right main-stem bronchus. F: True sagittal MR image through the main pulmonary artery (MPA). Note that in this plane, the relationship between the MPA and the right ventricular outflow tract is especially well seen. As shown in this example, occasionally a section at this level allows visualization of the pulmonic valve. |
The attenuation of mediastinal masses is also of primary importance in their differential diagnosis (83,84,85,86). Masses can be categorized as (a) fat attenuation; (b) low attenuation, having density greater than that of fat, but less than that of muscle; (c) high attenuation, with a density greater than that of muscle; and (d) enhancing, showing a significant increase in attenuation following the injection of contrast.
Fat attenuation masses, composed primarily of or partially containing fat or lipid-rich tissues, include lipomatosis and fat pads; thymolipoma; teratoma; lymphangioma and hemangioma; lipoma, liposarcoma, and other tumors derived from fat; fatty hernias; and, rarely, lymph node enlargement in Whipple disease or extramedullary hematopoiesis (Table 4-2) (85,87,88,89,90,91).
Low-attenuation masses are usually cystic or fluid filled or contain some lipid (Table 4-3). These include a variety of congenital or acquired cysts (bronchogenic, esophageal duplication, neurenteric, pericardial, and thymic); necrotic neoplasms, including lymphoma, cystic thymoma, germ-cell tumors, and lymph node metastases; lymphangioma and hemangioma; neurogenic tumors; thoracic meningocele; fluid collections such as mediastinal abscess, mediastinitis, hematoma, seroma, or pseudocyst; cystic goiter; a dilated, fluid-filled esophagus; and fluid localized in the superior pericardial recess (32,84,92,93,94).
High-attenuation masses generally contain calcium, have high iodine content, or are related to the presence of fresh blood (Table 4-4). They include calcified lymph nodes secondary to granulomatous infection, sarcoidosis, inhalational diseases such as silicosis, and Pneumocystis carinii (now called Pneumocystis jiroveci) infection; lymph node calcification caused by metastatic tumor such as adenocarcinoma or sarcoma; lymphoma with calcification usually after treatment; partially calcified primary neoplasms including germ-cell tumors, thymoma, and neurogenic tumors; calcified goiter; calcified vascular lesions; calcium within a cyst; goiter with high iodine content; and mediastinal hematoma (83).
Enhancing masses are highly vascular (Table 4-5) (95) and include substernal thyroid and parathyroid glands (96,97); carcinoid tumors; lymphangiomas and hemangiomas that may contain vascular elements (98,99); paraganglioma (100,101); Castleman disease (35,102); and a variety of partially necrotic, inflammatory, and neoplastic lesions in which some rim enhancement is visible (32,33).
Masses Primarily Involving the Prevascular Space
Mediastinal masses result in alterations of normal mediastinal contours and displacement or compression of mediastinal structures; recognizing these findings can be valuable in diagnosis and in suggesting the site of origin of the mass.
Table 4-1 Differential Diagnosis of Mediastinal Masses Based on Common Sites of Origin | ||
|---|---|---|
|
Table 4-2 Fat-Containing Masses: Differential Diagnosis | |
|---|---|
|
Masses in the prevascular space, when large, tend to displace the aorta and great arterial branches posteriorly, but distinct compression or narrowing of these relatively thick walled structures is unusual. Within the supra-aortic mediastinum, displacement, compression, or obstruction of the brachiocephalic veins is common. Posterior displacement or compression of the superior vena cava is typical only with large or right-sided masses. On the left, compression of the main pulmonary artery can be seen. Recognizing abnormalities of mediastinal contours is not particularly helpful in diagnosing masses in this region. The anterior junction line is rather variable in thickness and cannot be relied on as being abnormal unless grossly thickened. The mediastinal pleural reflections bordering the prevascular space are often convex laterally, although a marked convexity may suggest a mass. The differential diagnosis of masses arising in this area include thymoma and other thymic tumors, cysts, lymphoma and other lymph node masses, germinal-cell tumors, thyroid masses, parathyroid masses, fatty masses, and lymphangioma (hygroma) (81,93,103,104).
Table 4-3 Low-Attenuation Masses: Differential Diagnosis | |
|---|---|
|
Table 4-4 High-Attenuation Masses: Differential Diagnosis | |
|---|---|
|
CT is advantageous in the diagnosis of masses in the prevascular mediastinum (92,105). In a study of 128 patients, the correct first choice diagnosis was made in 48% of cases, based on CT, although this was possible in only 36% of cases based on plain radiographs (105). Those masses most accurately diagnosed were cystic in nature, contained* fat, or had characteristic enhancement patterns, including benign germ-cell tumors, thymolipoma, omental hernia, and tuberculous lymphadenopathy.
Normal Thymus
The thymus has two lobes that are fused superiorly near the thyroid gland and smoothly molded to the anterior aspect of the great vessels at lower levels. It occupies the thyropericardic space of the anterior mediastinum and extends inferiorly to the base of the heart. The thymus is very rarely found in an ectopic location, usually the neck (106).
Table 4-5 Enhancing Masses: Differential Diagnosis | |
|---|---|
|
The thymus weighs an average of 22±13 g at birth and increases in size progressively to reach a maximum weight at puberty of approximately 34 g (107). Beginning at puberty, the thymus begins to involute, and this process continues for a period of 5 to 15 years. During thymic involution, atrophied thymic follicles are progressively replaced by fat, and the relative proportion of fat to thymic tissue increases progressively, until after age 60. At this age, remaining thymic tissue is negligible (108,109). For example, in an autopsy series of 20 patients older than 60 years, no thymus could be recognized with gross examination and only 11 had any thymic tissue visible histologically (108).
CT allows imaging of the thymus with much greater clarity than is possible using plain radiographs. The CT appearance of the normal thymus has been well described in both adults and children (39,53,55,56,57). In interpreting CT, one must be aware of the significant changes that occur in thymic morphology with age and the significant variation in the normal size and weight of the thymus seen in younger individuals, particularly those younger than the age of 25 years.
Appearance of the Thymus in Children
In children, the normal thymus occupies the retrosternal space, draping itself over the great vessels and cardiac margins (56). Its left lobe usually extends laterally, adjacent to the arch of the aorta, and posteriorly to the level of the descending aorta, but distinct lobes are not generally seen (110). Cephalad, the thymus extends an average of 1.7 cm superior to the innominate vein and can be seen as high as the thyroid gland, where it may simulate lymph node enlargement (111). Its inferior extent is variable. In infancy, it is commonly seen at the level of the pulmonary arteries or below, but its inferior extent decreases with age.
In infants and younger children, the thymus appears quadrilateral in shape in the axial plane but assumes a more triangular shape as the child grows (Figs. 4-12, 4-13 and 4-14). Its margins are sharp, smooth, and convex in infants and often become straight in older children (Fig. 4-14) (53,56,112). On CT, the thymus is of soft tissue attenuation, slightly denser than vessels but approximately the same attenuation as muscle. The mean attenuation of the thymus has been found to be 36 Hounsfield units (HU) (112). It is often possible to distinguish between thymus and vessels even without contrast enhancement, but contrast is required to optimally delineate the thymus, which shows homogeneous enhancement of 20 to 30 HU after bolus contrast injection.
MRI clearly distinguishes the thymus from mediastinal vascular structures (Figs. 4-12C–E and 4-13) (54,58). On T1-weighted images, the signal intensity of the thymus is slightly greater than that of muscle; on T2-weighted images, the thymus increases in intensity relative to fat but usually remains of intermediate intensity. In some patients, thymus may appear similar in intensity to fat. Homogeneous enhancement occurs after administration of gadolinium.
Thymic size can be quantitated using its length (measured in the cephalocaudal
dimension), width (measured in the transverse dimension), and thickness (measured perpendicular to its length and anteroposterior dimension) (Figs. 4-14 and 4-15). Although thymic size increases with age in young subjects, its width shows little change. On CT, the average thickness of the thymus decreases with age, from an average of 1.4 cm in children aged 5 years or less, to an average of 1.0 cm in children aged 10 to 19 years (39).
dimension), width (measured in the transverse dimension), and thickness (measured perpendicular to its length and anteroposterior dimension) (Figs. 4-14 and 4-15). Although thymic size increases with age in young subjects, its width shows little change. On CT, the average thickness of the thymus decreases with age, from an average of 1.4 cm in children aged 5 years or less, to an average of 1.0 cm in children aged 10 to 19 years (39).
In children, CT (39,56) and MRI (54,58) provide somewhat different normal values for thymic size, a finding that likely reflects the fact that MRI scans are obtained during quiet breathing, whereas CT, especially in older children, is commonly performed at full inspiration (54). As compared to CT, MRI in children usually shows a slightly greater thymic width but a marked decrease in the ratio of the size of the thymus relative to both the transverse and cephalocaudal dimensions of the thorax. On MRI, the thymus appears to have a slightly greater thickness than noted on CT, with an average thickness of 1.8 cm for the right lobe and 2.1 cm for the left lobe. Occasionally the signal intensity characteristics of normal thymic tissue may be of value in identifying unusual configurations of the thymus, especially in children in whom posterior mediastinal extension between the superior vena cava and trachea is not uncommon (113).
Appearance of the Thymus in Adults
From puberty to the age of about 25 years, the thymus is recognizable as a distinct triangular or bilobed structure, usually outlined by mediastinal fat (Fig. 4-14). Typically its borders are flat or concave laterally, but on occasion the thymus may show convex margins, a finding more typical in children (Fig. 4-12). Its CT attenuation usually decreases to less than that of muscle because of fatty replacement. In persons older than the age of 25 years, the thymus is no longer recognizable as a soft tissue structure, because of progressive fatty involution. Islands or strands of soft tissue density within a background of more abundant fat are typically noted on CT (Fig. 4-16). The rapidity and degree of thymic involution are variable in different subjects, and occasionally the thymus may still be recognized as a discrete structure up to the age of 40. With complete thymic involution, the anterior mediastinum appears to be entirely filled with fat. It should be realized, however, that most of the anterior mediastinal fat is contained within the fibrous skeleton of the thymus and may have a CT density slightly higher than that of subcutaneous fat.
Normal measurements for the thymus as shown on CT in adults have been reported (Fig. 4-15) (53,55). Although values for the length (measured in the cephalocaudal dimension) and width (measured in the transverse dimension) of the thymus have been defined, the most helpful value for thymic size is “thickness,” measured perpendicular to the length. In subjects younger than the age 20 years, a thickness of 1.8 cm is considered the maximum allowable normal value, with 1.3 cm being the maximum normal value in older subjects. The accuracy of these dimensions has been confirmed by Francis et al. (55) and Nicolaou et al. (114). Francis showed that, although thymic thickness is a sensitive indicator of thymic abnormality, thymic shape was just as reliable in separating normal from abnormal thymus, especially when the thymus was multilobulated (55). In fact, qualitative assessment of thymic shape alone should prove sufficient for diagnosing mass lesions of the thymus. Nicolaou et al. found a sensitivity of 100% for diagnosing thymic hyperplasia
or thymoma based on a thymic thickness of greater than 1.3 cm or a focal soft tissue density greater than 7 mm (114).
or thymoma based on a thymic thickness of greater than 1.3 cm or a focal soft tissue density greater than 7 mm (114).
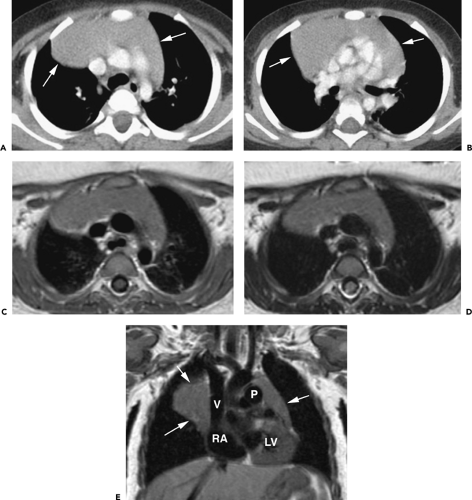 Figure 4-12 Normal thymus in a 12-month-old boy. A: Enhanced CT at the level of the carina. The thymus (arrows) is large and has convex margins. It typically assumes a more triangular shape in older children. Its attenuation is similar to that of muscle. As is typical in young children, the thymus occupies the retrosternal space, draping itself over the great vessels and cardiac margins. Its left lobe usually extends laterally, adjacent to the arch of the aorta, and posteriorly to the level of the descending aorta. Distinct lobes are not generally seen at this age. B: CT at a lower level, the thymus (arrows) extends posteriorly to the hila. C: T1-weighted MRI obtained at the same level as A following administration of gadolinium shows the thymus to be slightly more intense than muscle. Enhancement is homogeneous. D: T2-weighted image at the same level as C. The thymus remains of intermediate intensity. E: T1-weighted coronal image shows the inferior extent of the thymus (arrows) adjacent to the superior vena cava (V) and right atrium (RA) on the right, and the pulmonary artery (P), left atrial appendage, and left ventricle (LV) on the left. |
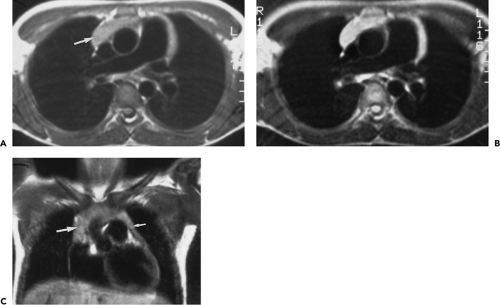 Figure 4-13 Normal thymus in a 12-year-old boy. A: T1-weighted transaxial image (TR/TE = 750/20 msec) of the mediastinum shows the homogeneous intensity thymus (arrow) anterior to the great vessels. The right mediastinal pleura is convex laterally. In this patient, the right thymic lobe predominates. B: T2-weighted transaxial image (TR/TE = 2,250/70 msec) shows an increase in intensity of the thymus, as compared with mediastinal fat. C: T1-weighted transaxial image (TR/TE = 750/20 msec) in the coronal plane shows the thymus occupying most of the superior mediastinum, extending inferiorly to the level of the right atrium. The right thymic lobe is larger (large arrow), but the left thymic lobe (small arrow) is also visible. |
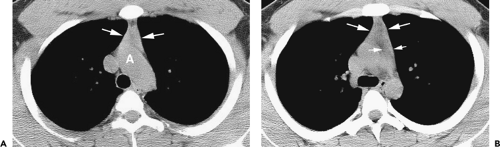 Figure 4-14 Normal thymus in a teenager. A: Unenhanced CT at the level of the aortic arch (A) shows a triangular thymus (arrows) of soft tissue attenuation. The thymic margins are straight rather than convex (see Fig. 4-12). B: At the level of the aortopulmonary window, the thymus (large arrows) also appears triangular, with slight convexity of its left lobe. The small arrows indicate the thickness of the left thymic lobe (see Fig. 4-15). |
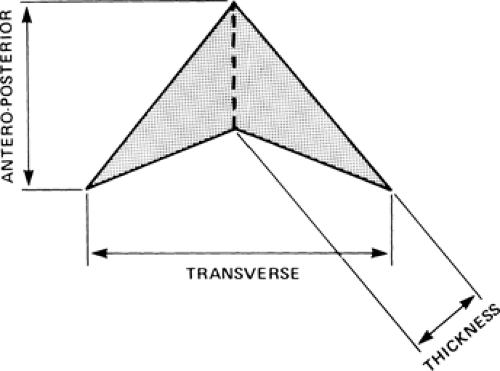 Figure 4-15 Normal thymus, assessment of size. The thymus is measured using its thickness, its width (transverse dimension), and its anteroposterior dimension. Its cephalocaudal extent is termed length. (From Frances IR, Glazer GM, Shapiro B, et al. Complementary roles of CT and 131-I-MIBG scintigraphy in diagnosing pheochromocytoma. AJR Am J Roentgenol. 1983; 141:719–725 , with permission.) |
On MRI, the normal thymus (54,58,115) characteristically appears homogeneous and of intermediate signal intensity on T1-weighted images, being less intense than surrounding mediastinal fat but greater intensity than muscle (Figs. 4-12C–E and 4-13). However, because of progressive thymic involution, its appearance is dependent on the age of the patient. In patients older than 30 years, differentiation between the thymus and adjacent mediastinal fat may be difficult because of thymic involution and replacement by fat. The T2 relaxation times of the thymus are similar to those of fat at all ages (Fig. 4-17), making visualization of the thymus more difficult than on T1-weighted images (54,115). On MRI, thymic thickness can appear considerably greater than that seen on CT, with a mean value of up to 20 mm (54).
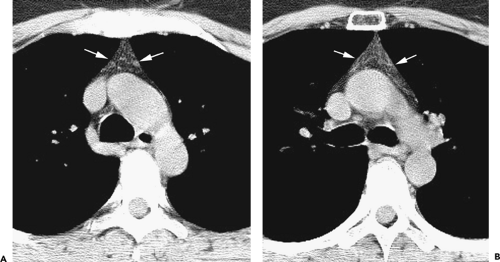 Figure 4-16 Normal thymus in a 51-year-old woman. A: Unenhanced CT at the level of the aortic arch shows a triangular thymus (arrows), which is largely of fat attenuation, but contains small islands or strands of soft tissue. The thymic margins are slightly concave. B: At the level of the aortopulmonary window and pulmonary artery, the thymus (arrows) is largely of fat attenuation, with strands of residual thymic tissue within it. |
Positron emission tomography using fluorine-18 fluorodeoxyglucose (FDG-PET) may show uptake by normal thymus (116,117). In young adults, the normal thymus may appear metabolically active on FDG-PET, and its degree of activity correlates with its CT attenuation (118). In a study by Nakahara et al. (118), 32 (34%) of 94 normal young adults (mean age 25.4 years, range 18 to 29 years) showed thymic uptake of FDG. In these 32 cases, the count ratio between the thymus and the lung (T/L ratio) was 2.86 ± 0.49 (range 2.02 to 3.99). The CT attenuation of the thymus averaged 217.5±45.7 HU (range 2103.6 HU to 79.9 HU) correlated with the T/L ratio (r = 0.58). Also, CT thymic attenuation values in subjects with positive PET findings were significantly higher than CT values in subjects with negative PET findings (p < .001).
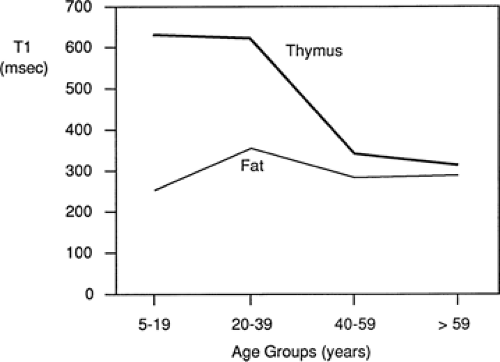 Figure 4-17 Relative T1 values of thymus and fat in different age groups. The T1 of thymus decreases in older patients because of fatty replacement. The T1 of fat remains constant relative to age. |
Thymic Enlargement and Masses
The left thymic lobe is normally larger than the right and the thymus is almost always slightly asymmetric. However, if enlargement of the thymus is grossly asymmetric or if the thymus has a lobular contour, a thymic mass should be suspected. Using these criteria, CT has proven extremely accurate in diagnosing thymoma and other thymic neoplasms (Table 4-6). In a study reported by Chen et al. (119), CT proved 91% sensitive and 97% specific in establishing the presence of a mass within the thymus. Of 34 patients with a CT diagnosis of a mass or neoplasm, all but one proved surgically to have a thymoma (n = 31), thymic cyst (n = 1), or Hodgkin lymphoma (HL) (n = 1). Similar results have been reported by others (120). It must be kept in mind, however, that thymic hyperplasia can also result in a focal thymic mass, up to 5 cm in diameter (114). The role of MRI in diagnosing thymic masses is more limited (92). One important exception is in the diagnosis of vascular invasion, especially in patients for whom intravenous contrast cannot be administered (121). In these cases, MRI exquisitely delineates the extent of vascular involvement, including identification of intracardiac disease extension.
Table 4-6 Differentiation of Thymic Tumor from Normal Thymus: Computed Tomography Criteria | |
|---|---|
|
Thymic masses and tumors include thymic hyperplasia, thymoma, thymic carcinoma, thymic neuroendocrine (carcinoid) tumor, thymic cyst, thymolipoma, and lymphoma (Table 4-7) (93,122). Overall, thymic tumors account for approximately 20% of primary mediastinal tumors (104,123,124,125).
FDG-PET has emerged as an important diagnostic tool for the diagnosis and staging of thymic masses, but normal thymic uptake of FDG complicates the assessment of thymic lesions in children and young adults (117). Increased thymic FDG uptake may be physiologic or may be seen in the presence of thymic hyperplasia, lymphomatous infiltration, primary thymic neoplasm, or metastatic tumor. In equivocal cases, correlation with morphologic data from CT or MRI is important in diagnosis (117).
Thymic Enlargement
The thymus can weigh as much as 45 to 50 g in normal individuals, and it is difficult to diagnose mild degrees of thymic enlargement. However, when the thymus appears as a mediastinal mass readily detectable on plain chest radiographs in older children or young adults, it should be considered enlarged.
“Thymic enlargement” should be taken to mean that the thymus is increased in size but maintains a normal shape and appearance. This occurrence may be described using the term “hyperplasia,” but it is best to reserve this
term for follicular thymic hyperplasia (FTH), described later. There is overlap between thymic enlargement and FTH, and for practical purposes this distinction is often arbitrary.
term for follicular thymic hyperplasia (FTH), described later. There is overlap between thymic enlargement and FTH, and for practical purposes this distinction is often arbitrary.
Table 4-7 Thymic Masses: Differential Diagnosis | ||
|---|---|---|
|
Thymic Hyperplasia
Thymic germinal or lymphoid follicular hyperplasia (LFH) is a term used by pathologists to describe the presence of hyperplastic lymphoid germinal centers in the thymic medulla, associated with a lymphocytic and plasma cell infiltrate (107). The presence of LFH is commonly associated with myasthenia gravis, although lymphoid follicles can also be present in the medulla of the normal thymus, particularly in young subjects.
On CT, 30% to 50% of patients with LFH can have a normal-appearing thymus. In many of the remaining patients, the thymus appears abnormally enlarged but generally has a normal shape (Fig. 4-18). In some patients with LFH, the thymus appears nodular, masslike (Fig. 4-19), or inhomogeneous in attenuation. In a study of 22 patients with myasthenia gravis and LFH (114), 10 (45%) had a normal-appearing thymus on CT, 7 (32%) had an enlarged thymus, and 5 (23%) had a focal thymic mass. Focal thymic masses ranged from 1.7 to 5 cm in diameter.
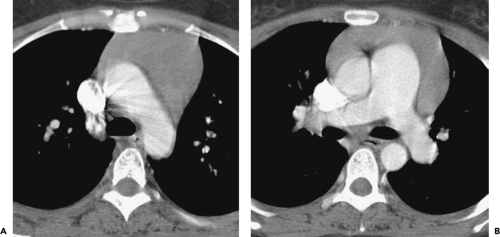 Figure 4-18 Thymic enlargement and hyperplasia in hyperthyroidism. A, B: Enhanced CT at two levels in a 29-year-old woman shows marked thymic enlargement, without evidence of a focal mass. Thyroid enlargement was also visible. Biopsy confirmed the diagnosis of thymic hyperplasia. |
Thymic enlargement associated with LFH may be seen in patients with human immunodeficiency virus (HIV) infection (129). LFH and multiloculated thymic cysts have been reported in children with HIV infection (130,131). In one study (130), eight HIV-infected children, 2.1 to 12.1 years of age, had an anterior mediastinal mass discovered incidentally on chest radiography; these children had CD41 cell counts between 102 and 733 cells/mm3. In all eight cases, CT revealed thymic enlargement with a multicystic appearance. Histologic examination demonstrated cystic changes, LFH, diffuse plasmacytosis, and multinucleated giant cells. Follow-up showed a decrease in size of the mass or resolution in five of the eight.
Although thymic enlargement can be identified on CT in some patients with LFH, the usefulness of CT in detecting this abnormality is limited (114,119,132). In one large study correlating CT with pathologic findings, the thymus typically appeared larger in patients with LFH than in age-matched controls. However, based on diffuse enlargement of the thymus, CT proved only 71% sensitive for diagnosing lymphoid hyperplasia (119). In the study by Nicolaou et al. (114), only 55% of patients with LFH showed an abnormal thymus on CT. Furthermore, Castleman and Norris (133) have shown that, in patients with myasthenia gravis, the weight of thymus glands showing LFH does not differ significantly from that of normal controls. Up to 50% of the thymus glands called normal on CT may prove to contain LFH after surgical removal (134).
On MRI, thymic hyperplasia is associated with thymic enlargement, but the signal intensity is the same as for normal thymus (115).
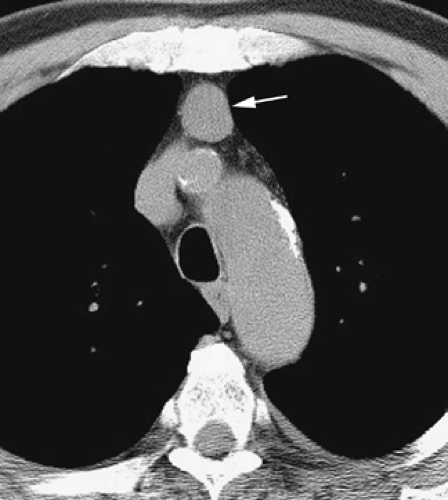 Figure 4-19 Thymic mass in thymic hyperplasia. A sharply marginated nodule (arrow) is visible within a thymus that is largely replaced by fat in a 68-year-old woman. This represented thymic hyperplasia. It is indistinguishable from thymoma. |
Thymic Rebound
The thymus involutes during periods of stress, sustaining a decrease in volume that variably depends on the age of the patient and the severity and duration of the stress. This phenomenon is most marked in children, but it has also been observed in young adults. Following involution, the thymus will generally reacquire its premorbid size within several months of the stressful episode. It may also exhibit “rebound,” or growth to a size significantly larger than its original size (Figs. 4-20 and 4-21). For example, Gelfand et al. (128) found enlargement of the thymus, as determined using plain chest radiographs, in five children aged 5 to 12 who were recovering from burns. Also, largely using chest radiographs, Cohen et al. (135) illustrated rebound thymic growth in seven children aged 3 to 11 who had received chemotherapy for 5 months to 3 years for Wilms tumor, malignant lymphoma, osteosarcoma, malignant teratoma, or acute lymphatic leukemia. In three cases, a prominent thymus was observed during the course of chemotherapy; in the remaining four patients the changes were detected 1 to 9 months after cessation of therapy.
Because CT is more sensitive than are plain chest radiographs for detecting thymic enlargement, thymic rebound is detected with greater frequency when patients are monitored with CT. Using CT, Choyke et al. (136) made serial observations of the mediastinum in a group of patients aged 2 to 35, who were receiving chemotherapy for various malignancies, including HL (n = 6), osteosarcoma (n = 5), testicular neoplasms (n = 4), Wilms tumor (n = 3), and rhabdomyosarcoma (n = 2). In this study (136), thymic volume decreased an average of 43% in response to chemotherapy. On follow-up studies, however, the thymus recovered its pretreatment volume in most cases and, in 25% of patients, thymic rebound occurred, with the volume of the thymus exceeding the baseline volume by 50%. Thymic rebound as visualized by CT has also been reported after treatment of Cushing syndrome (137).
In most patients with extrathoracic malignancies, thymic rebound is unlikely to cause concern or diagnostic confusion. As a practical matter, thymic rebound is most problematic when it is observed in patients with malignant lymphoma who have been treated using chemotherapy. When an enlarged thymus is seen in such patients, it can be difficult to distinguish thymic rebound from recurrent lymphoma. In our experience, however, when a patient with lymphoma shows thymic enlargement as an isolated finding after treatment (Fig. 4-20), with no adenopathy being visible, it is reasonable to follow the patient with the presumption that thymic rebound is responsible.
In a study by Kissin et al. (138) of adults receiving chemotherapy, there was a suggestion that thymic rebound may be a favorable prognostic factor, in that 13 of 14 patients with thymic enlargement after chemotherapy were free of disease after a mean follow-up of 45 months (138). On the other hand, thymic hyperplasia, manifested on CT by an increase in thymic size or attenuation, has been reported after high-dose chemotherapy and autologous stem cell transplantation in patients with breast cancer but is uncommon and does not appear to correlate with survival (139).
On MRI, patients with thymic rebound may show enlargement of the thymus, but its signal intensity is the same as for normal thymus (115).
Thymoma and Thymic Epithelial Tumors
The most common primary thymic tumor is thymoma (140). It accounts for about 15% of primary mediastinal masses (140). Thymomas are derived from thymic epithelium, as are thymic carcinomas (141). Thymoma is rare before age 20 and is most common in patients aged 50 to 60 years. From 30% to 54% of patients with a thymoma develop myasthenia gravis. Other syndromes associated with thymoma include red cell aplasia and hypogammaglobulinemia.
A number of systems have been used to classify thymoma and thymic epithelial tumors (141,142,143). Many of these have fallen from favor because of their inability to predict tumor behavior or prognosis.
The simplest classification of thymic epithelial tumors considers three groups, based on a combination of histologic features and behavior: noninvasive thymoma, invasive thymoma, and thymic carcinoma. These three types, respectively, have also been termed benign thymoma (being noninvasive and having benign histologic features), type 1 malignant thymoma (characterized by invasion but having benign histologic features), and type 2 malignant thymoma (appearing malignant histologically) (143).
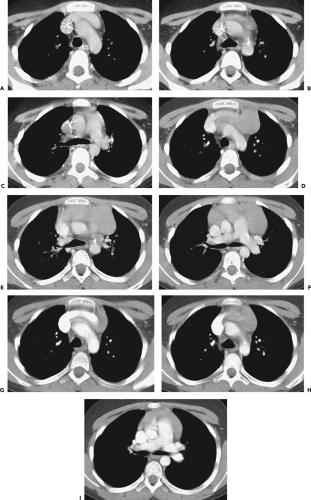 Figure 4-20 Thymic rebound in a 9-year-old following chemotherapy for non-Hodgkin lymphoma. A–C: CT at three levels following the completion of chemotherapy. The thymus is small and difficult to see. D–F: CT 4 months later at the same levels shown in A to C. The thymus has increased markedly in size due to thymic rebound. G–I: CT 1 year after scans D to F. No further chemotherapy has been used. The thymus has decreased in size and appears normal for a patient of this age. |
Suster and Moran (144) described a classification of thymic epithelial tumors based on histology and the degree of cellular atypia, similar to that described previously. It permits the classification of thymic epithelial tumors into three simple diagnostic categories: thymoma, atypical thymoma, and thymic carcinoma (144). Atypical thymoma is characterized histologically by features of low-grade malignancy, including cellular atypia, large cell size, occasional mitotic figures, and aggressive behavior, but maintains some normal features of thymic morphology and lacks the obvious malignant appearance of thymic carcinoma. Atypical thymoma is associated with local invasion (143).
Müller-Hermelink extended the histologic description of thymic epithelial tumors to emphasize their morphologic features as cortical, medullary, or mixed, based on their resemblance to cortical or medullary regions of the thymus (145,146,147). Cortical thymomas, as classified by Müller-Hermelink, tend to behave more aggressively than
medullary or mixed tumors. The Müller-Hermelink histologic classification has been shown to correlate with tumor stage and survival (146).
medullary or mixed tumors. The Müller-Hermelink histologic classification has been shown to correlate with tumor stage and survival (146).
Recently, the World Health Organization (WHO) has proposed a histologic classification of thymomas based on the Müller-Hermelink system but using alpha-numeric designations to describe the various tumor types (Table 4-8). The WHO classification system is in wide use and has been adopted by most investigators. In the WHO system, thymomas are divided into two groups (type A and B) depending on whether the neoplastic epithelial cells and their nuclei are spindle or oval shaped (type A) or have a dendritic or epithelioid appearance (type B); type AB tumors have mixed features. Type B tumors are further divided into three subtypes (B1 to B3) according to the proportional increase in their epithelial component and the presence of atypical cells. All types of thymic carcinoma are classified as type C. The relationship between the WHO classification and the Suster and Moran and Müller-Hermelink classification systems is summarized in Table 4-9 (145,146,147).
This WHO classification of thymic epithelial tumors has been shown to correlate significantly with tumor stage and prognosis (148,149,150,151). Types A, AB, and B1 thymoma are less likely to be invasive or recur after surgery and are associated with a greater likelihood of complete resection and have a better survival than types B2 and B3. For example, in a study of 273 patients with thymoma (149) classified using the WHO system, there was a significant relationship between the tumor type, the frequency of invasion, and patient survival. In patients with type A, AB, B1, B2, and B3 tumors, the respective proportions of invasive tumors were 11.1%, 41.6%, 47.3%, 69.1%, and 84.6%; the respective proportions of tumors with involvement of the great vessels were 0%, 3.9%, 7.3%, 17.5%, and 19.2%; and the respective 20-year survival rates were 100%, 87%, 91%, 59%, and 36%.
Thymomas are staged at the time of surgery, based on the presence and extent of invasion (146,150,152). The presence or absence of growth through the tumor capsule and the extent of local invasion are fundamental in determining the stage and resultant prognosis.
Overall, approximately 30% of all thymomas are invasive, although this varies with the histologic classification of the tumor. Characteristically, invasive thymomas infiltrate adjacent structures or result in pleural or pericardial implants; thymoma rarely metastasizes outside the thorax. Typically, thymomas (a) invade mediastinal fat or local mediastinal structures, including the superior vena cava, great vessels, and even the airways; (b) invade the adjacent
lungs or chest wall; or (c) spread by contiguity along pleural reflections, usually on one side of the chest cavity, and may seed the diaphragmatic surfaces with consequent direct extension into the abdomen (Fig. 4-22) (141,142,153,154,155,156,157). In one study (158), invasion of mediastinal structures was present in 10 of 27 (37%) patients with invasive thymoma, including 5 cases (19%) with invasion of the pericardium, 1 with vascular invasion, and 4 (15%) with both pericardial and vascular invasion. Invasion of the pleura was found in 24 of 27 (89%) cases of invasive thymoma, invasion of adjacent lung was present in 9 of 27 (33%) cases, and invasion of adjacent chest wall was present in 2 of 27 (8%) cases.
lungs or chest wall; or (c) spread by contiguity along pleural reflections, usually on one side of the chest cavity, and may seed the diaphragmatic surfaces with consequent direct extension into the abdomen (Fig. 4-22) (141,142,153,154,155,156,157). In one study (158), invasion of mediastinal structures was present in 10 of 27 (37%) patients with invasive thymoma, including 5 cases (19%) with invasion of the pericardium, 1 with vascular invasion, and 4 (15%) with both pericardial and vascular invasion. Invasion of the pleura was found in 24 of 27 (89%) cases of invasive thymoma, invasion of adjacent lung was present in 9 of 27 (33%) cases, and invasion of adjacent chest wall was present in 2 of 27 (8%) cases.
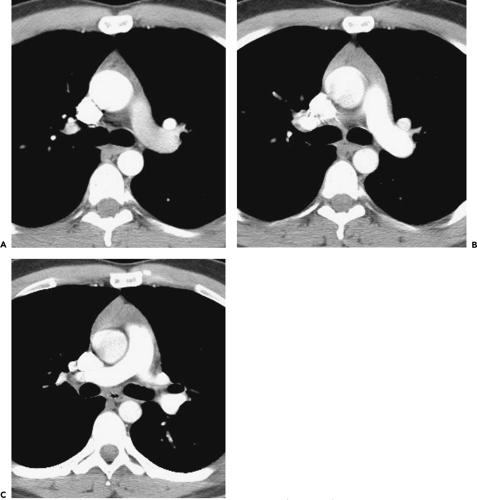 Figure 4-21 Thymic rebound in a 30-year-old with colon cancer. A: CT following chemotherapy, at the level of the left pulmonary artery, shows a normal-appearing thymus with some fatty replacement. B: Five months later, following completion of treatment, CT at the same level shows a significant increase in thymic size and an increase in its attenuation. The thymic margins are more convex than on the prior study. C: CT at the same time as B, at a lower level, shows a prominent thymus. |
The thymoma staging system proposed by Masaoka (152) is in general use. The principal features of the Masaoka staging system are as follows:
Stage I: the tumor capsule is intact.
Stage II: invasion of the tumor capsule or surrounding fat or mediastinal pleura.
Stage III: invasion of surrounding organs (pericardium, great vessels, or lung).
Stage IVa: pleural or pericardial implants.
Stage IVb: hematogenous or lymphogenous metastases.
Table 4-8 World Health Organization Classification of Thymic Epithelieal Tumors | ||||||||||||||
|---|---|---|---|---|---|---|---|---|---|---|---|---|---|---|
|
There is a relationship between WHO tumor type and stage at diagnosis. WHO tumor types A, AB, and B1 are less likely to be invasive (i.e., stages II to IV) than types B2 and B3. Recent studies (146,149,150,151) have shown that, even though the tumor stage and WHO classification are related, they are both important and independent factors in determining patient survival (Table 4-10). In a recent study (149), the 20-year survival rates for thymoma were 89%, 91%, 49%, 0%, and 0%, respectively, in patients with Masaoka Stage I, II, III, IVa, and IVb disease.
Resection is indicated in all stages, with supplemental radiotherapy in patients with invasion through the tumor capsule or incomplete resection. For bulky or unresectable tumors, preoperative chemotherapy and postoperative radiotherapy may be used. Radiotherapy and chemotherapy may be used in patients with incomplete resection or distant metastases (159,160,161,162,163,164).
Computed Tomography Findings of Thymoma
The CT appearance of thymomas has been well described (55,114,119,120,143,158,165,166,167,168,169,170,171,172). Approximately 80% of thymomas occur at the base of the heart (140). Small thymomas are often subtle or invisible on chest radiographs (173).
On CT, thymomas appear as homogeneous soft tissue attenuation masses, which are usually sharply demarcated and oval, round, or lobulated and do not conform to the normal shape of the thymus (Figs. 4-23, 4-24 and 4-25) (140). Most often the tumor grows asymmetrically to one side of the anterior mediastinum and prevascular space (Figs. 4-23, 4-24 and 4-25). Because ectopic thymic tissue in the neck is found in up to 21% of normal subjects, thymoma can
occur in the neck or at the thoracic inlet, thus mimicking a thyroid mass (Fig. 4-26) (174). Rarely, thymomas may appear cystic, with discrete nodular components or in association with a thick cyst wall or discrete mass (Figs. 4-27 and 4-28). Except in patients with cystic masses, tumors usually enhance homogeneously after contrast medium injection. Focal calcifications are seen in 10% to 40% (Figs. 4-27 and 4-29).
occur in the neck or at the thoracic inlet, thus mimicking a thyroid mass (Fig. 4-26) (174). Rarely, thymomas may appear cystic, with discrete nodular components or in association with a thick cyst wall or discrete mass (Figs. 4-27 and 4-28). Except in patients with cystic masses, tumors usually enhance homogeneously after contrast medium injection. Focal calcifications are seen in 10% to 40% (Figs. 4-27 and 4-29).
Table 4-9 Relationships Among Histologic Classifications of Thymic Epithelial Tumors | ||||||||||||||||||||||||
|---|---|---|---|---|---|---|---|---|---|---|---|---|---|---|---|---|---|---|---|---|---|---|---|---|
| ||||||||||||||||||||||||
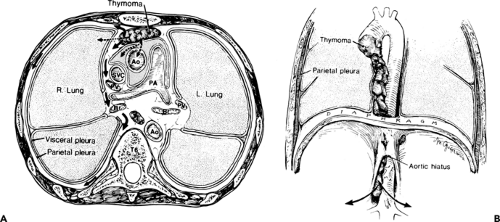 Figure 4-22 Invasive thymoma: pattern of spread. A, B: The pattern of spread of invasive thymomas is graphically represented. In cross-section, the tumor can directly invade surrounding structures (broken arrows) or insinuate itself between the chest wall or mediastinum and the parietal pleura (solid arrows). Once the para-aortic—paraspinal area is reached, inferior extension through the aortic or esophageal hiatus can occur. With CT, such extension can be seen reliably and the study should always be extended to the upper abdomen. Ao, aorta; PA, pulmonary artery; PV, pulmonary vein; Br, bronchus; E, esophagus; SVC, superior vena cava. (From Zerhouni EA, Scott WW, Baker RR, et al. Invasive thymomas: diagnosis and evaluation by computed tomography. J Comput Assist Tomogr. 1982;6:92–100 , with permission.) |
In a patient with thymoma, CT findings that may indicate invasion include, in order of increasing sensitivity and decreasing specificity, (a) invasion of mediastinal structures, (b) infiltration of mediastinal fat, (c) poor definition of the tumor margin, (d) distortion or compression of mediastinal structures, (e) obliteration of fat planes between the tumor and mediastinal structures, and (f) extensive contact between the tumor and mediastinal structures.
The presence of ipsilateral pleural effusion or pleural nodules or masses may also be used to predict invasion (Fig. 4-29). Pleural nodules, when present, are often unilateral and, unlike other tumors resulting in pleural metastases, may be unassociated with pleural effusion. Thus, CT can show focal, well-defined pleural masses, unobscured by pleural fluid.
As a general rule, caution should be used when diagnosing invasion based on CT findings. In one study (158), a correct first choice diagnosis of invasive or noninvasive thymoma was made in only 38 of 50 (76%) cases. These included 21 of 27 (78%) cases of invasive thymoma and 17 of 23 (74%) cases of noninvasive thymoma.
The absence of fat planes between the thymoma and mediastinal structures or direct contact between the tumor and adjacent structures is often used to predict invasion
but are not reliable criteria. In a study by Tomiyama et al. (158), the CT appearance of partial or complete obliteration of fat planes adjacent to the tumor was not helpful in the diagnosis of invasion. Although infiltration of mediastinal structures was suggested on CT in all patients with surgically proven mediastinal infiltration, it was also thought to be present in many patients with noninvasive thymoma.
but are not reliable criteria. In a study by Tomiyama et al. (158), the CT appearance of partial or complete obliteration of fat planes adjacent to the tumor was not helpful in the diagnosis of invasion. Although infiltration of mediastinal structures was suggested on CT in all patients with surgically proven mediastinal infiltration, it was also thought to be present in many patients with noninvasive thymoma.
Table 4-10 Relationship of Thymoma Histology to Stage, Surgical Results, and Survival | |||||||||||||||||||||||||||||||||||
|---|---|---|---|---|---|---|---|---|---|---|---|---|---|---|---|---|---|---|---|---|---|---|---|---|---|---|---|---|---|---|---|---|---|---|---|
| |||||||||||||||||||||||||||||||||||
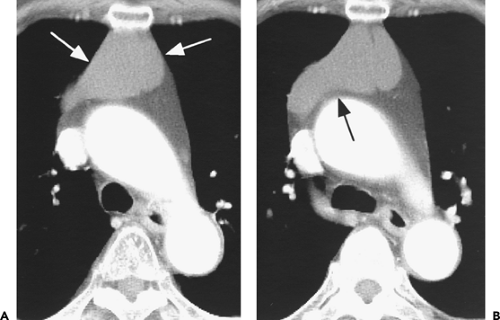 Figure 4-23 Noninvasive thymoma. A: A large homogeneous mass (arrows in A and B) is visible in the prevascular space on a contrast-enhanced helical CT scan. It extends preferentially to the right side. B: It is separated from the ascending aorta by a well-defined fat plane, suggesting that it is noninvasive. |
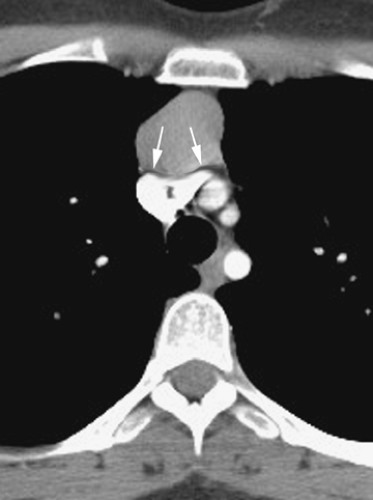 Figure 4-24 Noninvasive thymoma. A focal, sharply marginated, rounded mass is visible in the prevascular space. The right and left brachiocephalic veins are displaced posteriorly, but a fat plane separating the thymoma and vessels is visible. |
On the other hand, clear delineation of fat planes surrounding a thymoma on CT should be interpreted as indicating an absence of extensive local invasion, especially when the study is performed with thin collimation following a bolus of intravenous contrast medium (120). However, capsular invasion may be present without disruption of adjacent fat planes.
The presence of additional CT findings may be used to predict invasion (Figs. 4-22, 4-29, 4-30, 4-31, 4-32 and 4-33). These include large tumor size, lobulation, irregular contours, heterogeneous opacification, areas of low attenuation, and calcification. In a study by Tomiyama et al. (158), the CT scans of 27 patients with invasive thymoma and 23 patients with noninvasive thymoma were compared. Invasive thymomas were significantly larger (mean long-axis diameter 5.50 cm) than noninvasive thymomas (long axis diameter 3.95 cm) (p < .05). Also, invasive thymomas were more likely to have lobulated (16/27, 59%) or irregular (6/27, 22%) contours than noninvasive thymomas (8/23, 35% and 1.5/23, 6%, respectively) (p < .05). Homogeneous enhancement was found in 11 of 27 (44%) cases of invasive thymoma and 15 of 23 (79%) cases of noninvasive thymoma (p < .05). Invasive thymomas had a higher prevalence of focal low-attenuation areas seen on CT (16/27, 60%) than
noninvasive thymomas (5/23, 22%) (p < .001) as well as foci of calcification (14.5/27, 54% vs. 6/23, 26%; p < .01). In this study, the combination of lobulated or irregular tumor contour and areas of low attenuation was seen in 15 of 27 (56%) cases of invasive thymoma and 2.5 of 23 (11%) cases of noninvasive thymoma. The combination of lobulated or irregular contour, areas of low attenuation, and calcification was seen in 7.5 of 27 (28%) cases of invasive thymoma and 1.5 of 23 (7%) cases of noninvasive thymoma. The combination of lobulated or irregular contour, areas of low attenuation, and multifocal calcification was seen in 5 of 27 (19%) cases of invasive thymoma and no cases of noninvasive thymoma. The combination of smooth contour and homogeneous enhancement was
found in 3 of 25 (12%) cases of invasive thymoma and 9.5 of 19 (50%) cases of noninvasive thymoma (158).
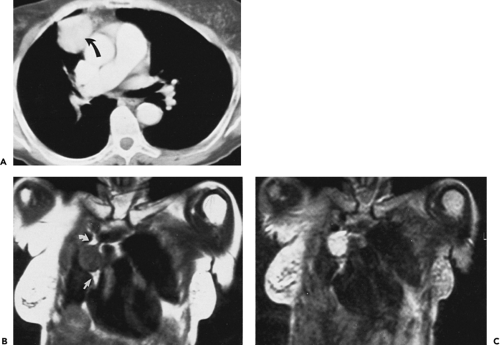 Figure 4-25 Noninvasive thymoma: CT and MR findings. A: CT section at the level of the right main pulmonary artery following a bolus of intravenous contrast media. A well-defined rounded mass of soft tissue attenuation is present on the right side (arrow). B, C: T1- and T2-weighted coronal images through the mass, respectively. On the T1-weighted image, fat clearly marginates both the superior and the inferior borders of the mass (arrows in B), indicative of a mediastinal origin. The margins of the mass are sharply marginated. On the T2-weighted image (C), there is marked increase in the relative signal of the lesion. |
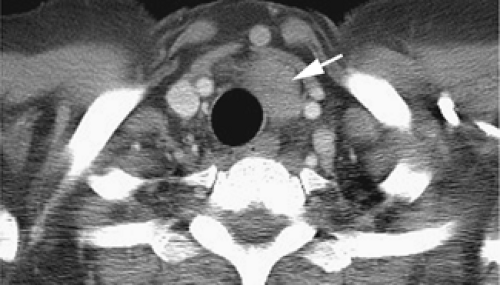 Figure 4-26 Cervical thymoma. A noninvasive thymoma (arrow) is visible anterior and lateral to the trachea in the neck. |
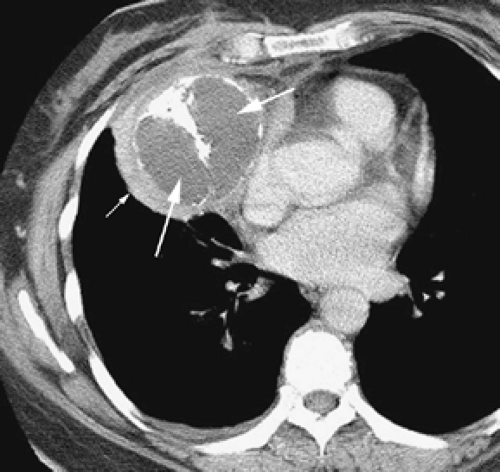 Figure 4-27 Cystic thymoma. Thymoma with cystic components (arrows) and calcification is visible in the right paracardiac mediastinum. A thick wall (small arrow) distinguishes this abnormality from a simple cyst. |
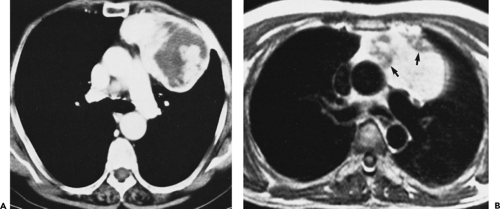 Figure 4-28 Cystic thymoma. (A) Contrast-enhanced CT scan shows a well-defined partially cystic mass in the anterior mediastinum within which distinct soft tissue nodules can be seen. Biopsy proved cystic thymoma. (B) MR image in a patient different from the patient in A shows a heterogeneous high signal intensity mass in the anterior mediastinum within which discrete nodules of intermediate signal intensity can be identified (arrows). Although most thymomas are solid, occasional thymomas prove to be at least partially cystic. High signal intensity within the mass proved to be secondary to complex cystic fluid and not fat. Cystic thymoma was surgically documented. |
The CT appearance of a thymoma is also related to its histology determined using the WHO classification system (Figs. 4-34, 4-35 and 4-36; see Fig. 4-42) (143,171,172). On CT, a smooth contour and round shape are most suggestive of a type A tumor, and pleural seeding is rare in type A and AB tumors. Calcification is suggestive of type B, but CT is of limited value in differentiating among types AB, B1, B2, and B3 (171). An irregular contour strongly suggests a type C tumor (thymic carcinoma). Also, type C tumors are significantly larger and more commonly associated with lymphadenopathy than type B3. For example, in a CT study of 53 patients with a thymic epithelial tumor classified using WHO criteria (171), type A tumors were more likely to have smooth contours on CT (100%) and round shapes (88%)
than any other type of thymic epithelial tumor (p < .05). Calcification was more frequently seen in type B1 (44%), type B2 (61%), and type B3 (75%) tumors than in type AB (14%) and type C (6%) tumors (all p < .05). Type C tumors had a higher prevalence of irregular contours (75%) than any other type of thymic epithelial tumor (p < .05).
than any other type of thymic epithelial tumor (p < .05). Calcification was more frequently seen in type B1 (44%), type B2 (61%), and type B3 (75%) tumors than in type AB (14%) and type C (6%) tumors (all p < .05). Type C tumors had a higher prevalence of irregular contours (75%) than any other type of thymic epithelial tumor (p < .05).
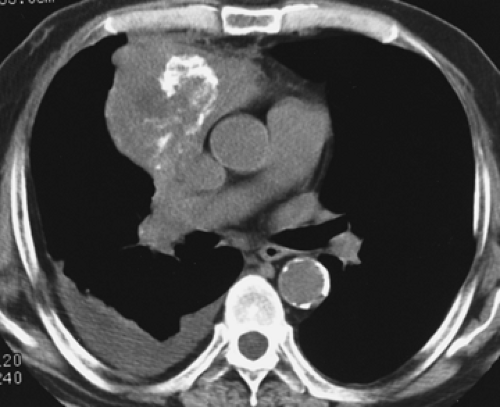 Figure 4-29 Thymoma with calcification. A bulky, lobulated mass in the prevascular space contains dense areas of calcification. The presence of pleural effusion on the side of the tumor suggests that the tumor is invasive. |
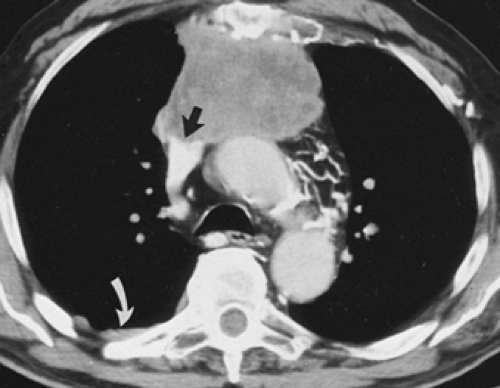 Figure 4-30 Invasive thymoma: CT findings. Contrast-enhanced CT section through the carina shows a lobulated, slightly heterogeneous soft tissue mass that is invading the adjacent superior vena cava (straight arrow). Enlarged collateral vessels can be identified in the region of the aortopulmonary window draining into the hemiazygos and azygos veins. Pleural implants are apparent on the right side (curved arrow). |
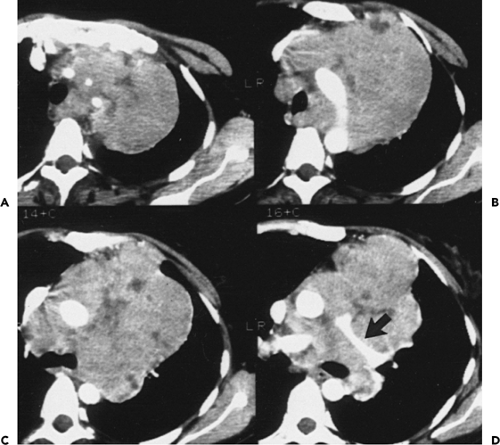 Figure 4-31 Invasive thymoma: CT findings. A–D: Sequential contrast-enhanced CT sections through the mediastinum show a bulky, heterogeneous soft tissue mass deeply invading the mediastinum with encasement of all the great vessels as well as the left main pulmonary artery (arrow in D). |
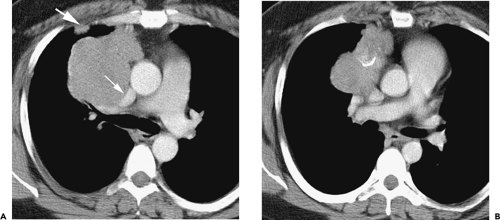 Figure 4-32 Invasive thymoma in a patient with myasthenia gravis: CT findings. A: Enhanced CT at the level of the left pulmonary artery shows a large lobulated mass with compression of the superior vena cava (small arrow). A fat plane separating the superior vena cava and mass is not visible. A pleural nodule is present anteriorly (large arrow). B: At a lower level, the mass appears somewhat heterogeneous in attenuation and calcification is visible within the mass. |
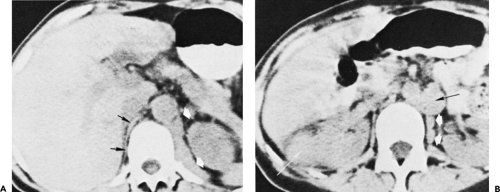 Figure 4-33 Invasive thymoma: CT findings. Invasive thymomas may involve the diaphragm by contiguous spread. A: CT at the level of the diaphragm shows a normal right crus (black arrows) and thickening of the left crus (white arrows) because of tumor invasion. B: At a lower level, thickening of the left crus (white arrows) is again seen. A nodule of tumor (black arrow) extends through the aortic hiatus to involve the retroperitoneum. |
Invasive thymomas growing along pleural surfaces can reach the posterior mediastinum and extend downward along the aorta to involve the crus of the diaphragm and the retroperitoneum (Figs. 4-22 and 4-33) (140). These areas are “hidden” on chest radiographs, but CT excels at demonstrating these sites of involvement (153,154). A full CT examination of the thorax extended to include the upper abdomen should be performed in these patients. Metastases are apt to be silent because only a minority of patients with invasive thymomas present with symptoms from intrathoracic spread. CT provides invaluable guidance for the radiotherapist and chemotherapist to adjust their treatment plans (162).
Because of the large size of the normal thymus in patients younger than 25 years, diagnosing thymoma in this age group can be difficult. However, thymomas are extremely rare in this age group, and, unless very obvious, we would avoid diagnosing thymoma in a patient younger than 25 years (134,165,169,170,175). In patients older than the age of 40 years, the diagnosis of thymoma on CT usually poses no problem, as the normal thymus is largely replaced by fat. In patients ranging from 25 to 40 years, the thymus may be well seen, and, unless a definite mass is visible, as is often the case in the presence of thymoma, a definite diagnosis cannot be made. It should be noted that invasive thymomas, our main concern, are slow-growing tumors, having little potential for distant metastases, and, if in doubt, a follow-up CT examination can be safely recommended. The clinical information and CT features that are most helpful in distinguishing between a thymoma and a prominent but normal thymus are summarized in Table 4-6.
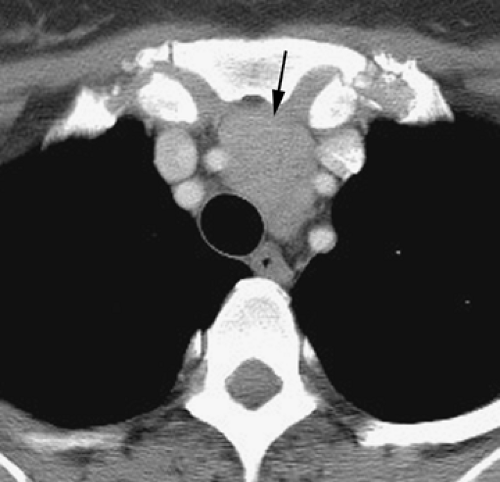 Figure 4-34 Thymoma: histology and CT findings. World Health Organization (WHO) type A thymoma. A rounded, smoothly marginated mass (arrow) is visible in the anterior mediastinum. At surgery, the tumor capsule was intact, without evidence of invasion. |
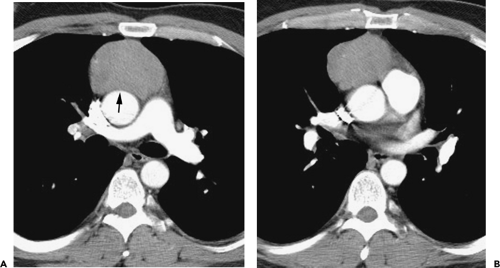 Figure 4-35 Thymoma: histology and CT findings. World Health Organization (WHO) type B1 thymoma. A, B: A large mass is visible in the prevascular space. A fat plane separating the mass from aorta is obliterated (arrow, A). It has a slightly lobulated contour best shown in B. Pericardial invasion was present at surgery. |
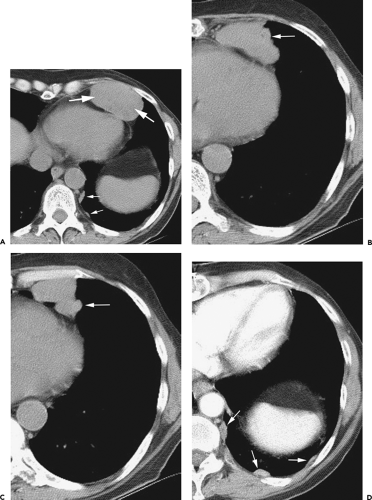 Figure 4-36 Thymoma: histology and CT findings. World Health Organization (WHO) type B3 thymoma. A: A large rounded mass (large arrows) is visible in the left anterior mediastinum. Focal areas of pleural thickening within the posterior left hemithorax represent pleural implants. B, C: At two levels, the tumor is irregular in contour (arrows, B and C). D: After resection, the pleural implants (arrows) appear increased in size. |
Magnetic Resonance Imaging Findings of Thymoma
Thymomas typically have a signal intensity similar to or slightly greater than that of muscle on T1-weighted MRI, and signal intensity increases with T2 weighting (Figs. 4-37, 4-38, 4-39 and 4-40) (92,115,176). On T2-weighted images thymomas demonstrate signal intensity higher than that of muscle and similar to that of fat. Also, with T2-weighting, thymomas may appear homogeneous in intensity, may appear inhomogeneous because of cystic areas or regions of hemorrhage, or may show nodules or lobules of tumor separated by thin, relatively low intensity septations (Fig. 4-38) (177,178). With gadolinium–diethylenetriamine penta-acetic acid
(Gd-DTPA)–enhanced MR imaging, homogeneous and moderate enhancement is often observed.
(Gd-DTPA)–enhanced MR imaging, homogeneous and moderate enhancement is often observed.
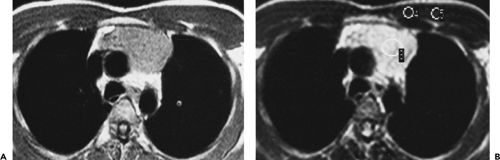 Figure 4-37 Thymoma: MRI assessment. A: T1-weighted MR image at the level of the carina shows a homogeneous soft tissue mass of intermediate signal intensity within the anterior mediastinum. B: T2-weighted MR image at the same level as shown in A. There is considerable signal enhancement within the mass that is now more difficult to differentiate from adjacent mediastinal fat. This appearance is entirely nonspecific. Biopsy proved thymoma. |
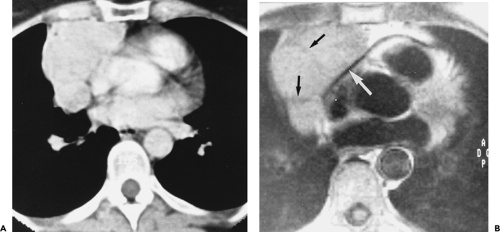 Figure 4-38 Noninvasive thymoma: MRI assessment. A: Contrast-enhanced CT at the level of the aortic root shows a large thymic mass within which there is a suggestion of lobulation. B: T1-weighted axial MRI at the same level as in A shows the thymic mass is clearly distinguished from the normal fluid filled pericardium (white arrow). There no evidence of pericardial invasion or effusion or vascular invasion. Relatively low intensity septations (black arrows) delineate lobules of tumor. |
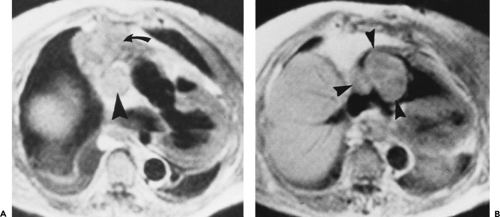 Figure 4-39 Invasive thymoma: MRI evaluation. A, B: Sequential MR images through the heart show a poorly marginated mass of intermediate signal intensity within the anterior mediastinum (curved arrow in A) that is directly invading the superior mediastinum (arrowhead in A). The mass extends into the right atrium and can be seen crossing the tricuspid valve plane to enter the right ventricle (arrowheads in B). A moderately sized right pleural fluid collection is present as well. Invasive thymoma was surgically documented. |
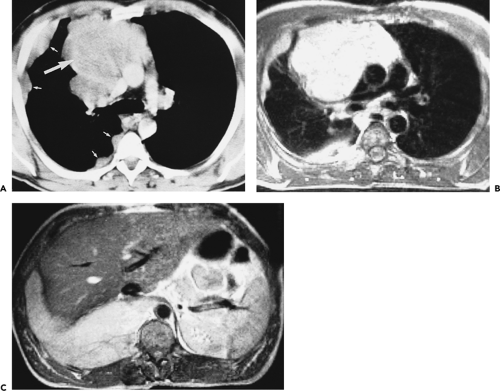 Figure 4-40 Invasive thymoma. A: Contrast-enhanced CT shows a large, lobulated thymoma (large arrow). There is marked displacement of the mediastinal vessels. Right pleural masses (small arrows) represent pleural metastases occurring because of invasion of the pleural space. B: TR/TE 1500/30 MRI clearly shows the relationship of the mass to great vessels. The pleural masses are visible as in A. C: MRI at a lower level shows large lobulated right pleural metastases These are typical of pleural metastases from thymoma. |
The appearance of a thymoma on MRI is partially related to its WHO histologic type. The overall signal intensity of types B2 and B3 thymoma is similar to that of types A, AB, and B1 tumors on both T1- and T2-weighted images. However, with T2-weighted imaging, most B2 and B3 thymomas show inhomogeneous signal intensity with scattered high-intensity areas. At pathologic examination these areas correspond to cystic spaces, with or without the presence of hemorrhage (172,178). Also, a lobulated internal architecture, with tumor lobules being separated by low-intensity bands, is more frequent in types B1, B2, and B3 tumors than in other histologic types (172).
In a study comparing the MRI appearances of invasive and noninvasive thymomas with pathologic findings, Sakai et al. (178) found that 6 of 12 invasive thymomas showed a multinodular or lobulated internal architecture on T2-weighted images, with tumor lobules separated by 1- to 2-mm low-intensity fibrous septa; this lobular appearance was not seen in any of 5 patients with noninvasive lesions. The lobulated appearance described by Sakai et al. is identical to that seen in patients with WHO type B2 or B3 tumors, which are more likely invasive than types A, AB or B1 thymoma. Although lobular internal architecture may be regarded as suggestive of invasive thymoma, it must be considered nonspecific, as it can also be seen with noninvasive tumors (Fig. 4-38).
MRI has proven valuable in identifying the presence or absence of vascular invasion in patients with thymoma, especially patients in whom intravenous contrast cannot be administered. In these cases, MRI exquisitely delineates the extent of vascular involvement, including identification of intracardiac disease extension (Fig. 4-39). Extension to other sites (Fig. 4-40) and recurrent tumor after resection or radiation (Fig. 4-41) may also be shown using MRI.
The MRI enhancement may also be of value in diagnosis and staging of thymoma. In a study by Sakai et al. (179), 59 patients with anterior mediastinal tumors were examined using contrast-enhanced dynamic MRI. Thirty-one had thymomas and 28 had other lesions, including carcinomas, lymphoma, germ-cell tumor, and thymic carcinoid tumor. Sequential images were obtained at 30-second intervals for 5 minutes after bolus contrast injection. They found significant differences in the mean time of peak enhancement, depending on the tumor type. The mean peak enhancement time was 1.5 minutes for thymoma and 3.2 minutes for other tumors. Using a peak enhancement time of 2 minutes or less as the threshold, dynamic MRI had a sensitivity of 79%, specificity of 84%, and accuracy of 81% in distinguishing thymoma (enhancement time of 2 minutes of less) from other tumors (peak enhancement time of 2.5 minutes or more) (179). Furthermore, stages I and II thymomas
showed a mean peak enhancement time of 1.3 minutes as compared to 2.5 minutes for stage III tumors.
showed a mean peak enhancement time of 1.3 minutes as compared to 2.5 minutes for stage III tumors.
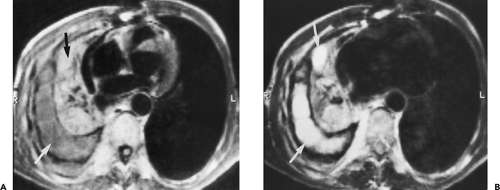 Figure 4-41 Recurrent thymoma after irradiation. A: T1-weighted image. Collapsed and fibrotic lung (black arrow) secondary to radiation fibrosis is visible medially. Tumor within the right pleural space (white arrow) is of similar intensity with this imaging sequence. B: With T2 weighting, high-intensity areas (arrows) within the fibrotic lung and pleural space represent recurrent tumor. This was confirmed at biopsy. |
Imaging in Myasthenia Gravis
Myasthenia gravis is commonly associated with thymic pathology. Sixty-five percent of patients with myasthenia gravis have thymic hyperplasia, thymoma is present in from 10% to 28% of patients with myasthenia gravis, and the remainder have a normal or involuted thymus.
Although there is no convincing evidence to suggest that thymectomy improves the outcome of myasthenia patients who are well controlled medically, it is generally agreed that thymectomy is indicated, regardless of thymic status, when medical therapy fails. In this setting, effective surgical treatment necessitates complete removal of all thymic tissue. Because surgical-anatomic studies have shown that both gross and microscopic thymic tissue is widely distributed throughout the mediastinum, it has been suggested that en bloc transcervical-transsternal “maximal” thymectomy be performed (180). Myasthenia patients most likely to benefit from thymectomy, in terms of disease control, are young females with a disease of short duration. Older patients and patients with longstanding myasthenia rarely benefit from thymectomy.
The role of CT in patients with myasthenia remains somewhat unclear, at least partially because the role of surgery in patients with myasthenia gravis, in relation to thymic histology, is not clearly defined (181). Although the presence of thymic enlargement or a focal mass on CT reliably indicates the presence of FTH or thymoma (114), these findings do not have a strong correlation with surgical outcome. In one study (114) of 45 patients with myasthenia gravis having thymectomy, 17 of 19 patients showing thymic enlargement or focal thymic mass on CT improved following thymectomy, although improvement was seen in 80% of those having a normal thymus on CT. The presence of an abnormality on CT is not necessary in choosing patients for thymectomy, as a normal CT does not exclude FTH, and poor clinical response determines the need for thymic resection regardless of the presence or absence of thymic hyperplasia.
On the other hand, because thymoma is invasive in about 30% of cases, thymectomy is indicated in all patients who have thymoma, regardless of the effect of surgery on the course of the disease. The role of the radiologist in patients with myasthenia, most appropriately, is to diagnose patients in whom thymoma is likely, because of the presence of a focal thymic mass, and to distinguish them from patients who show thymic enlargement indicative of hyperplasia; such patients require surgery regardless of their likelihood of responding to thymectomy, based on their age and the duration of their symptoms.
In patients with myasthenia gravis, CT is more accurate in making the diagnosis of thymoma than thymic hyperplasia. In a study of 104 patients with myasthenia who had thymectomy, CT was considered to show thymoma in 46 of 52 patients (sensitivity 88.5% and specificity 77%). In 44 patients with hyperplasia at histology, thymic hyperplasia was diagnosed on CT in only 16 cases (sensitivity 36%, specificity 95%).
The MRI appearance of the thymus in patients with myasthenia gravis has been described, but its utility in diagnosing thymic abnormalities in this setting appears limited. In a study of 16 patients with myasthenia gravis, imaged with both CT and MRI, who subsequently underwent thymectomy, MRI provided little, if any, distinctive information as compared with CT. Specifically, no distinctive MRI
features could be identified in patients with thymomas apart from the presence of a mass (182). In seven patients with a histologic diagnosis of thymic hyperplasia, both CT and MRI displayed normal thymic morphology in five patients and an enlarged and a small thymus in one patient each, respectively. Unfortunately, MRI signal intensities were of no value in differentiating thymic hyperplasia from normal thymus.
features could be identified in patients with thymomas apart from the presence of a mass (182). In seven patients with a histologic diagnosis of thymic hyperplasia, both CT and MRI displayed normal thymic morphology in five patients and an enlarged and a small thymus in one patient each, respectively. Unfortunately, MRI signal intensities were of no value in differentiating thymic hyperplasia from normal thymus.
Thymic Carcinoma
Thymic carcinoma, like thymoma, arises from thymic epithelial cells (122,183,184,185), but it is much less common. Thymic carcinoma accounts for about 20% of thymic epithelial tumors. Unlike thymoma, thymic carcinoma can be diagnosed as malignant on the basis of histologic criteria. In the WHO classification system of thymic epithelial tumors reviewed previously (Tables 4-8 and 4-9), thymic carcinoma is type C.
Thymic carcinoma is aggressive and more likely to result in distant metastases than invasive thymoma; although distant metastases are present in only about 5% of patients with invasive thymoma, they are present at diagnosis in 50% to 65% of patients with thymic carcinoma (184). Frequent sites of metastasis include the lungs (105), liver, brain, and bone (184). Complete surgical resection is the desired treatment, but relapse rates and mortality are high (185). It has a poor prognosis.
Thymic carcinoma is most frequently encountered in the fifth and sixth decades of life. Symptoms are usually attributable to the mediastinal mass, and superior vena cava syndrome may be present. Although paraneoplastic syndromes such as myasthenia gravis, pure red cell aplasia, and hypogammaglobulinemia are common with thymoma, they are rare with thymic carcinoma (184,185).
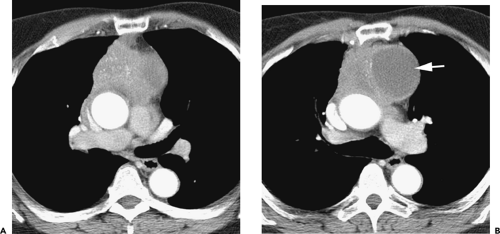 Figure 4-42 Thymic carcinoma, World Health Organization (WHO) type C. A: A large, poorly marginated, and irregular mass in the anterior mediastinum shows stippled calcification. Fat planes separating the mass from aorta and main pulmonary artery are poorly seen. B: At a different level, a cystic region or thymic cyst (arrow) is visible in association with the tumor. |
Thymic carcinoma cannot be distinguished from thymoma on CT unless enlarged lymph nodes are visible in the mediastinum or distant metastases are evident (105,122,143,186). A large mass with or without areas of low attenuation is typical but not specific (105,143,171,183). In one study, thymic carcinoma averaged 7.2 cm in diameter (143). Calcification is uncommon, being seen on CT in 6% of patients in one study (171).
An irregular contour strongly suggests thymic carcinoma rather than thymoma. In one study, thymic carcinomas showed an irregular contour in 75% of cases (Fig. 4-42) (171). However, thymoma is more likely than thymic carcinoma to result in local invasion (186). In a study by Do et al. (186), irregular infiltration of adjacent structures was seen in 92% of patients with invasive thymoma and 80% of those with thymic carcinoma. Pleural implants were observed in 33% of patients with invasive thymoma and 10% of those with thymic carcinoma. On the other hand, mediastinal lymphadenopathy was seen in 8% with invasive thymoma and 40% with thymic carcinoma. Metastases to the lung, adrenal glands, or liver were observed in 40% with thymic carcinoma but none with invasive thymoma (186).
In a study by Jung et al., the CT appearances in 9 patients with invasive thymoma and 18 with thymic
carcinoma were compared. Most tumors had a lobulated contour (24/27, 89%). Thymic carcinomas were significantly larger (mean, 7.2 cm) than invasive thymomas (mean, 4.7 cm) (p = 0.041). Findings of invasion of the great vessels, lymph node enlargement, extrathymic metastases, and phrenic nerve palsy were seen only in patients with thymic carcinoma (143).
carcinoma were compared. Most tumors had a lobulated contour (24/27, 89%). Thymic carcinomas were significantly larger (mean, 7.2 cm) than invasive thymomas (mean, 4.7 cm) (p = 0.041). Findings of invasion of the great vessels, lymph node enlargement, extrathymic metastases, and phrenic nerve palsy were seen only in patients with thymic carcinoma (143).
On MRI, thymic carcinoma appears higher in signal intensity than muscle on T1-weighted MR images, with an increase in signal on T2-weighted images (176). Heterogeneous signal may reflect the presence of necrosis, cystic regions within the tumor, or hemorrhage. It has been suggested by Endo et al. (177) that thymoma has a greater tendency to show a multinodular appearance on MRI than thymic carcinoma. Of the 15 cases of thymoma they reported (177), 79% showed lobulation, with areas of tumor separated by thick fibrous septa of lower intensity; this appearance was not seen in their 5 cases of thymic carcinoma.
Using FDG-PET, Sasaki et al. (187) found a mean standardized uptake value (SUV) of 7.2±2.9 for thymic carcinoma, higher than that in invasive thymoma (3.8±1.3), noninvasive thymoma (3.0±1.0), and thymic cysts (0.9) (p < .01). By using an SUV of 5.0 as a threshold, the authors achieved a sensitivity of 84.6%, a specificity of 92.3%, and an accuracy of 88.5% in distinguishing thymic carcinoma from thymoma.
Thymic Neuroendocrine Tumor
Thymic neuroendocrine tumors are believed to arise from thymic cells of neural crest origin (81,104,125,188,189). They may be classified as carcinoid tumor (Fig. 4-43), atypical carcinoid (Fig. 4-44), or small cell neuroendocrine carcinoma, depending on their histologic characteristics and in order of increasing malignancy. The biologic behavior of these tumors shows a direct relation to their degree of differentiation, but each of these tumor types behaves in an aggressive and malignant fashion, with a tendency for local recurrence or distant metastases following resection (190,191). A male preponderance (3:1) has been reported and the mean age at presentation is 54 years (189). Most patients present with symptoms related to compression of mediastinal structures. Approximately 40% of patients have Cushing syndrome as a result of tumor secretion of adrenocorticotrophic hormone (ACTH) (Fig. 4-44) (192), and up to 20% have been associated with multiple endocrine neoplasia (MEN) syndromes I and II (193). This tumor is rarely associated with the typical carcinoid syndrome. Whenever possible, surgical resection is the treatment of choice (189). Radiotherapy or adjuvant chemotherapy may also be employed (164,194).
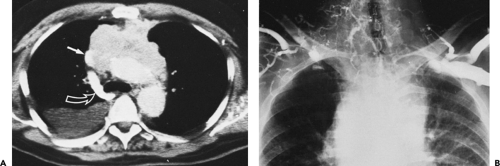 Figure 4-43 Thymic carcinoid tumor with superior vena cava obstruction. A: Contrast-enhanced CT section at the level of the carina shows a bulky, somewhat heterogeneous, enhancing soft tissue mass within the prevascular space, obliterating the left brachiocephalic vein and invading the superior vena cava (arrow). There is dense opacification of the azygos vein (curved arrow) serving as a collateral. B: Coned-down view from simultaneous bilateral antecubital fossa venous injections shows complete obstruction of the brachiocephalic veins bilaterally. At surgery this proved to be a primary thymic carcinoid tumor. |
Although thymic neuroendocrine tumor does not differ significantly from thymoma in radiographic or CT appearance (92,122,190), the diagnosis can be suspected on clinical grounds if associated with Cushing syndrome or MEN. In some patients, a mediastinal mass may not be visible on CT despite the presence of endocrine abnormalities (188). In some patients, the tumor may show marked enhancement (Figs. 4-43 and 4-44). This tumor is more aggressive than thymoma, often presenting in an advanced stage, and superior vena cava obstruction is much more common with thymic carcinoid than with thymoma (Fig. 4-43). Regional lymph node metastases may be seen (Fig. 4-44), and distant metastases, which may include blastic bone lesions, are seen in many cases. MRI findings are nonspecific and identical to those of thymoma (92).
Octreotide radionuclide imaging or PET may be valuable in imaging these tumors (195).
Octreotide radionuclide imaging or PET may be valuable in imaging these tumors (195).
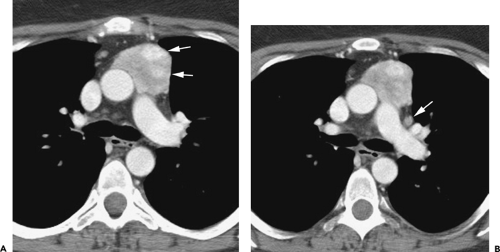 Figure 4-44 Atypical thymic carcinoid tumor in a patient with Cushing syndrome. A: A mass in the prevascular space shows areas of dense enhancement (arrows). B: At a different level, an enlarged lymph node (arrow) is associated with the tumor. |
Thymolipoma
Thymolipoma is a rare, benign, well-encapsulated thymic tumor, consisting primarily of fat but also containing variable amounts of thymic tissue; it can arise within the thymus or be connected to the thymus by a pedicle (104,125,196). It can be seen at any age, but is most common in children and young adults. In a recent review of 27 cases, 81% presented in the first four decades (196).
In a majority of cases, thymolipoma is unaccompanied by symptoms and detected incidentally on chest radiograph. However, in some patients thymolipoma may present with symptoms resulting from compression of mediastinal structures, such as dyspnea or chest pain. An association with myasthenia gravis has been reported but is rare (197).
Thymolipomas are often large, ranging up to 36 cm in diameter (mean 18 cm) at the time of diagnosis, and may project into both hemithoraces (196,198). Because of its fatty content and pliability, it tends to drape over the heart, extending inferiorly into the cardiophrenic angles, and can simulate cardiac enlargement. Radiographically they have also been mistaken for pleural or pericardial tumors, basal atelectasis, and even pulmonary sequestration (199).
On CT, thymolipoma usually appears to contain a significant amount of fat, but three patterns have been reported (196). Most common is a combination of fat and wisps of soft tissue (Fig. 4-45); in 8 of 11 patients having CT, roughly equal amounts of fat and soft tissue were visible, with the soft tissue appearing as linear whorls intermixed with fat (seven cases) or as rounded opacities embedded within the fat (one case). The second pattern, seen in two cases, was that of predominant fat attenuation, with tiny internal foci of soft tissue. The final pattern was seen in a single case in which a mass appeared to be primarily of soft tissue attenuation. In all cases, CT showed a connection between the mass and the thymic bed, which was narrow in seven cases and broad in four. When fat is
visible on CT, a preoperative diagnosis can often be made. As would be expected from their fat content, MRI shows areas of high signal intensity on T1-weighted SE images, similar to the intensity of subcutaneous fat, with areas of intermediate signal intensity reflecting the presence of soft tissue (115,196,200). Despite attaining a large size, thymolipomas do not invade surrounding structures (201). However, some compression of mediastinal structures is visible in half of cases (196).
visible on CT, a preoperative diagnosis can often be made. As would be expected from their fat content, MRI shows areas of high signal intensity on T1-weighted SE images, similar to the intensity of subcutaneous fat, with areas of intermediate signal intensity reflecting the presence of soft tissue (115,196,200). Despite attaining a large size, thymolipomas do not invade surrounding structures (201). However, some compression of mediastinal structures is visible in half of cases (196).
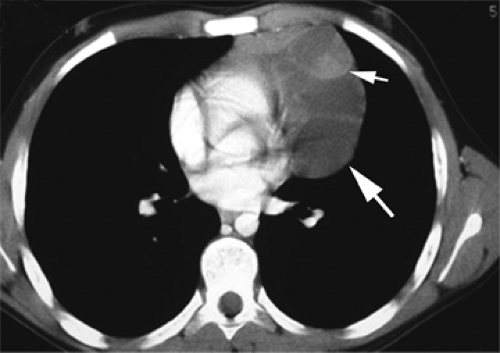 Figure 4-45 Thymolipoma. A large mass is visible anterior and to the left of the heart (large arrow). It is composed primarily of fat, although some soft tissue (small arrow) is visible within the mass. |
Thymic Cyst
Thymic cyst can be either congenital or acquired. Thymic cyst accounts for 1% of anterior mediastinal masses (93). Acquired thymic cysts are generally associated with inflammation and have been reported following radiation therapy for HL (202,203), in association with thymic tumors (Fig. 4-42) (204,205,206), and following thoracotomy (207).
Congenital thymic cysts are usually unilocular, have a thin wall, and contain clear fluid (Fig. 4-46) (93). They may occur in the neck but are quite rare in this location (208). Acquired thymic cysts are often multilocular (93). Multilocular thymic cysts have been seen in children with HIV infection (130,131). The attenuation of thymic cysts is usually that of water but can be higher or lower depending on the presence of hemorrhage or lipid deposits. Calcification of the cyst wall can also be seen.
One should be conservative in making the diagnosis of thymic cyst, as cystic regions can be seen in a variety of thymic tumors, including thymoma and lymphoma (93). CT can suggest the diagnosis if (a) the cyst appears thin walled, (b) it is unassociated with a mass lesion, and (c) it contains fluid with a density close to that of water or remains unopacified following contrast infusion. MRI characteristics are similar to those of other cystic lesions (115).
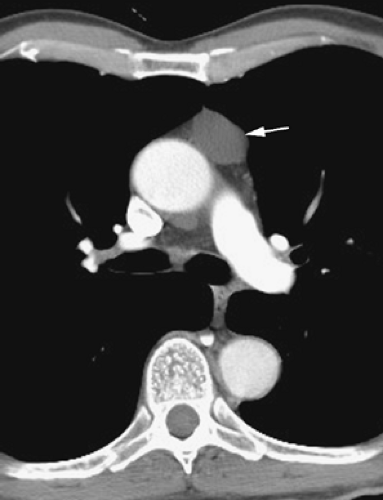 Figure 4-46 Thymic cyst. A low-attenuation, sharply marginated cyst is visible in the region of the thymus (arrow). A cyst wall is not visible. |
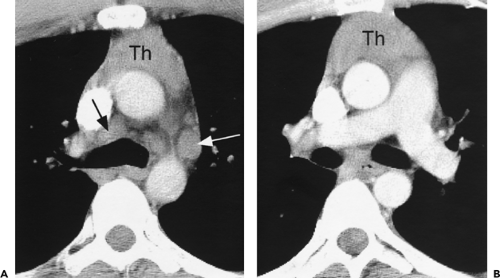 Figure 4-47 Hodgkin disease with thymic involvement. A, B: Contrast-enhanced CT scans at the level of the aorticopulmonary window and main pulmonary artery, respectively, show thymic enlargement (Th) and enlarged lymph nodes in the pretracheal space (black arrow in A) and aorticopulmonary window (white arrow in A). Lymph node enlargement in conjunction with thymic enlargement is typical of lymphoma involving the thymus. |
Thymic Lymphoma and Metastases
HL has a predilection for involvement of the thymus in conjunction with involvement of mediastinal lymph nodes (Figs. 4-47 and 4-48) (209). In a study of adults with newly diagnosed HL involving the thorax, thymic enlargement was seen in 30% and in all, mediastinal lymph nodes were also enlarged (Figs. 4-47, 4-48 and 4-49). In a study of 60 pediatric patients with HL, 17 (28%) had thymic enlargement; this represented 49% of patients with a mediastinal abnormality (210). In this study, 73% also showed mediastinal lymph node enlargement. Thymic enlargement was seen in 38% patients with intrathoracic recurrence (209). Thus, HL, particularly the nodular sclerosing type, should be considered in the differential diagnosis of a thymic mass, but lymph node enlargement is typically present, at least in adults, and should suggest the correct diagnosis. Non-Hodgkin lymphoma (NHL) much less commonly involves the thymus.
Thymic involvement in Hodgkin or other lymphomas is usually indistinguishable from thymoma or other causes of anterior mediastinal mass. Lobulation or a nodular appearance is common (211). In some cases, the enlarged thymus retains its normal shape, with an arrowhead (83%) or bilobed (17%) appearance, but appears enlarged and has convex borders where it contacts lung (209). In adults, the thickness of the thymus in patients with Hodgkin disease measured 1.5 to 5 cm (209); in
children, thickness of the larger thymic lobe ranged from 2.5 to 8.6 cm (210).
children, thickness of the larger thymic lobe ranged from 2.5 to 8.6 cm (210).
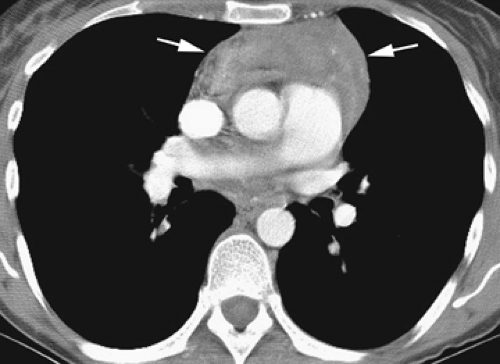 Figure 4-48 Hodgkin disease with thymic involvement. Anterior mediastinal mass (arrows) likely represents thymic involvement because of its typical shape. Lymph node enlargement was visible at other levels. |
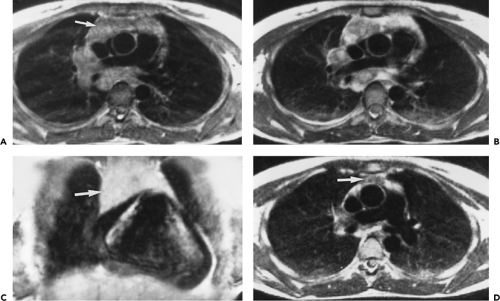 Figure 4-49 Hodgkin lymphoma with thymic involvement: MR findings. A: T1-weighted transaxial image shows a large thymic mass (arrow), associated with right hilar and subcarinal lymphadenopathy. B: With T2 weighting the mass appears inhomogeneous, a finding common with lymphomas. C: T1-weighted coronal image shows the thymic mediastinal mass (arrow), associated with a large pericardial effusion. D: After radiation, a T2-weighted image at the same level as C shows the thymic mass (arrow) to be significantly reduced in size, as are the hilar lymph nodes. |
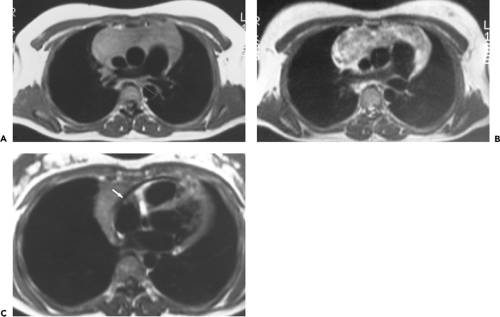 Figure 4-50 Thymic lymphoma. A: A T1-weighted image (800/20) shows thymic enlargement appearing homogeneous in intensity. B: With T2 weighting (2400/70), the mass appears inhomogeneous. (C) At a lower level, the relationship of the mass to the fluid filled pericardium (arrow) is visible on a coronal image obtained with T1-weighting. |
In patients with lymphoma, the thymus usually appears homogeneous in attenuation, but an inhomogeneous nodular internal architecture can be seen (210,211). Cystic areas of necrosis may be visible at CT; this has been reported in 21% to 23% of adult patients (209,211) but is less common in children (210). Except in occasional cases, calcification does not occur in the absence of radiation (210).
On MRI, thymic lymphoma shows low intensity on T1-weighted images, with a variable change on T2-weighted images (115). In one study (58), two of seven patients with thymic lymphoma had a homogeneous appearing thymus, whereas in the remaining five, areas of increased or decreased intensity were visible on T2-weighted images (Fig. 4-50). The low-intensity areas may represent fibrosis, whereas the high-intensity areas could reflect hemorrhage or cystic degeneration. Although the MRI characteristics of lymphoma are not characteristic, the combination of a thymic mass with mass or lymph node enlargement in other areas of the mediastinum is very suggestive of the diagnosis.
Lung and breast carcinomas, and other metastatic tumors, can also involve the thymus (212). In the case of lung cancer this is typically the result of direct extension, although hematogenous metastases may also occur. Involvement of mediastinal lymph nodes is also typically present. CT and MRI appearances of thymic metastases are nonspecific.
Germ-Cell Tumors
Primary germ-cell tumors account for about 10% to 15% of primary mediastinal masses and a higher proportion of anterior mediastinal masses. They are histologically identical to their gonadal counterparts (81,104). Presumably they arise from primitive germ cells that have arrested their embryologic migration in the mediastinum, frequently within the thymus (123,213). They are most common in the anterior mediastinum; only about 5% to 8% originate in the posterior mediastinum (81,123,124). Most germ-cell tumors present during the second to fourth decades of life. Germ-cell tumors include benign and malignant teratoma, seminoma, embryonal carcinoma, endodermal sinus (yolk sac) tumor, choriocarcinoma, and mixed types (92,214,215). Generally, these tumors are considered in three categories: (a) teratoma, (b) seminoma, and (c) nonseminomatous germ-cell tumors.
Overall, more than 80% of germ-cell tumors are benign (Table 4-11) (124,216), with the large majority of benign tumors being teratomas. Although the sex distribution of benign germ-cell tumors is about equal, there is a strong preponderance of males among patients with
malignant germ-cell tumors (123,124). A striking male predominance has been noted recently in a series of three reports from the Armed Forces Institute of Pathology (217,218,219). Of 322 patients with primary mediastinal germ-cell tumors in this study, 320 were men, including all 120 patients with mediastinal seminomas and all 64 cases with yolk sac tumors, embryonal carcinomas, and nonteratomatous germ-cell tumors of the mediastinum, respectively.
malignant germ-cell tumors (123,124). A striking male predominance has been noted recently in a series of three reports from the Armed Forces Institute of Pathology (217,218,219). Of 322 patients with primary mediastinal germ-cell tumors in this study, 320 were men, including all 120 patients with mediastinal seminomas and all 64 cases with yolk sac tumors, embryonal carcinomas, and nonteratomatous germ-cell tumors of the mediastinum, respectively.
Table 4-11 Germ-Cell Tumors | |
|---|---|
|
Among patients with malignant tumors, seminoma is most common, representing between 30% and 40% of cases (104), with embryonal carcinoma and malignant teratoma each responsible for about 10% and choriocarcinoma and endodermal sinus tumor responsible for about 5% each; the remainder of malignancies, approximately 40% of cases, represent mixed tumors (124,220).
Benign tumors are often asymptomatic, whereas malignant tumors are more likely to cause symptoms (123). Confirmation that these lesions are primary to the mediastinum requires that there be no evidence of a testicular or retroperitoneal tumor. Although of some value in diagnosis, the primary role of CT in evaluating patients with malignant germ-cell tumors is defining disease extent and monitoring response to therapy.
Teratoma
Teratomas contain elements of all germinal layers. They are classified as mature, immature, and malignant (Table 4-12) (104). Mature teratomas account for the vast majority of cases and represent between 60% and 70% of all mediastinal germ-cell tumors (104). They are composed of well-differentiated benign tissue, with ectodermal elements such as skin and hair predominating.
Mature cystic teratoma, often referred to as dermoid cyst, is a cystic tumor composed of well-differentiated elements from at least two of the three germ-cell layers (ectoderm, mesoderm, and endoderm). Ectodermal tissues may be represented by skin, teeth, and hair; mesodermal tissues by bone, cartilage, and muscle; and endodermal tissues by bronchial and gastrointestinal epithelium or pancreatic tissue.
Table 4-12 Teratoma | |
|---|---|
|
Immature teratomas contain less well developed tissues more typical of those present during fetal development; in infancy or early childhood, these tumors often have a benign course, whereas in adults they usually behave in an aggressive and malignant fashion (123). Malignant teratomas contain frankly malignant tissues and have a very poor prognosis; they are seen almost entirely in men.
Teratomas are usually found in the prevascular space, although it is important to realize that these lesions may occur in other locations in up to 20% of cases, including both the middle and posterior mediastinum as well as in multiple compartments (221,222,223,224,225). Regardless of their histology, CT often shows a combination of fluid-filled cysts, fat, soft tissue, and areas of calcification (Figs. 4-51, 4-52, 4-53, 4-54 and 4-55) (93,215,223,226,227,228). This pleomorphic appearance is an important clue to the diagnosis and often makes it possible to distinguish these lesions from thymoma and lymphoma (92,105). Calcification is seen in from 20% to 80% of cases (Figs. 4-51, 4-54, and 4-55), being focal, rimlike, or rarely representing teeth or bone (123). Fat is visible on CT in half of cases (Figs. 4-51, 4-52 and 4-53), a finding that is highly suggestive of this diagnosis. A fat-fluid level within the mass is diagnostic (229,230).
Mature cystic teratomas (dermoid cysts) are usually found in the anterior mediastinum (Figs. 4-53 and 4-54); they occasionally occur in the posterior mediastinum or lung. A large, predominantly cystic, anterior mediastinal mass with a thin and well-defined wall is highly suggestive of mature cystic teratoma (93). Most cystic teratomas are multilocular, but unilocular cystic lesions also occur.
Rarely, the mature cystic teratoma has an imperceptible wall (94).
Rarely, the mature cystic teratoma has an imperceptible wall (94).
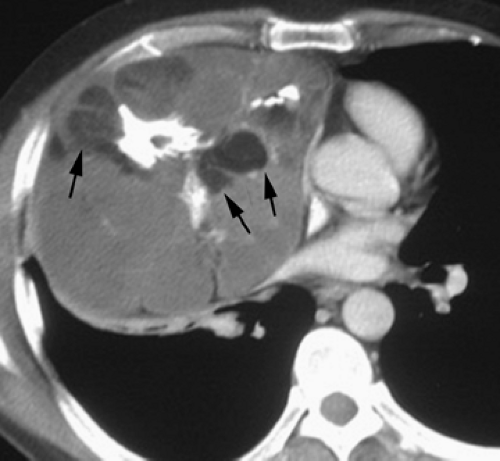 Figure 4-51 Mature teratoma. Enhanced CT in an adult with a mature teratoma. A large mass is visible, containing fat (arrows) and dense calcifications. The mass originates in the anterior mediastinum but extends posteriorly and displaces the heart to the left. |
Moeller et al. (223) reported findings in a total of 66 cases of mature teratoma located in the mediastinum. Although soft tissue attenuation was identified in virtually all cases, fluid was present in 88%, fat in 76%, and calcium in 53%. All these elements were present in the same lesion in 39%, whereas the combination of soft tissue, fluid, and fat was seen in 24%. Importantly, nonspecific cystic lesions without fat or calcium were seen in a total of 15% of cases.
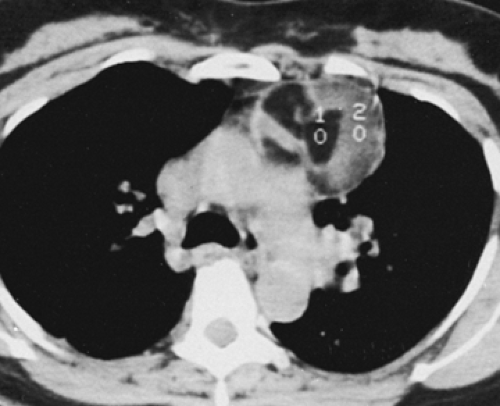 Figure 4-52 Teratoma. CT section through the carina shows a well-encapsulated mass anterior to the left pulmonary artery, within which fat elements are clearly discernible. This was confirmed by measurements obtained within the region of interest demarcated by cursor number 1. The remainder of the lesion was composed of soft tissue elements. |
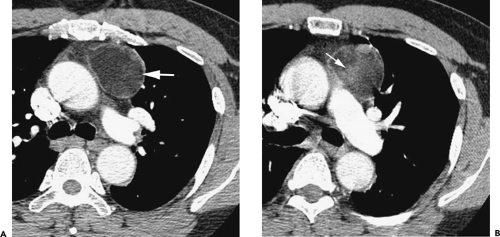 Figure 4-53 Mature teratoma. A: A sharply marginated anterior mediastinal mass with a well-defined wall (arrow) contains a large amount of fat. B: At a different level, some soft tissue attenuation (arrow) is seen within the fat. At surgery, the mass was cystic and contained both fat and white hair. |
Wu et al. (231) have reported the sonographic findings associated with 28 mediastinal teratomas. These findings
generally fall into three patterns. Most (18 of the 28) patients showed a complex mass of heterogeneous echogenicity; this pattern was associated with varying combinations of fat, sebaceous and mucinous materials, hair, and calcification. Eight patients showed a homogeneous hyperechoic mass; this correlated with the presence of hair and sebaceous material found on pathologic study. Two patients showed floating spherules within a cystic mass. These were composed of sebaceous material associated with fluid (231).
generally fall into three patterns. Most (18 of the 28) patients showed a complex mass of heterogeneous echogenicity; this pattern was associated with varying combinations of fat, sebaceous and mucinous materials, hair, and calcification. Eight patients showed a homogeneous hyperechoic mass; this correlated with the presence of hair and sebaceous material found on pathologic study. Two patients showed floating spherules within a cystic mass. These were composed of sebaceous material associated with fluid (231).
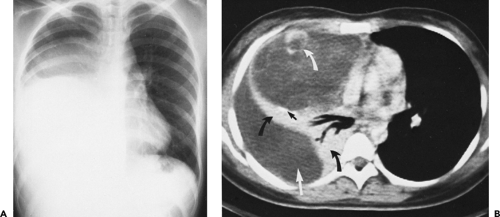 Figure 4-54 Mature cystic teratoma. A: Posteroanterior radiograph shows extensive opacification of the mid and lower right hemithorax in a teenage girl whose chief complaint was moderate dyspnea. The chest radiograph is nonspecific. B: Contrast-enhanced CT section through the midthorax shows a complex, cystic mass within which discrete septations can be recognized (curved white arrow), causing compression and posterior displacement of the adjacent lung (curved black arrows) as well as mediastinal shift to the left. Faint curvilinear calcifications can be identified posteriorly (straight black arrow). Although a pleural etiology was initially considered, the finding of multiple septations within this mass occurring in a young girl suggested the proper diagnosis. At surgery, the mass was found to extend posterior to the lung as well, accounting for the area of fluid density seen posteriorly (straight white arrow), otherwise mimicking the appearance of loculated pleural fluid. |
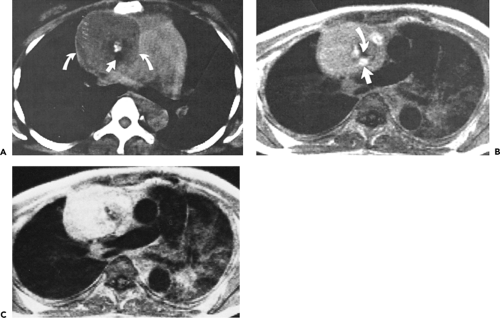 Figure 4-55 Teratoma: MRI findings. A: Unenhanced CT just below the carina shows a well-encapsulated mass anterior to the right main pulmonary artery (curved arrows). The mass is strikingly heterogeneous with fluid, fat (arrow), and calcific elements clearly discernible. B, C: T1- and T2-weighted MR images obtained at the same level as shown in A, respectively. On the T1-weighted image, regions of high signal intensity correspond precisely to the fatty elements seen in A (arrow in B), whereas regions corresponding to calcium demonstrate signal void (curved arrow in B). Intermediate signal is present within the remainder of the mass, in this case presumably secondary to complex fluid within the tumor. Note that there is considerable signal enhancement within these regions on the T2-weighted image, consistent with the presence of fluid within the tumor. (Case courtesy of Jeffrey Weinreb, MD, New Haven, Connecticut.) |
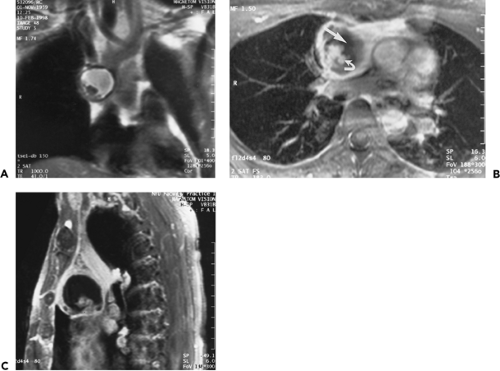 Figure 4-56 Teratoma: MR findings. A: Coronal non–breath-hold, ECG-gated proton density, fast spin-echo [100/43/150 (TR/TE/flip angle)] image performed in phased-array coil demonstrates a complex cystic anterior mediastinal mass. B, C: Axial and sagittal breath-hold, fat-suppressed T1-weighted gradient-echo [183/4/80 (TR/TE/Flip angle)] images, respectively, performed in the body phased-array coil, after the administration of gadolinium, demonstrate an irregular, thick-walled cystic anterior mediastinal mass with both fluidlike (arrow in B) and nodular components (curved arrow in B). |
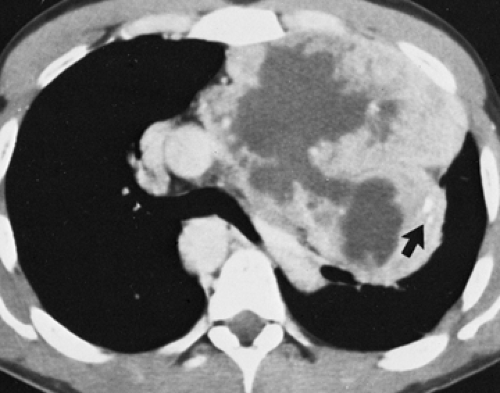 Figure 4-57 Malignant teratoma. Contrast-enhanced CT scan through the carina shows a large, poorly demarcated tumor within the anterior mediastinum causing compression and displacement of adjacent mediastinal structures. The tumor is markedly heterogeneous with areas of low density, presumably caused by extensive tissue necrosis, as well as some punctate areas of calcification (arrow). These findings suggest a malignant etiology. |
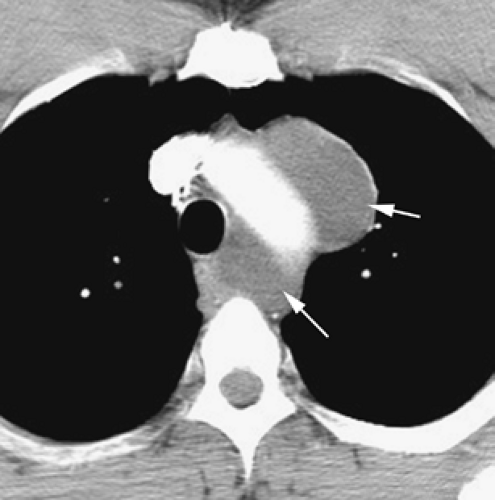 Figure 4-58 Mediastinal growing teratoma syndrome. An enlarging multicystic mass (arrows) was visible in a patient previously treated for embryonal carcinoma that contained elements of teratoma and was metastatic to the mediastinum. Surgery showed mature cystic teratoma. |
Mature teratomas are predisposed to rupture. This has been reported in as many as a third of cases (232). This phenomenon has been attributed to the presence of digestive enzymes secreted by pancreatic or intestinal mucosa within these tumors, leading to rupture into adjacent structures including bronchi, pleura, lung, and even the pericardium. Rarely, a fat-fluid level may be identifiable within a pleural effusion caused by rupture of the primary tumor into the pleural space (233). The fluids within the cystic parts of the tumors also vary in their CT density and may reach soft tissue density. Teratomas are typically encapsulated and well demarcated; rim enhancement can be seen.
MRI can show various appearances, depending on the composition of the tumor (Figs. 4-55 and 4-56) (92,115). They commonly contain fat, which is intense on T1-weighted images, and cystic areas, which are low in intensity on T1-weighted images, but increase with T2 weighting.
Malignant teratoma typically appears nodular or poorly defined, and the tumor molds and compresses surrounding structures (Fig. 4-57), whereas benign teratomas are well defined and smooth (228). Malignant teratomas are more likely to appear solid and less often contain fat (40%) than benign lesions (123), but they can be cystic as well. Following contrast infusion, malignant teratoma can show a thick enhancing capsule (123,214).
An unusual phenomenon associated with the treatment of malignant teratoma or seminoma has been reported; this is the so-called mediastinal growing teratoma syndrome (234). Teratomas and other germ-cell tumors may be mixed, with a combination of malignant and benign tissues being present. Benign parts of the tumor can continue to grow after therapy, despite sterilization of malignant elements of the tumor (Fig. 4-58). Surgery may be required if growth is sufficient to impinge on adjacent mediastinal organs or if the diagnosis is in doubt.
Seminoma
Seminoma occurs almost entirely in men, with a mean age at presentation of 29 years (Table 4-13) (235). They represent 40% of malignant germ-cell tumors of single histology (104). Approximately 10% with pure seminoma have evidence of elevated b-human chorionic gonadotropin (HCG) levels, but never elevated a-fetoprotein (AFP) levels. Presenting symptoms include dyspnea (25%), chest pain (23%), cough (17%), fever (13%), weight loss (11%), superior vena cava syndrome (6%), or fatigue and weakness (6%) (236).
Typically, primary mediastinal seminoma appears as a large, smooth or lobulated, homogeneous soft tissue mass, although small areas of low attenuation can be seen (Fig. 4-59) (92,123,214,215,227,228,237). Obliteration of fat planes is common, and pleural or pericardial effusion may be present, although direct invasion of adjacent structures has been reported to be rare (104,214).
Table 4-13 Seminoma | |
|---|---|
|
Seminomas are very sensitive to both radiation and chemotherapy, although chemotherapy is associated with a better survival and is generally preferred (236). Surgical resection may be performed in patients with a residual mediastinal mass, although the likelihood of viable tumor is low (236). Residual mediastinal mass may also reflect the presence of associated mature teratoma. Long-term survival may be anticipated in up to 80% to 90% of cases (104,236).
Nonseminomatous Germ-Cell Tumors
Nonseminomatous tumors, including embryonal carcinoma, endodermal sinus (yolk sac) tumor, choriocarcinoma, and mixed types, are often grouped together because of their similar appearance and aggressive behavior (Table 4-14) (123,214,215,227,228,238,239,240). As a group, nonseminomatous tumors are more common than seminoma; in a recent study of mediastinal germ-cell tumors, 86% were nonseminomatous and 14% were seminomas (236). An association with Klinefelter syndrome has been reported in as many as 18% of patients (104), but in a recent review of 286 mediastinal nonseminomatous tumors, only 3 (1%) had Klinefelter syndrome.
On CT, these tumors usually show heterogeneous opacity, including ill-defined areas of low attenuation secondary
to necrosis and hemorrhage or cystic areas (123,214,238) (Fig. 4-60). They often appear infiltrative, with obliteration of fat planes, and may be spiculated. Calcification may be seen. MRI findings also reflect the inhomogeneous nature of these lesions (Fig. 4-61).
to necrosis and hemorrhage or cystic areas (123,214,238) (Fig. 4-60). They often appear infiltrative, with obliteration of fat planes, and may be spiculated. Calcification may be seen. MRI findings also reflect the inhomogeneous nature of these lesions (Fig. 4-61).
Table 4-14 Nonseminomatous Germ-Cell Tumors | |
|---|---|
|
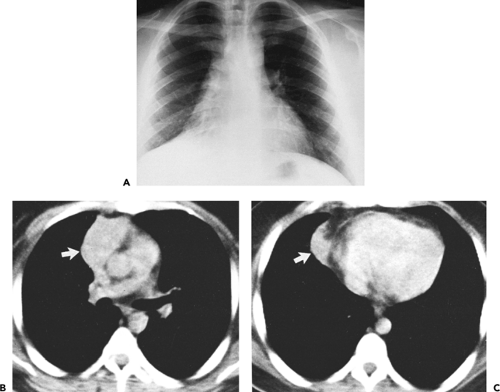 Figure 4-59 Seminoma. A: Posteroanterior chest radiograph in a 35-year-old man shows poor definition of the right heart border and elevation of the right hemidiaphragm, findings initially thought to be secondary to middle lobe volume loss. B, C: Contrast-enhanced CT sections through the mid and lower thorax, respectively, show a homogeneous soft tissue mass to be present in the anterior mediastinum (arrows in B and C), marginating the right heart border. This appearance is entirely nonspecific. At surgery, this proved to be a seminoma. |
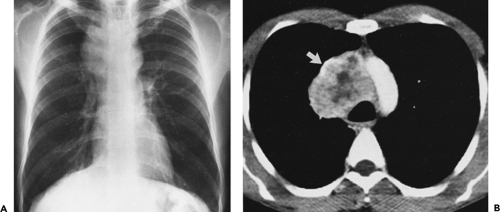 Figure 4-60 Nonseminomatous germ-cell tumor. A: Posteroanterior chest radiograph shows a mediastinal mass deforming the right pleuromediastinal interface. B: Contrast-enhanced CT section at the level of the aortic arch shows an irregular, heterogeneous tumor mass that is partially obstructing the superior vena cava (arrow). Although most germ-cell tumors arise in the prevascular or anterior mediastinal compartment, these tumors may originate anywhere within the thorax. Surgery confirmed a nonseminomatous malignant germ-cell tumor. |
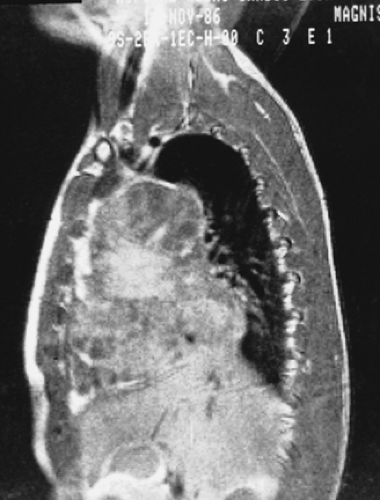 Figure 4-61 MR of nonseminomatous germ-cell tumor: embryonal carcinoma. T1-weighted sagittal image (TR 600 msec; TE 28 msec) shows a large inhomogeneous mass with areas of both high and low signal intensity. Low-intensity regions are likely cystic, whereas high-intensity regions may represent hemorrhage. |
It is worth emphasizing that over the past decade there has been a remarkable improvement in the therapy of nonseminomatous mediastinal germ-cell tumors. With the introduction of cisplatin-based chemotherapeutic regimens, the likelihood of long-term survival has risen from 3%–10% to 45%–80% (234,236). Surgery is reserved for those patients with radiologic evidence of persistent masses and may improve survival (236). In one study, nearly half of patients with mediastinal nonseminoma had resection of residual masses, which represented viable tumor in more than 30%. As with seminoma, teratoma may be responsible for residual mass in some patients; mature teratoma was responsible for the residual mass in 26% of cases in a study by Bokemeyer et al. (236).
Thyroid Gland
Usually, diseases of the thyroid gland are evaluated using radionuclide scintigraphy or ultrasonography, with needle aspiration biopsy performed as indicated (241,242). CT has generally been reserved for evaluation of patients with suspected intrathoracic extension of thyroid abnormalities. Although intrathoracic extension occurs in only a few percent of patients with thyroid disease, in some series it represents nearly 10% of mediastinal masses resected at thoracotomy (242,243,244). Intrathoracic thyroid masses nearly always represent direct contiguous growth into the mediastinum of a goiter or other thyroid lesion. They are almost always connected to the thyroid gland, even though radionuclide studies may suggest that the mass is separated from the thyroid (96,245). Truly ectopic mediastinal thyroid tissue in the mediastinum is rare. The differential diagnosis of intrathoracic thyroid lesions includes goiter, thyroid enlargement associated with thyroiditis, and thyroid carcinoma,
Mediastinal involvement by thyroid masses is most often anterior (96). In 80% of cases, an enlarged thyroid extends into the thyropericardiac space anterior to the recurrent laryngeal nerve and the subclavian and innominate vessels. Posterior mediastinal goiters constitute approximately 10% to 25% of cases (96,245). Posteriorly located goiters typically arise from the posterolateral portion of the gland and descend behind the brachiocephalic vessels; they are most commonly found on the right side in close proximity to the trachea and bounded inferiorly by the arch of the azygos vein (245). Less often, thyroid tissue may either extend between the esophagus and trachea or even come to lie posterior to the esophagus (245).
Computed Tomography Evaluation of Thyroid Disease
The CT appearances of both normal and abnormal thyroid gland have been extensively reviewed (96,242,243,244,246,247,248,249,250,251,252,253,254,255,256). The appearance of normal thyroid tissue is characteristic. On precontrast scans, thyroid tissue is high in attenuation, relative to adjacent soft tissues, because of its high iodine content; thus, it is easily identified (243,249). Attenuation values of normal thyroid tissue average 112±10 HU. Thyroid attenuation measures 57±11 HU in patients with chronic thyroiditis, and in hypothyroid patients, thyroid attenuation is only slightly greater than soft tissue. Thyroid tissue typically enhances 25 HU or more following intravenous administration of contrast, depending on the rapidity of contrast infusion (Fig. 4-62A) (249).
Recognizing that a mediastinal mass originates from the thyroid gland on CT is contingent on the following observations: (a) demonstration of a communication with the cervical portion of the thyroid gland when contiguous sections are extended to include the neck (Fig. 4-62); (b) high attenuation of at least of portion of the mass; (c) marked enhancement after contrast medium injection, sometimes to the point of simulating a vascular lesion; and (d) prolonged contrast enhancement (243) presumably caused by the thyroid actively trapping iodine contained in the contrast medium.
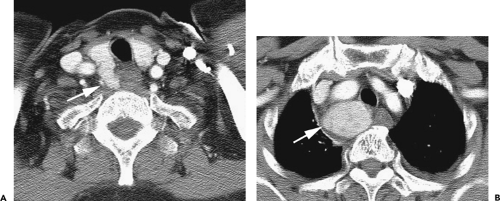 Figure 4-62 Thyroid gland and mediastinal goiter. A: The cervical thyroid gland is densely enhanced following contrast administration. A portion of the right thyroid lobe (arrow) extends posteriorly and is contiguous with the mediastinal goiter shown in B. B: An enhancing heterogeneous mass (arrow) is present posterior and lateral to the trachea, representing a goiter. |
Generally speaking, the CT appearance of intrathoracic thyroid masses is nonspecific. Mediastinal thyroid masses commonly appear inhomogeneous and cystic on CT regardless of their cause (Figs. 4-62, 4-63, 4-64, 4-65 and 4-66). Although the appearance of low-density cystic areas shown on CT correlates with areas of decreased isotope uptake on radionuclide studies, this appearance is nonspecific. Limitations in histologic specificity have been noted when CT is compared with high-resolution sonography (252,253,254,255,256). Curvilinear, punctate, or ringlike calcifications can also be seen in both benign and malignant lesions (Fig. 4-65); fat has not been reported in thyroid masses and its presence can help in distinguishing a teratoma or dermoid cyst from a thyroid lesion (257). CT is of greatest value in defining the morphologic extent of a thyroid mass and its relation to other structures (Figs. 4-62, 4-63, 4-64 and 4-65). Marked irregularity of the gland contour, loss of distinct mediastinal fascial planes, and/or the presence of cervical or mediastinal adenopathy
should signal potential malignancy (Fig. 4-66). However, carcinomas may also be sharply marginated.
should signal potential malignancy (Fig. 4-66). However, carcinomas may also be sharply marginated.
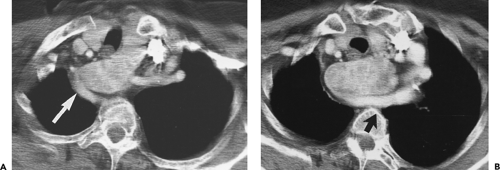 Figure 4-63 Posterior mediastinal goiter. A, B: Sequential CT sections at the level of the great vessels shows a well-defined, inhomogeneous mass posterior to the trachea and esophagus, which are displaced anteriorly. Note that in this case, thyroid tissue is limited posteriorly by an aberrant left subclavian artery (arrows). |
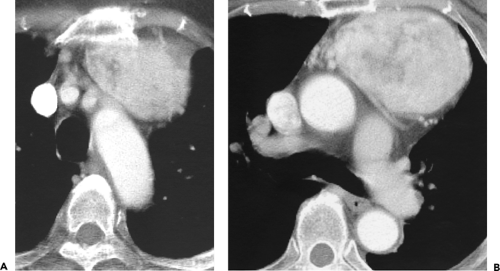 Figure 4-64 Anterior mediastinal goiter. A, B: Large, inhomogeneous anterior mediastinal mass is visible on both sections following contrast enhancement, with areas of low attenuation consistent with the presence of colloid cysts. At higher levels, the mass was contiguous with the inferior aspect of the thyroid gland (not shown). |
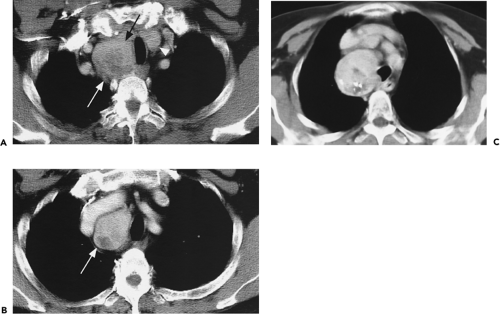 Figure 4-65 Middle mediastinal goiter. A: CT section through the great vessels immediately following contrast administration shows the right lobe of the thyroid gland (arrows) to be markedly enlarged and cystic in appearance. The left lobe of the thyroid (arrowhead) is slightly prominent. B: Several seconds later, CT section at a slightly lower level than in A. There is inhomogeneous enhancement within the goiter (arrow), which is still clearly distinct from adjacent mediastinal vessels. Note that in this case the mass lies in the pretracheal space (middle mediastinum), posterior to the great vessels. C: CT section in a different patient from the one in A or B also shows a heterogeneous substernal thyroid gland extending along the right side of the trachea. Note the presence of coarse punctate calcifications within the thyroid, a common finding in goiters. |
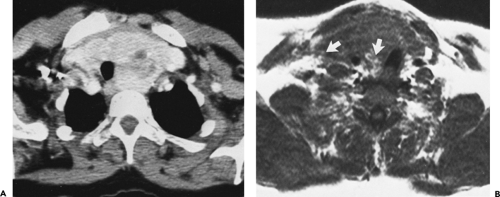 Figure 4-66 Thyroid cancer. A: Contrast-enhanced CT section at the level of the thoracic inlet. Thyroid tissue is easily identifiable because of marked contrast enhancement that is characteristic following intravenous administration of contrast. Within the thyroid, areas of low tissue attenuation and foci of calcification can be identified. Although the thyroid is markedly enlarged, causing the trachea to deviate to the right, the outlines of the thyroid are still identifiable. Biopsy proved follicular carcinoma of the thyroid. B: T1-weighted MRI section in a patient different from the one in A. The thyroid is markedly enlarged and is poorly marginated, causing loss of visualization of normally discrete fascial planes (arrows). Note that with T1 weighting the thyroid appears relatively homogeneous. Biopsy proved follicular carcinoma of the thyroid. |
CT plays an especially important role in the preoperative assessment of substernal goiters (96). It has been shown that the surgical approach to these lesions depends on precise anatomic localization. Intrathoracic goiters should be removed for symptomatic relief as well as to reduce the risk consequent to acute hemorrhage or inflammation. Although anterior substernal goiters usually can be removed through a routine cervical incision, posterior mediastinal goiters require a selective approach. In these cases, a decision as to the need for a thoracotomy or a combined cervicothoracic incision generally depends on the size of the lesion or whether or not the mass is mainly intrathoracic without a significant cervical component (245).
Magnetic Resonance Evaluation of Thyroid Disease
MRI is useful in evaluating thyroid masses (242,258,259,260). Characteristically, on T1-weighted images, the signal intensity of the normal thyroid is equal to or slightly greater than that seen in the adjacent sternocleidomastoid muscle; on T2-weighted scans or on T1-weighted gadolinium-enhanced images, the signal intensity of the thyroid gland is significantly greater (Fig. 4-67) (261,262,263). Most focal pathologic processes, including adenomas, cysts, and cancer, are easily identified on T2-weighted images because of their markedly prolonged T2 values or on enhanced sequences. Functioning thyroid nodules, however, are an exception; these have been reported to be isointense with normal thyroid tissue on both T1- and T2-weighted scans (264).
Multinodular goiters are relatively hypointense as compared with normal thyroid tissue on T1-weighted images, except when there are foci of either hemorrhage or cysts, in which case focal areas of high signal intensity may be visualized (Figs. 4-68 and 4-69). They generally remain more intense than muscle. On T2-weighted images, multinodular goiters are typically heterogeneous, with high signal intensity noted throughout most of the gland (Figs. 4-68 and 4-69) (261,262,264,265,266,267). Although it has been suggested that benign adenomas can be differentiated from follicular carcinomas based on the presence of an intact pseudocapsule surrounding adenomas, this finding has been insufficiently documented (261,268). In most series, MRI has proven no more specific histologically than CT (259,262,263,264,265,267).
In patients with Graves disease, Noma et al. (261) have noted typical morphologic features, including the presence of numerous coarse, bandlike structures traversing the thyroid gland and dilated vascular structures within the thyroid parenchyma. Also, in patients with Graves disease, MRI has the capability to provide physiologic insight into the functional status of the thyroid gland (269). Typically, patients with Graves disease have moderate to marked increased signal intensity on studies performed
with both short and long TRs. Significantly, in these patients, there is a linear relationship between the thyroid-muscle signal intensity contrast ratio and both the serum thyroxine (T4) level and the 24-hour radioactive iodine uptake. Furthermore, these changes have been shown to normalize following therapy (269). Descriptions of the thyroid gland in patients with Hashimoto thyroiditis have also been published. Although this disorder is characterized by diffuse enlargement, no distinct pattern has been identified with MRI (261).
with both short and long TRs. Significantly, in these patients, there is a linear relationship between the thyroid-muscle signal intensity contrast ratio and both the serum thyroxine (T4) level and the 24-hour radioactive iodine uptake. Furthermore, these changes have been shown to normalize following therapy (269). Descriptions of the thyroid gland in patients with Hashimoto thyroiditis have also been published. Although this disorder is characterized by diffuse enlargement, no distinct pattern has been identified with MRI (261).
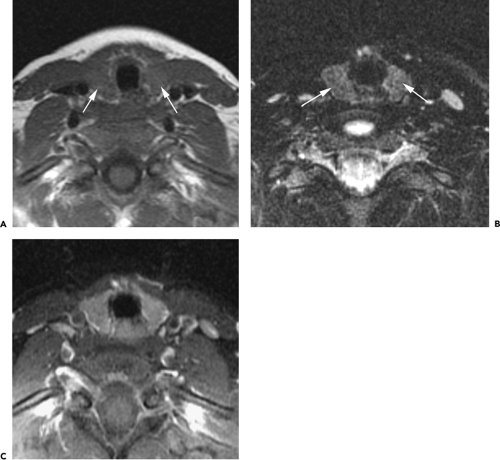 Figure 4-67 Normal thyroid gland: MR assessment. A: T1-weighted. B: T2-weighted fat saturated. C: Gadolinium-enhanced, T1-weighted, fat saturated. On T1-weighted images the signal intensity in the normal gland is equal to or slightly greater than is seen in adjacent muscles (arrows in A). Note that the signal intensity of the thyroid is significantly greater with T2 weighting (arrows in B) and following enhancement (C). |
MRI has been shown to be a sensitive means of defining the extent of thyroid enlargement (Figs. 4-69 and 4-70). This includes the presence of associated abnormalities such as cervical and/or mediastinal adenopathy; displacement of mediastinal structures such as the esophagus, trachea, and great vessels; and loss of normal cervical and intrathoracic fascial planes (261,262,263,264,265,266,267,268,270,271,272). Unfortunately, MRI has proven of only limited value as a means for tissue characterization.
A potential role for MRI in the evaluation of patients following surgery has also been proposed (264,273). In one series of 24 patients with primary thyroid carcinoma evaluated postoperatively with MRI, MRI correctly diagnosed or excluded disease in 20 patients. However, MRI provided a false-positive diagnosis in one case and a false-negative diagnosis in three cases (273).
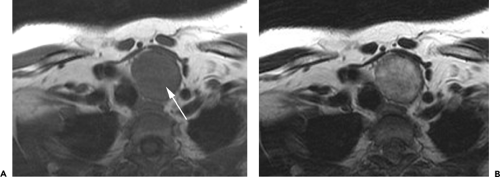 Figure 4-68 Goiter: MR evaluation. A: T1-weighted MR image at the thoracic inlet shows typical appearance of a goiter. Note that the enlarged left thyroid lobe (arrow) is easily identified, separate from adjacent mediastinal fat and vessels, displacing the trachea to the right. It appears slightly more intense than adjacent muscle. B: T2-weighted MR image. There is considerable increase in signal intensity within the goiter, which appears heterogeneous. On T2-weighted images, multinodular goiters are typically heterogeneous, with high signal intensity identifiable throughout the gland. |
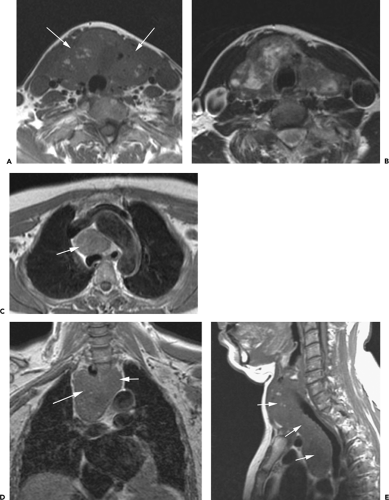 Figure 4-69 Substernal goiter, MR evaluation. A: T1-weighted image through the neck shows a large mass (arrows), containing some areas of high intensity, which may represent hemorrhage. The mass is similar to muscle in intensity. B: T2-weighted image near the same level shows the mass to be heterogeneous in intensity and brighter than muscle. C: T1-weighted image through the mediastinum at the level of the aortic arch shows the goiter to extend into the pretracheal space (arrow). D: T1-weighted coronal image shows the goiter (arrows). E: T1-weighted coronal image shows the goiter (arrows) lying anterior to the trachea and extending from the neck into the superior mediastinum. The trachea is displaced posteriorly. |
Parathyroid Glands
Ninety percent of parathyroid glands are located near the thyroid gland. Although four glands are usually present, their precise localization and number are variable. The upper pair is typically located dorsal to the superior poles of the thyroid gland, whereas the lower pair lies just below the lower thyroid poles, in the region of the minor neurovascular bundle. The lower pair of glands is most variable in location. Most parathyroid adenomas are found in the lower group of parathyroid glands.
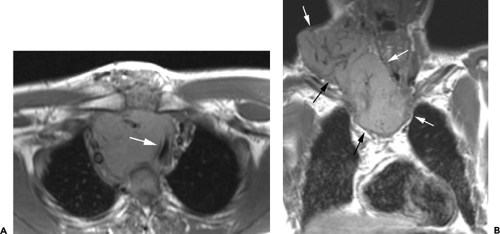 Figure 4-70 Substernal thyroid carcinoma, MR evaluation. A: T1-weighted image through the upper mediastinum shows a large mass, which displaces and narrows the trachea (arrow). The mass is slightly more intense than muscle. B: T1-weighted coronal image shows the extensive tumor involving the right neck and mediastinum (arrows). |
Approximately 10% of parathyroid glands are ectopic (Table 4-15). In one study, 62% of the ectopic glands were located in the anterior mediastinum, 30% were embedded within thyroid tissue, and 8% were found in the posterior-superior mediastinum, in the region of the tracheoesophageal groove (274). In a study of ectopic parathyroid tumors in the mediastinum, 81% were in the anterior mediastinum and 19% were in the posterior mediastinum (275); in another study, ectopic mediastinal glands were most often within the thymus or in the paraesophageal regions (276). Anterior mediastinal parathyroid glands are
thought to result from islands of parathyroid tissue that are carried into the anterior mediastinum by the descending thymus during embryologic development. Anterior mediastinal parathyroid adenomas are intimately connected with the thymus.
thought to result from islands of parathyroid tissue that are carried into the anterior mediastinum by the descending thymus during embryologic development. Anterior mediastinal parathyroid adenomas are intimately connected with the thymus.
Table 4-15 Mediastinal Parathyroid Mass | |
|---|---|
|
Primary hyperparathyroidism results from a solitary adenoma in approximately 85% of cases. Other causes include diffuse hyperplasia (10%), multiple adenomas (5%), and rarely, carcinoma (1%) (263). Various studies are available for detecting parathyroid disease. These include high-resolution ultrasonography, radionuclide imaging using thallium or sestamibi, high-resolution contrast-enhanced CT, MRI, and selective venous catheterization (242).
Computed Tomography Evaluation of Parathyroid Disease
The CT appearance of parathyroid adenomas has been well described (277,278,279,280,281,282,283,284,285,286,287,288,289,290,291,292). Normal glands cannot be identified on CT. Parathyroid adenomas and hyperplastic glands are usually small but vary in size from 0.3 to 3 cm; rarely are they large enough to be detected on plain radiographs. When visible on CT, they usually appear homogeneous in density. Adenomas having their vascular supply compromised at surgery may appear cystic (287,288,292). Rarely, parathyroid adenomas appear calcified (289).
No CT criteria reliably differentiate an adenoma from hyperplasia or carcinoma. In the anterior mediastinum parathyroid lesions are usually found in the expected location of the thymus and may be indistinguishable from small thymic remnants, small thymomas, or small lymph nodes. An important potential source of error is to mistake a parathyroid adenoma for a thyroid adenoma (253,292). An association between thyroid and parathyroid disease is well known; as many as 30% of patients with parathyroid disease prove to have synchronous thyroid abnormalities. In a review of 65 patients in whom parathyroid surgery was performed for primary hyperparathyroidism, Stark et al. (253) found that 40% of these patients had nonpalpable thyroid nodules detected either by CT or high-resolution sonography.
The ability of CT to detect parathyroid abnormalities is clearly related to scan technique. Utilizing contiguous 5-mm sections from the hyoid bone to the carina, prospectively reconstructed with small fields of view, a 512 matrix, and maximum contrast enhancement using 50 g of iodine injected through a power injector, Cates et al. (292) documented that CT correctly identified parathyroid adenomas preoperatively in 81% of patients, although somewhat lower sensitivities have been reported by others (293). The accuracy of CT compares favorably with reported sensitivities of both high-resolution ultrasonography and thallium radionuclide imaging (290,291,294). However, CT obtained with substandard technique has a much lower accuracy (281). It should be emphasized that in patients with primary hyperparathyroidism, surgical neck exploration with resection of parathyroid tissues is curative in about 90% to 95% of cases (11,295). As a consequence, in most institutions, no imaging is done prior to surgery. However, the persistence of hyperparathyroidism following surgical resection of the cervical glands suggests the presence of an ectopic parathyroid adenoma or hyperfunctioning gland. Almost 50% of these patients will have mediastinal parathyroid glands; two thirds of these glands will be located in the superior mediastinum, particularly in the posterior aspect near the tracheoesophageal groove (285), and one third will be in the lower anterior mediastinum, often in relation to the thymus, although a wide variety of locations can be seen (276). Parathyroid adenomas in the APW are rare, but their appearance has recently been described (97). In a review of 285 consecutive patients treated surgically for hyperparathyroidism, mediastinal parathyroid tumors were present in 22% and were present in 38% of the patients requiring reoperation for persistent or recurrent hyperparathyroidism (275). Preoperative localization has also been advocated for patients at a high risk for surgery (293).
Reports comparing the accuracy of CT to competing modalities in postoperative patients vary significantly (281). Miller et al. (294) compared sonography, thallium scintigraphy, CT, and MRI in 53 postoperative patients and found that no technique detected more than 50% of abnormal glands. Similar results have been reported by others, including false-positive rates of nearly 20%. However, in a recent study (97), CT obtained with 5-mm collimation during the infusion of contrast material was positive in eight (89%) of nine patients with a parathyroid adenoma in the APW, whereas MRI was positive in 63%, arteriography was positive in 56%, and sestamibi radionuclide images were positive in all six patients in whom they were obtained. Also, higher accuracy rates have recently been reported for MRI and sestamibi scintigraphy (293,296,297).
Magnetic Resonance Evaluation of Parathyroid Disease
The appearance of abnormal parathyroid glands on MRI has been well documented (263,265,266,270,271,276,294,298,299,300,301,302,303,304,305,306). Similar to thyroid adenomas, most parathyroid adenomas appear intense on T2-weighted images (Fig. 4-71), increasing significantly in intensity as compared with T1-weighted images (Fig. 4-72). Similar findings have been documented for parathyroid hyperplasia and carcinomas. In a small but significant percentage of cases, parathyroid adenomas fail to show increased signal intensity with T2 weighting. As shown by Auffermann et al. (303), in a study of 30 patients with recurrent hyperparathyroidism, 13% of the abnormal glands failed to display high intensity on T2-weighted images. Enhancement following gadolinium infusion is typical, and fat suppression images can be valuable in demonstrating parathyroid adenomas (260,305,306).
Stay updated, free articles. Join our Telegram channel

Full access? Get Clinical Tree


