LEARNING OBJECTIVES
Learning Objectives
The student will be able to define and derive the six standard erythrocyte indices as evaluated in a complete blood count.
The student will be able to calculate dissolved and bound O2 contents of blood when given data for its Po2, percent oxygenation, and hemoglobin concentration ([Hb]).
The student will be able to identify basic features of an HbO2 dissociation curve including its P50, and the effects of pH, Pco2, [2,3-DPG], temperature, carbon monoxide, and common genetic changes on the P50.
The student will be able to describe the major mechanisms by which erythrocytes promote CO2 transport, and estimate the compartment sizes of CO2 carried in dissolved, Hb-bound, or dissociated states.
The major function of erythrocytes or red blood cells (RBCs) is transport of the respiratory pigment hemoglobin (Hb). In their mature form, erythrocytes are biconcave discs 7-8 μm in diameter, with thickness of 0.5-2.0 μm, and an average volume of 80-90 μm3 or fL. Whole blood contains large numbers of RBCs, typically 4.5-6.0 × 10⁶/μL. Although living cells, mature erythrocytes are anucleate and contain few organelles. During a typical functional life span of 120 days, each RBC may travel 1,000 km from synthesis in the marrow until destruction in liver, spleen, or other site. Factors that regulate RBC production and longevity are beyond the scope of this book, except as they influence O2 and CO2 movements across alveolar septa and into blood vessels that originate in the right ventricle and traverse the lungs before returning to the left ventricle.
THE SIX STANDARD ERYTHROCYTE INDICES
As part of a complete blood count (CBC) done on each hospital admission, the following three indices are routinely measured on a patient’s RBCs:
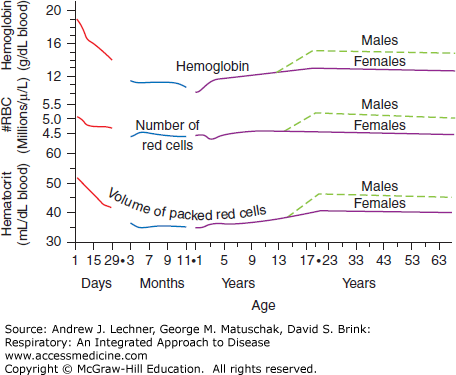
Hematocrit—the fraction of whole blood that is composed of erythrocytes, most commonly expressed in percent. Historically, blood was placed in glass capillary tubes and centrifuged until the erythrocytes sedimented together at the bottom, with a “buffy coat” of leukocytes and platelets above them, and clear, amber-colored plasma on top. Normal values for hematocrit (Hct) vary with age and sex over predictable ranges (Fig. 3.1).
Hemoglobin Concentration—the quantity of hemoglobin (Hb) per unit of blood, usually expressed as g/dL or simply g%. Historically, hemoglobin concentration ([Hb]) was determined by diluting whole blood with potassium ferricyanide to lyse the RBCs and oxidize ferrous ions (Fe2+) to ferric ions (Fe3+), thus converting normal Hb into methemoglobin (metHb) that cannot bind O2. MetHb combines with cyanide ions to form a quantifiable color product, cyanomethemoglobin. [Hb] also varies with age and sex (Fig. 3.1).
Red Blood Cell Count—the density of erythrocytes in whole blood, typically reported as ×10 6/μL. Due to their great numbers and small size, whole blood is first diluted with 0.9% NaCl (normal saline). Historically, erythrocytes were counted manually by microscope on a calibrated glass slide (hemacytometer). Contemporary automated channel counters draw dilute red blood cell (RBC) suspensions through a narrow orifice, recording changes in saline conductivity between electrodes caused by passing erythrocytes. RBCs are both counted and sized in this way, yielding a histogram of diameters that is also reported as part of the CBC (Fig. 3.1).
These measured results for Hct, [Hb], and the number of RBCs from a patient’s CBC are then used to calculate three additional derived indices that describe various features of an average erythrocyte and establish useful normal ranges for each:
Mean Cell Volume—the average volume of an erythrocyte, reported in fL (10–15 L) or μm3 per RBC. Mean cell value (MCV) is computed by dividing the Hct of whole blood by the number of RBCs in that sample, with appropriate corrections made for differences in units. Among healthy adults, the Normal Range for MCV = 80-90 fL.
Mean Cell Hemoglobin Content—the average mass of Hb in an erythrocyte, reported in pg. Mean cell hemoglobin content (MCH) is computed by dividing the [Hb] of whole blood by the number of RBCs in the sample, again correcting for differences in units. Among healthy adults, the Normal Range for MCH = 25-30 pg.
Mean Cell Hemoglobin Concentration—the average [Hb] inside erythrocytes, properly reported as the g Hb/100 mL RBCs, or more conventionally just as a percent. Mean cell hemoglobin concentration (MCHC) is computed by dividing the [Hb] of a blood sample by its Hct, corrected as needed for differences in units. Among healthy adults, the Normal Range for MCHC = 32%-35%.
Based upon the CBC results for millions of presumably healthy adults, the erythrocyte dimensions mentioned above and the Hb content of typical mature RBC populations vary little with postnatal age. In other words, the calculated indices of MCV, MCH, and MCHC are remarkably constant across the broad population. Thus, most observed changes in a person’s Hct or [Hb] represent simple parallel variations in their number of RBC/μL, unless a specific genetic, biochemical, or physiological explanation is found.
ROLE OF ERYTHROCYTES IN OXYGEN TRANSPORT
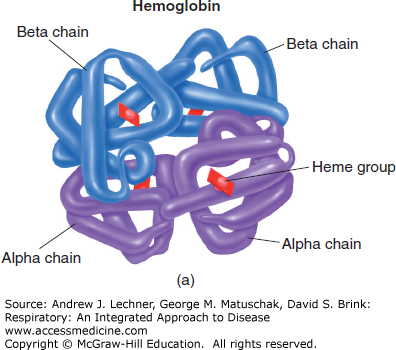
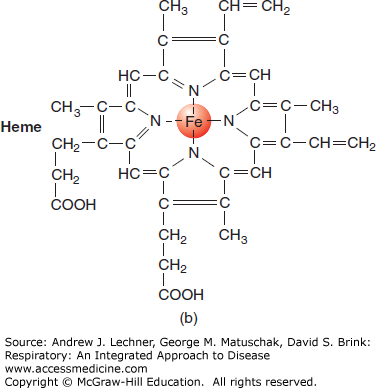
Tetrameric Hb contains four ferrous (Fe2+) atoms, each of which can reversibly combine with one molecule of O2 (Fig. 3.2). Under optimal conditions, one mole (M) of Hb can combine with 4 M of O2. With a molecular weight of 64,458 g, Hb can reversibly bind approximately 1.39 mL of O2/g Hb [derived from = (4) • (22.4 L O2/M O2)/(64,458 g/M Hb)]. This factor of 1.39 is used to compute the maximal O2 carrying capacity of a sample when its [Hb] is known, assuming 100% oxygenation.
What is the physiological significance of 1.39 mL O2/g Hb? Consider that at 37°C the maximal amount of dissolved O2 = 2.33 mL O2/dL blood/atm of pure O2 (1 atm = 760 mm Hg). At sea level and by Dalton’s law of partial pressures (Chap. 1), we know that the ambient Po2 in dry air = FIo2 • (barometric pressure, PB) = (0.209) • (760) = 160 mm Hg. Thus, one deciliter of blood containing 15 g Hb/dL and equilibrated with air at sea level would contain 0.5 mL dissolved O2 [= (2.33 mL O2/dL blood/atm Po2) • (160/760)], plus 20.8 mL O2 reversibly bound to Hb.
The total O2 content of any solution (including blood) depends upon the ambient Po2 acting as the driving pressure. For saline and plasma, dissolved O2 is proportional to ambient Po2: Plasma equilibrated with 2 atm of O2 contains twice as much dissolved O2 as plasma equilibrated with 1 atm of O2 at the same temperature. Respiratory pigments like Hb are different in two important ways. First, Hb binds and releases O2 in a nonlinear manner. Second, oxygenation of Hb is saturable, so that once maximized, any further elevations in ambient Po2 increase only the dissolved O2 fraction, which is both linear and nonsaturable under normal clinical conditions that are encountered.
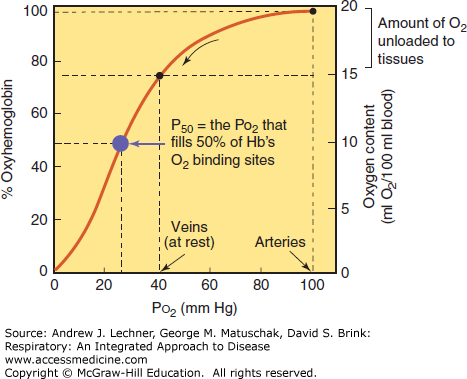
These phenomena are best studied by first equilibrating a blood sample to a gaseous environment containing no O2, causing its Hb to become completely deoxygenated (less correctly termed “desaturated” or “unsaturated”). A suitable gas for this purpose is 95% N2/5% CO2, which yields by Dalton’s law a clinically meaningful partial pressure of CO2 (Pco2) = 40 mm Hg. As we then increase the Po2 to which the blood is equilibrated (holding Pco2 at 40 mm Hg), its O2 content increases both in absolute terms (mL O2/dL blood) and as a percent of maximal Hb oxygenation. The resulting oxygen dissociation curve (ODC) for whole blood is sigmoidal (Fig. 3.3). When comparing the ODC within or across species, the Po2 required to half-oxygenate the blood is termed its P50, a bit of physiological shorthand that has gained wide acceptance.
The sigmoidal nature of the ODC is due to changes in the shape of Hb molecules that occur with their binding of sequential O2 molecules. Binding of the first O2
Stay updated, free articles. Join our Telegram channel

Full access? Get Clinical Tree


