Magnetic Resonance Imaging
Tal Geva
Andrew J. Powell
Since publication of the previous edition of this textbook, the field of cardiovascular magnetic resonance imaging (CMR) has continued to experience rapid evolution in technology and clinical applications. During the past decade, developments in hardware design, computer science, and imaging sequences have led to a marked expansion of the clinical utility of CMR in patients with congenital and acquired pediatric heart disease. CMR is rarely used as the first or the sole diagnostic imaging test. It complements echocardiography, provides a noninvasive alternative to x-ray angiography, and overcomes many of the limitations of these modalities. For example, in contrast to echocardiography, acoustic windows and body size do not limit CMR, and, unlike cardiac catheterization, CMR does not use ionizing radiation. In today’s clinical practice, CMR is increasingly used in concert with other imaging modalities (most commonly echocardiography) for assessment of cardiac anatomy and function, measurements of blood flow, tissue characterization, and, more recently, for evaluation of myocardial perfusion and viability. This chapter reviews common CMR techniques and discusses the clinical applications of CMR in patients with congenital and acquired pediatric heart disease.
Indication for Magnetic Resonance Imaging Evaluation of Congenital Heart Disease
The indications for CMR in patients with congenital heart disease (CHD) continue to expand. Given that CMR has been shown to provide helpful diagnostic information in most types of CHD, it is not practical to list individual anomalies in which the test is indicated. In general, the clinical reasons for a CMR examination fall into one or more of the following categories:
When transthoracic echocardiography cannot provide the required diagnostic information
When clinical assessment and other diagnostic tests are inconsistent
As an alternative to diagnostic cardiac catheterization with its associated risks and higher cost
To obtain diagnostic information for which CMR offers unique advantages
In clinical practice, CMR is typically ordered after other imaging studies have been performed and additional diagnostic information is required. Table 14.1 summarizes the primary referral diagnoses in 1,334 consecutive CMR examinations performed in 1,183 patients at Children’s Hospital Boston in 2003 to 2004 (1), illustrating the wide range of cardiovascular anomalies evaluated.
It is worth noting that the role of CMR in infants and toddlers is more limited than that in older patients. Because poor acoustic windows are less common in infants, echocardiography can provide the necessary diagnostic information in most patients, and CMR under sedation or anesthesia is reserved for those in whom additional information is necessary. A review of 99 consecutive CMR examinations in patients younger than 1 year of age during a 4-year period (January 1999 through December 2002) at Children’s Hospital Boston found that delineation of the thoracic vasculature was the most common indication (55%), followed by assessment of airways compression (25%) and evaluation of cardiac tumors (6%) (2). In the future, CMR will likely assume a greater role in this age group, primarily as an alternative to diagnostic cardiac catheterization. Examples of such scenarios include delineation of sources of pulmonary blood supply in tetralogy of Fallot (TOF) with pulmonary atresia and preoperative assessment of candidates for a bidirectional Glenn shunt.
Magnetic Resonance Imaging Techniques
Background
In MRI, magnetic fields and radiofrequency (RF) energy are used to stimulate nuclei in selected regions of the body to emit radio waves that are then processed to construct images. The primary source of signals used to construct MR images is derived from hydrogen protons (1H). The 1H protons can be thought of as tiny bar magnets that, when placed in a strong magnetic field, will align and precess (rotate) around the axis of the magnetic field. The highest concentrations of 1H protons are in water and fat. Through the use of a strong static magnetic field, much weaker but rapidly varying magnetic field gradients, and short pulses of RF energy, the 1H protons (also referred to as spins) in selected regions of the body are stimulated to emit RF waves. These RF waves are then used to construct MR images (Fig. 14.1). The strength of the static magnetic field in most clinical scanners used for CMR is either 1.5 or 3.0 Tesla (T) (1 Tesla = 10,000 gauss [G]; the strength of earth’s magnetic field at its surface is approximately 0.5 G).
As with any other diagnostic modality, an indepth knowledge of the underlying MRI physics is essential for maximizing its utility and understanding its pitfalls and limitations. This, in turn, enhances the quality of the interpretation of the imaging data. A detailed discussion of MRI physics is beyond the scope of this chapter and can be found in other sources (3,4). Selected imaging sequences commonly used in CMR are described together with their clinical applications later in this chapter.
Cardiac and Respiratory Gating
Because most CMR techniques acquire data over multiple heartbeats, cardiac and respiratory motions during image acquisition result in image blurring. Several techniques have been developed to overcome this problem. The most common approach to compensate for cardiac motion is to synchronize or “gate” image acquisition with the cardiac cycle. The cardiac cycle is tracked using either the electrocardiogram (ECG) or an optical pulse sensor placed on
an extremity (called “peripheral gating”) (Fig. 14.2). Electrocardiographic gating can be accomplished with a high-quality standard ECG trace or with a vectorcardiogram (VCG) signal (5). More recently, a new technique called “self-gating” which relies on cardiac motion and avoids the use of ECG triggering altogether has been described (6). Blurring due to respiratory motion can be avoided either by having the patient hold his breath for periods of 5 to 10 seconds during data acquisition, or by synchronizing image data acquisition to the respiratory as well as to the cardiac cycle. Another approach that reduces blurring from respiratory motion is to repeat the image acquisition several times and average the data. Respiratory motion can be tracked by either a bellows device placed around the abdomen or by an MR navigator pulse that concurrently tracks the position of the diaphragm or cardiac border (Fig. 14.3) (7).
an extremity (called “peripheral gating”) (Fig. 14.2). Electrocardiographic gating can be accomplished with a high-quality standard ECG trace or with a vectorcardiogram (VCG) signal (5). More recently, a new technique called “self-gating” which relies on cardiac motion and avoids the use of ECG triggering altogether has been described (6). Blurring due to respiratory motion can be avoided either by having the patient hold his breath for periods of 5 to 10 seconds during data acquisition, or by synchronizing image data acquisition to the respiratory as well as to the cardiac cycle. Another approach that reduces blurring from respiratory motion is to repeat the image acquisition several times and average the data. Respiratory motion can be tracked by either a bellows device placed around the abdomen or by an MR navigator pulse that concurrently tracks the position of the diaphragm or cardiac border (Fig. 14.3) (7).
TABLE 14.1 Primary Referral Diagnoses in 1,334 CMR Examinations at Children’s Hospital Boston | ||||||||||||||||||||||||||||||||||||||||||||||||
|---|---|---|---|---|---|---|---|---|---|---|---|---|---|---|---|---|---|---|---|---|---|---|---|---|---|---|---|---|---|---|---|---|---|---|---|---|---|---|---|---|---|---|---|---|---|---|---|---|
| ||||||||||||||||||||||||||||||||||||||||||||||||
A more desirable approach to avoid motion-induced image blurring is to acquire the MR data fast enough so that cardiac and respiratory motions are adequately resolved. Advances in gradient coil performance, parallel acquisition techniques, and image reconstruction methods have allowed real-time CMR at 20 to 24 frames per second, albeit at the expense of spatial and temporal resolutions (8). Real-time imaging may be particularly useful when a patient has an irregular rhythm and to evaluate respiratory-related variations in blood flow and septal position (9). This technology, which is now commercially available on some clinical scanners, may obviate the need for ECG and respiratory triggering.
Sedation and Monitoring
Patients undergoing CMR examinations must remain still in the scanner bore for up to 60 minutes to minimize motion artifact during image acquisition and allow planning of successive imaging sequences. Accordingly, the need for performing the examination under sedation or anesthesia and an assessment of the risk/benefit ratio for proceeding under these circumstances should be determined well before the examination date. Multiple factors are taken into account when deciding whether a patient should have an examination with sedation, including the length of the anticipated examination protocol, the child’s developmental age and maturity, the child’s experience with prior procedures, and the parents’ opinion of their child’s capability to cooperate with the examination. True claustrophobia in the pediatric age group is rare. In general, most children of 7 years of age and older can cooperate sufficiently for a good-quality CMR study. Parents should be provided with a detailed description of the examination and asked to discuss it with their child in an age-appropriate manner in advance to increase the likelihood of a successful study. After proper screening, parents can be allowed into the scanner room to help their child complete the examination. Allowing patients to listen to music or watch movies through a specialized MRI-compatible audiovisual system may reduce anxiety and improve patient cooperation (10).
Strategies for sedation and anesthesia in CMR vary and often depend on institutional preference and resources such as availability of qualified pediatric anesthesiologists. Although it is possible to wait for young children to fall into a natural sleep using a “feed and swaddle” approach, this method may be time consuming and complicated by early awakening. Sedation can be achieved with a variety of medications (e.g., pentobarbital, propofol, fentanyl, midazolam, chloral hydrate) and is a reasonable approach (11,12). Its principal drawbacks are an unprotected airway and reliance on spontaneous respiratory effort with the associated risks of aspiration, airway obstruction, and hypoventilation. In addition, because images are often acquired over several seconds, respiratory motion will degrade image quality. This motion artifact can be reduced by synchronizing image data acquisition to the respiratory cycle tracked by either a bellows device around the abdomen or by navigator echoes that concurrently image the position of the diaphragm or heart. An alternative strategy to reduce respiratory motion artifacts is to acquire multiple images at the same location and average them, thereby minimizing variations from respiration. The principal limitations of both these strategies are prolonged scan times and incomplete elimination of respiratory motion that can lead to reduced image quality.
Because of these safety and image-quality concerns, we and others frequently prefer to perform CMR examinations under general anesthesia in children who cannot undergo an awake examination (13,14). This approach, described in detail elsewhere (2,15), is safe, consistently achieves adequate sedation, protects the airway, and offers control of ventilation. Respiratory motion artifact can be completely eliminated by suspending ventilation in conjunction with neuromuscular blockade. Breath-hold periods of 30 to 60 seconds are typically well tolerated, and allow multiple locations to be scanned efficiently.
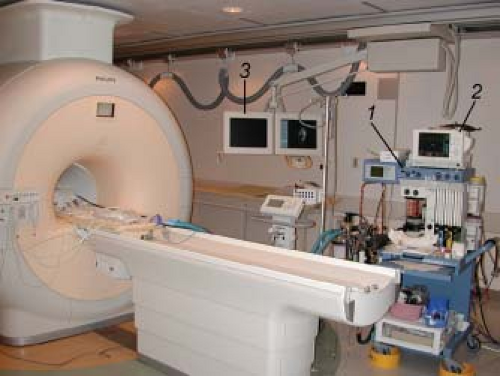
When utilizing either sedation or anesthesia, it is important that both the nurses and physicians have sufficient experience with these procedures in children with cardiovascular disorders. Continuous monitoring of the ECG, pulse oximetry, end-tidal carbon dioxide, anesthetic gases, blood pressure, and temperature with an MRI-compatible physiologic monitoring system is required (Fig. 14.4). MRI compatible anesthesia machines are available that can be located in the scanner room and connected to the patient’s
endotracheal tube by an extended breathing circuit. To maximize patient safety and examination quality, it is recommended that different healthcare providers be responsible for supervising the imaging and sedation/anesthesia aspects of the study, and that both communicate closely with each other.
endotracheal tube by an extended breathing circuit. To maximize patient safety and examination quality, it is recommended that different healthcare providers be responsible for supervising the imaging and sedation/anesthesia aspects of the study, and that both communicate closely with each other.
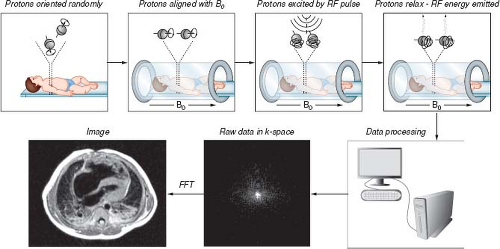 Figure 14.1 From signal to image. Top panel: Outside the scanner’s magnetic field, the orientation of the spinning (precessing) protons is random. Once inside the scanner, the protons are aligned with the direction of the static xmagnetic field (B0). Excitation by a brief pulse of radiofrequency (RF) energy perturbs the protons into a state of higher energy. Once the RF pulse ceases, the protons return to their original state of energy (relaxation) and emit RF energy. Lower panel: The emitted RF energy is captured by receiver coils (antennas) and passes through a series of electronic filters. The raw magnetic resonance (MR) signal is stored as an array of numbers called “k-space.” By applying Fourier transformation (FT), the raw MR data stored in k-space are translated into an image. |
Patient Preparation
Prior to bringing the patient into the scanner room, the physician and technologists should review the patient’s history, safety screening form, and the most recent chest radiograph to identify
implanted devices which may be hazardous in the MRI environment or produce image artifact. A detailed discussion on MRI safety can be found at the end of this chapter and elsewhere (16,17,18).
implanted devices which may be hazardous in the MRI environment or produce image artifact. A detailed discussion on MRI safety can be found at the end of this chapter and elsewhere (16,17,18).
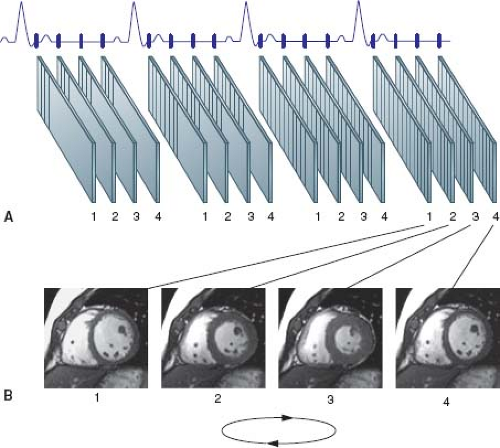 Figure 14.2 Cine MRI. A: Schematic representation of image data acquisition. Using the ECG signal, the cardiac cycle is divided into multiple equally spaced acquisition windows. Several lines of k-space are acquired during each acquisition window (a technique called segmented k-space). B: Over several heartbeats, a series of images spanning the cardiac cycle is reconstructed and viewed in cine loop mode. |
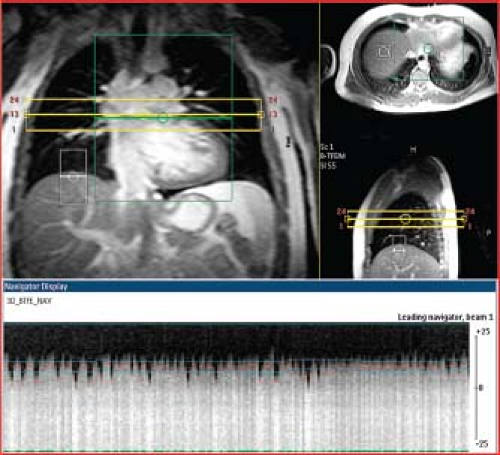 Figure 14.3 Respiratory navigator. Top: The navigator beam is positioned over the right hemidiaphragm and includes lung and liver tissues. Bottom: The motion of the right hemidiaphragm is continuously displayed along with the acceptance window (horizontal lines). Only data acquired when the position of the right hemidiaphragm is registered within the acceptance window are used for image reconstruction. |
Following safety screening, physiologic monitoring devices and hearing protection (for both awake and anesthetized patients) are put in place. A high-quality ECG signal is essential for optimum image quality in cardiac-gated sequences. The signal should be checked both when the patient is outside and then inside the scanner bore. In patients with dextrocardia, ECG leads are best placed on the right chest. Because young children dissipate body heat faster than adults, the scanner room temperature should be adjusted and prewarmed blankets applied to minimize heat loss.
The imaging coil should be chosen to maximize the signal-to-noise ratio over the entire body region to be examined. Because CHD often involves abnormalities of the thoracic vasculature, the coil will usually need to be large enough to cover the entire thorax rather than just the heart. Adult head or knee coils are often appropriate for infants weighing less than 10 kg, and adult cardiac coil for medium-sized children weighing between 10 and 40 kg. More recently, multichannel coils designed specifically for cardiovascular imaging in infants and young children have become commercially available (Fig. 14.5). Adequate coil coverage and placement should be confirmed early in the examination by reviewing the localizing images.
Safety
Standard clinical imaging scanners present no known hazards to biologic materials. Guidelines set by the Food and Drug Administration (FDA) keep the strength of the magnetic fields and the deposition of RF energy well below levels that could cause significant biologic effects. Animal studies evaluating the influence of static magnetic fields have not demonstrated significant biologic effects for fields of up to 2 T (19). Millions of patients have undergone MRI studies without any noticeable immediate or long-term sequelae. The incidence of complications related to CMR examination in patients with CHD is low (1.6%), most of which are minor and transient (1). Not surprisingly, infants with severe cardiorespiratory compromise referred to CMR from the cardiac intensive care unit are more susceptible to adverse events such as transient hypotension and hypoxemia.
Investigations on pregnant human subjects exposed to MR imaging or the MR environment have not revealed any adverse outcomes. Current guidelines state that pregnant patients can be accepted to undergo MR scans at any stage of pregnancy if the risk–benefit ratio to the patient warrants that the study be performed (20). Thus, when maternal and fetal health considerations necessitate diagnostic studies, MRI is preferable to methods that use x-rays, such as computed tomography or standard angiography.
Use of gadolinium (Gd)-based contrast agents is commonly used in CMR examinations in patients of all ages for angiography and for assessment of myocardial viability, first passes perfusion, and diffuse fibrosis (21,22,23). It is important to note that the FDA has not approved the use of contrast agents in CMR; hence its use is off-label. The incidence of adverse events related to Gd contrast is very low. In patients with CHD, Dorfman et al. (1) reported an event rate of 0.84%; all were minor and transient events such as nausea, vomiting, or sensation of warmth. Anaphylactic reaction to Gd contrast is exceptionally rare (24). Nephrogenic systemic fibrosis (NSF), previously known as nephrogenic fibrosing dermopathy, is a well-recognized but incompletely understood systemic disease characterized by progressive multiple-organ fibrosis. An association between NSF and Gd administration was recognized in 2006 (25). Subsequent investigations found that patients with renal failure were at risk for developing this rare but severe complication (26,27). Consequently, most institutions have adopted a policy to avoid using Gd contrast in patients with impaired renal function (28). A recent study has shown no new cases of NSF since the institution of a policy of avoiding use of Gd contrast in patients with glomerular filtration rate lower than 60 mL/min/m2 (29).
Implanted metallic objects are of particular concern in the MR environment since they could potentially undergo undesirable movements if the magnetic field were sufficiently strong and if they contained sufficient ferromagnetic material (Table 14.2). Fortunately, surgical clips and sternotomy wires implanted in the chest and abdomen are typically only weakly ferromagnetic. Furthermore, these devices quickly become immobilized by surrounding fibrous tissue, and MRI can safely be used to study patients with these implants. The wires and clips, however, may cause localized image artifact. Similarly, MRI can be used to image patients with implanted intravascular coils, stents, and occluding devices once the implants are believed to be immobile. Many centers choose to avoid exposing these patients to MRI for an arbitrarily chosen period of time after implantation (usually for several weeks), but
such practice is not supported by conclusive published data. A decision to perform MRI examination shortly after cardiac surgery or implantation of a biomedical device must weigh the risk/benefit ratio for the individual patient (30).
such practice is not supported by conclusive published data. A decision to perform MRI examination shortly after cardiac surgery or implantation of a biomedical device must weigh the risk/benefit ratio for the individual patient (30).
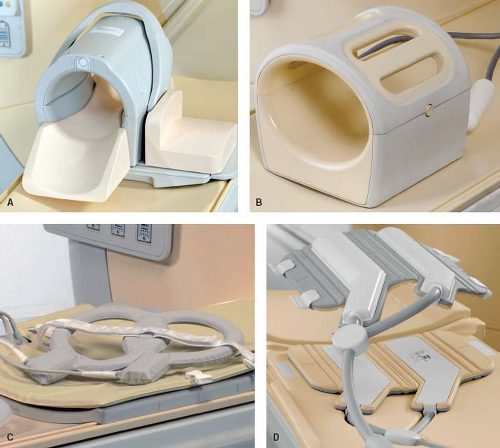 Figure 14.5 Multichannel radiofrequency coils used in CMR imaging in infants, children, and adults. A: Eight-channel knee coil used in infants weighing 4 kg or less; B: Eight-channel pediatric coil used in patients weighing between 4 and 10 kg; C: Five-channel cardiac coil used in patients weighing between 10 and 30 kg; and D: Thirty-two–channel cardiac coil used in patients weighing 30 kg or more. These body weights are approximates and other considerations are taken into account when selecting a coil for an individual patient. |
Several devices are considered either a relative or absolute contraindication to MRI (30,31). Presence of an intracranial, intraocular, and intracochlear metallic object is considered a contraindication to MRI. The presence of a cardiac pacemaker is also considered a contraindication to MRI (32) although some reports have suggested that scanning patients who have modern pacemakers may be possible (16,33,34). In 2011, the FDA gave conditional approval to a pacemaker designed specifically to be MRI-compatible (35).
Because MRI scanners attract ferromagnetic objects, extreme caution should be used in approaching magnets with objects containing iron or other ferromagnetic materials. Only specially designed MRI-compatible physiologic monitoring equipment should be used in conjunction with MRI studies. There have been several reported cases of patient burns resulting from the use of MRI-incompatible pulse oximeters and electrocardiographic monitoring devices.
Supervision and Interpretation of MRI Examination
Detailed preexamination planning is crucial given the wide array of imaging sequences available and the often-complex nature of the clinical, anatomic, and functional issues in patients with CHD. The importance of a careful review of the patient’s medical history, including details of all cardiovascular surgical procedures, interventional catheterizations, findings of previous diagnostic tests, and current clinical status, cannot be overemphasized. As with echocardiography and cardiac catheterization, CMR examination of CHD is an interactive diagnostic procedure that requires online
review and interpretation of the data by the supervising physician. The unpredictable nature of the anatomy and hemodynamics often require adjustment of the examination protocol, modification of imaging planes, changing sequences, and adjustment of imaging parameters. Reliance on standardized protocols and postexamination review alone in these patients may result in incomplete or even erroneous interpretation.
review and interpretation of the data by the supervising physician. The unpredictable nature of the anatomy and hemodynamics often require adjustment of the examination protocol, modification of imaging planes, changing sequences, and adjustment of imaging parameters. Reliance on standardized protocols and postexamination review alone in these patients may result in incomplete or even erroneous interpretation.
TABLE 14.2 Safety Considerations and Image Artifacts Due to Implanted Devices Used in Patients with Congenital Heart Disease | ||||||||||||||||||||||||||||||||||||||||||||||||||||||||||||||||||||||||||||||||||||
|---|---|---|---|---|---|---|---|---|---|---|---|---|---|---|---|---|---|---|---|---|---|---|---|---|---|---|---|---|---|---|---|---|---|---|---|---|---|---|---|---|---|---|---|---|---|---|---|---|---|---|---|---|---|---|---|---|---|---|---|---|---|---|---|---|---|---|---|---|---|---|---|---|---|---|---|---|---|---|---|---|---|---|---|---|
| ||||||||||||||||||||||||||||||||||||||||||||||||||||||||||||||||||||||||||||||||||||
Clinical Applications
CMR Examination Techniques
The building blocks of any MRI examination are called “pulse sequences” (Fig. 14.4). An MRI pulse sequence describes the way the magnetic field gradients and RF pulses are applied to produce images with particular characteristics. During the course of a CMR examination, the examiner selects the pulse sequences and prescribes imaging locations and planes to acquire the image data to address specific clinical questions. Some of the pulse sequences used in CMR practice are described below together with their clinical applications.
Assessment of Cardiovascular Anatomy
Evaluation of cardiovascular anatomy and function in patients with CHD is often inseparable. Several MRI sequences can be used for anatomic delineation; each has particular advantages and provides specific information. In practice, the anatomy in question is often assessed by more than one imaging sequence, yielding overlapping information that increases diagnostic confidence.
Spin Echo MRI
With spin echo (SE) imaging, the MR signal is produced by applying a brief RF pulse that tips the magnetization vector of the hydrogen atoms (spins) 90 degrees relative to the axis of the main magnetic field, followed by a 180-degree refocusing RF pulse (Fig. 14.6).
Because of the relatively long time interval between tissue excitation and data sampling, flowing blood will leave the image plane by the time the signal is sampled. The result is an image in which flowing blood appears black whereas more stationary tissues produce MR signals displayed in varying shades of gray or white (“black blood” imaging) (Fig. 14.7A). Other features of SE pulse sequences include a single image per cardiac cycle (static imaging), high tissue contrast, and, compared with gradient echo pulse sequences, relative insensitivity to inhomogeneities in the magnetic field. In clinical practice, such inhomogeneities are mostly owing to ferromagnetic implants such as sternal wires, prosthetic heart valves, stents, coils, or other implants. SE sequences can also be modified to alter tissue contrast and characterize the composition of structures (e.g., T1 and T2 weighting) (Fig. 14.7B). Standard SE requires several minutes (usually 2 to 4 minutes depending on heart rate and imaging parameters) to acquire an image dataset. Fast or turbo spin echo (FSE or TSE) requires a much shorter image acquisition time because instead of acquiring a single phase encoding line for each 90 degrees RF pulse, multiple phase encoding lines are acquired in rapid succession (called “echo train”). As a result, image acquisition can be completed during 10 to 15 seconds of breath holding. In the TSE sequence, the blood signal is nulled by an inversion pulse (called double inversion recovery) rather than relying on blood flow alone.
Because of the relatively long time interval between tissue excitation and data sampling, flowing blood will leave the image plane by the time the signal is sampled. The result is an image in which flowing blood appears black whereas more stationary tissues produce MR signals displayed in varying shades of gray or white (“black blood” imaging) (Fig. 14.7A). Other features of SE pulse sequences include a single image per cardiac cycle (static imaging), high tissue contrast, and, compared with gradient echo pulse sequences, relative insensitivity to inhomogeneities in the magnetic field. In clinical practice, such inhomogeneities are mostly owing to ferromagnetic implants such as sternal wires, prosthetic heart valves, stents, coils, or other implants. SE sequences can also be modified to alter tissue contrast and characterize the composition of structures (e.g., T1 and T2 weighting) (Fig. 14.7B). Standard SE requires several minutes (usually 2 to 4 minutes depending on heart rate and imaging parameters) to acquire an image dataset. Fast or turbo spin echo (FSE or TSE) requires a much shorter image acquisition time because instead of acquiring a single phase encoding line for each 90 degrees RF pulse, multiple phase encoding lines are acquired in rapid succession (called “echo train”). As a result, image acquisition can be completed during 10 to 15 seconds of breath holding. In the TSE sequence, the blood signal is nulled by an inversion pulse (called double inversion recovery) rather than relying on blood flow alone.
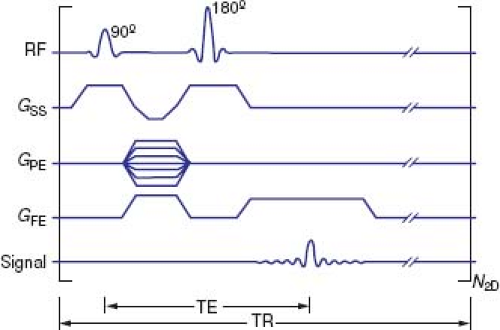 Figure 14.6 Timing diagram of a spin echo pulse sequence. The x-axis represents time. The first step is the simultaneous applications of a 90-degree radiofrequency (RF) pulse and a slice-selective gradient (GSS) pulse. The next step is the application of a slice-selective 180-degree RF pulse to refocus the transverse magnetization that lost phase coherence due to inhomogeneities in the magnetic field. To locate the MR signal in space (spatial localization), multiple frequency encoding (GPE) and a single phase encoding (GFE) gradients are applied. The time at which the MR signal (echo) is recorded is called echo time, or TE. This sequence results in the acquisition of one line of k-space data. The sequence is repeated N2-D times, each with a different phase-encoding value, until all lines of k-space are collected and a 2-D image is reconstructed. The time from onset of one sequence to the next is called repletion time, or TR. |
Standard SE was the workhorse of CMR during the 1980s. In today’s clinical practice, standard SE has been largely replaced by FSE or TSE with double inversion recovery (3). Examples of clinical applications include assessment of tissue characteristics (e.g., cardiac tumors), vessel wall imaging (e.g., aortic dissection), evaluation of the pericardium, and anatomic imaging in patients with metallic implants such as stents and prosthetic valves.
Gradient Echo Cine MRI
Gradient echo MR is a class of pulse sequences that produce bright blood images. The fundamental difference between SE and gradient echo sequences is that in the latter the initial RF pulse tips the spins at an angle (called flip angle) <90 degrees. Gradient echo sequences are generally faster than SE sequences because the time between spin excitation and signal detection (called “echo time” or TE) is much shorter. The signal from stationary or relatively slow-moving tissues (such as the myocardium) is gray because the spins within the selected slice have reduced signal intensity (i.e., partially saturated) by the rapid repetition of the RF pulse. This is because the spins do not have sufficient time to return to their original unexcited state during the short interval between RF pulses, which result
in a relatively weak signal. On the other hand, blood that flows into the slice contains unsaturated spins that produce relatively strong signals, hence the term “bright blood” imaging (Fig. 14.8). An important feature of gradient echo sequences is high imaging speed, which allows reconstruction of multiple images during the cardiac cycle that can be displayed in cine loop format. Compared with SE techniques, gradient echo sequences have a relatively low tissue contrast and are more susceptible to inhomogeneities within the magnetic field.
in a relatively weak signal. On the other hand, blood that flows into the slice contains unsaturated spins that produce relatively strong signals, hence the term “bright blood” imaging (Fig. 14.8). An important feature of gradient echo sequences is high imaging speed, which allows reconstruction of multiple images during the cardiac cycle that can be displayed in cine loop format. Compared with SE techniques, gradient echo sequences have a relatively low tissue contrast and are more susceptible to inhomogeneities within the magnetic field.
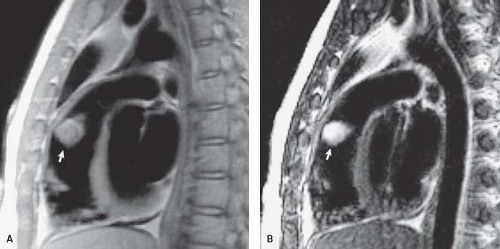 Figure 14.7 Short-axis fast (turbo) spin echo image in a patient with hemangioma of the right ventricular outflow tract. A: T1-weighted image showing a slightly hyperintense globular tumor (arrow); B: T2-weighted image showing the tumor is markedly hyperintense, consistent with a vascular tumor. |
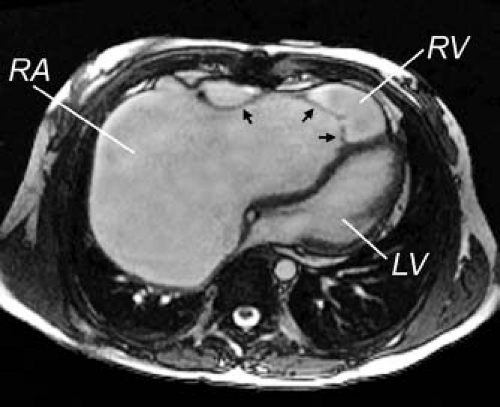 Figure 14.8 ECG-triggered steady-state–free precession image in the axial plane in a patient with severe Ebstein anomaly. Note the apical displacement of the tricuspid valve (black arrows), “atrialization” of the right ventricular inflow, markedly dilated right atrium (RA), and the compressed left ventricle (LV). |
ECG- or VCG-triggered steady-state free precession (SSFP) is the most commonly used cine MRI technique for assessment of cardiovascular anatomy and ventricular function. The brightness of a given tissue in this case is determined primarily by the ratio of T2-to-T1 relaxation times which results in high contrast between the blood pool (T2/T1 = 360 ms/1,200 ms = 0.3) and the myocardium (T2/T1 = 75 ms/880 ms = 0.085) and clearly depicts the boundaries of cardiovascular structures (Fig. 14.8) (36). This sequence is known by several proprietary names, including true fast imaging with steady precession (trueFISP), balanced fast field echo (bFFE), and fast imaging employing steady-state acquisition (FIESTA). The acquisition time of SSFP cine MRI is short, typically requiring 4 to 10 seconds for each location depending on heart rate, spatial resolution, and other acquisition parameters. The SSFP sequence, however, is highly sensitive to inhomogeneities in the magnetic field such as those induced by implanted metallic devices.
A segmented k-space fast (also termed “turbo”) gradient recalled echo (fast GRE) sequence has been used extensively during the 1990s, and its accuracy and reproducibility in measuring ventricular dimensions and function have been validated (37,38). Compared with SSFP, the distinction between blood and myocardium on fast GRE images is less sharp, the contrast-to-noise ratio and the temporal resolution are lower, image acquisition time is longer, and images are more susceptible to blood flow effects. On the other hand, fast GRE is less susceptible to inhomogeneities in the magnetic field than SSFP.
In clinical practice, an ECG-gated gradient echo cine MRI sequence is prescribed across the anatomy of interest to yield a stack of contiguous cross-sectional slices that can be displayed on a computer workstation in a multilocation, multiphase (cine loop) format. ECG-gated segmented k-space SSFP cine MRI is the sequence of choice for evaluation of cardiac anatomy and function because of its excellent blood–myocardium contrast, high spatial and temporal resolutions, and short acquisition time. Use of a parallel imaging technique (e.g., sensitivity encoding or SENSE) further shortens acquisition time (39). The SSFP sequence allows detailed imaging of the cardiac chambers, the atrioventricular and semilunar valves, the papillary muscles and chordae tendineae, the membranous septum, septum primum, and blood vessels (Fig. 14.8). The SSFP sequence, however, is relatively less sensitive to flow disturbances due to stenotic or regurgitant jets compared to fast GRE. Alternatively, a velocity-encoded cine (VEC) MRI sequence can be prescribed when further delineation of abnormal flow jets is desirable.
Three-Dimensional Steady State Free Precession MRI
This cardiac-triggered SSFP technique acquires a three-dimensional (3-D) image volume over a period of 4 to 7 minutes of free breathing (40,41). The motion of the diaphragm is tracked with a navigator pulse and image data are accepted only when the position of the diaphragm lies within a narrow window defined by the operator (Fig. 14.3), thus avoiding artifacts from respiratory motion. The volume elements (voxels) of the image dataset are typically isotropic, which allows offline reformatting of the image volume in any arbitrary plane. This imaging technique does not require administration of contrast agents and provides high-resolution static imaging of both intracardiac and extracardiac anatomy (Fig. 14.9).
Coronary Artery Imaging
The origin and course of the epicardial coronary arteries can be evaluated by several MRI techniques. Most of the published experience with MRI evaluation of the coronary arteries is based on a cardiac-triggered, navigator-gated free-breathing 3-D magnetic resonance angiography (MRA) sequence (42). This technique has been used successfully in patients with various congenital anomalies of the coronary arteries (Fig. 14.10) and in Kawasaki disease (43,44,45).
Contrast-Enhanced Three-Dimensional MRA
Gd-enhanced 3-D MRA is ideally suited for imaging of extracardiac vascular anatomy. Examples of common clinical applications include imaging of the aorta and its branches, pulmonary arteries, pulmonary veins, systemic veins, aortopulmonary and venous-venous collateral vessels, systemic-to-pulmonary artery shunts, conduits, and vascular grafts (11,46). Although this technique is mostly used for imaging of extracardiac anatomy, we have also found it useful in the evaluation of intraatrial systemic and pulmonary baffles (e.g., Mustard or Senning operations and Fontan palliation), as well as for imaging of the outflow tracts (e.g., repaired TOF and the arterial switch operation [ASO]). In addition, Gd-enhanced 3-D MRA clearly delineates the spatial relationships between vascular structures, the tracheobronchial tree, chest wall, spine, and other landmarks that may be useful for planning interventional catheterization or surgical procedures (Fig. 14.11). More recently, imaging acceleration techniques have been applied to shorten the acquisition time to 2 to 5 seconds thereby permitting multiple 3-D volume sets to be acquired as the contrast passes through the circulation producing a “time-resolved” 3-D MRA (47). However, given the trade-offs between spatial and temporal resolutions, the clinical utility of this imaging technique awaits further study.
In practice, the contrast (e.g., gadopentetate dimeglumine 0.2 mmol/kg) is infused through a peripheral intravenous cannula either by hand or by a power injector. The patient is instructed to hold his/her breath and imaging acquisition is initiated. The time delay between start of contrast injection and data acquisition is determined either by a magnetic resonance fluoroscopic method
that allows real time visualization of the arrival of the contrast bolus to the heart or by a bolus tracking technique. Two or more sequential 3-D MRA data acquisitions are usually obtained 10 to 15 seconds apart during suspended respiration.
that allows real time visualization of the arrival of the contrast bolus to the heart or by a bolus tracking technique. Two or more sequential 3-D MRA data acquisitions are usually obtained 10 to 15 seconds apart during suspended respiration.
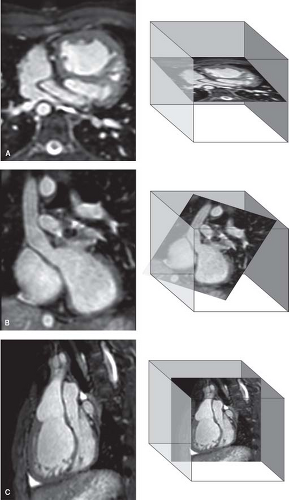 Figure 14.9 Free-breathing (navigator-gated), ECG-triggered, isotropic, 3-D steady-state free precession imaging in a patient with Mustard palliation of transposition of the great arteries. The 3-D data volume is reformatted offline in multiple user-defined planes. A: Transverse view of the pulmonary venous pathway. B: Oblique view depicting the superior vena cava pathway. C: Oblique sagittal view of the left and right ventricular outflow tracts. |
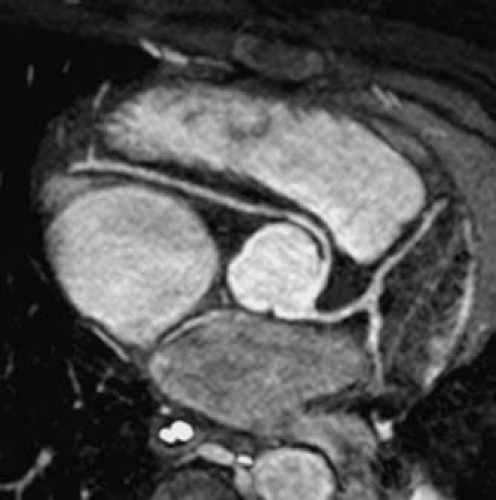 Figure 14.10 Free-breathing (navigator-gated), ECG-triggered, 3-D coronary magnetic resonance angiogram (MRA) showing anomalous origin of the right coronary artery from the left aortic sinus of Valsalva. |
Ventricular Function
Technique
ECG- or VCG-triggered SSFP is the preferred cine MRI technique for assessment of ventricular function. In patients in whom image artifacts from metallic implants obscure the ventricles, a fast (turbo) GRE sequence can be used because it is less susceptible to inhomogeneities in the magnetic field (48). ECG-triggered SSFP cine MRI is acquired during short periods of breath holding. Depending on heart rate and image acquisition parameters (matrix size, number of k-space lines per segment, and the scanner’s gradient system capabilities), high-resolution acquisition may last 7 to10 seconds per slice. A modest decrease in spatial and temporal resolutions will lower the acquisition time to 4 to 5 seconds while producing diagnostically acceptable images. The use of sensitivity encoding (SENSE) technology allows shorter acquisitions time by a factor of 2 to 4 (at the expense of reduced signal-to-noise ratio), an increase in spatial or temporal resolutions while maintaining the same acquisition time, or a combination of the two. Patients are instructed to hold their breath at end-expiration to minimize variations in the position of the diaphragm and, consequently, the heart. In patients who are incapable of holding their breath, images are acquired during free breathing either with multiple signal averages, with respiratory triggering, or with real-time MR fluoroscopy (49,50).
Quantitative evaluation of ventricular function is achieved by obtaining a series of contiguous SSFP cine MRI slices that cover the ventricles in short-axis (Fig. 14.12). This involves the following steps:
Two-chamber plane (also known as vertical long-axis plane): A slice is prescribed parallel to the plane of the interventricular septum based on previously obtained scout images in the axial
(transverse plane) (Fig. 14.12A). In patients with a biventricular heart and a systemic left ventricle (LV), the slice extends from the center of the mitral valve to the LV apex. In patients with a systemic right ventricle (RV) (e.g., atrial switch operation for transposition of the great arteries), it is advantageous to place the slice between the center of the tricuspid valve and the RV apex. In patients with a single ventricle, the slice is placed between the center of the atrioventricular (AV) valve(s) and the ventricular apex. This acquisition accounts for the orientation of the ventricles in the transverse plane of the chest.
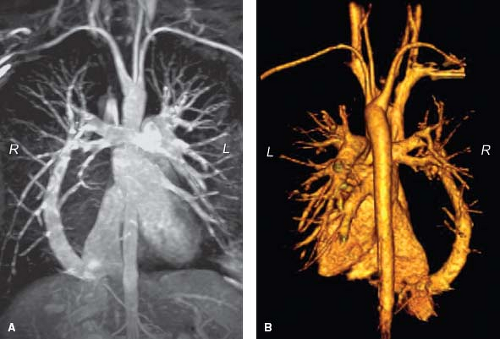
Figure 14.11 Gadolinium-enhanced 3-D MRA of scimitar syndrome. A: Subvolume maximal intensity projection; B: 3-D volume rendering (posterior view). L, left; R, right.
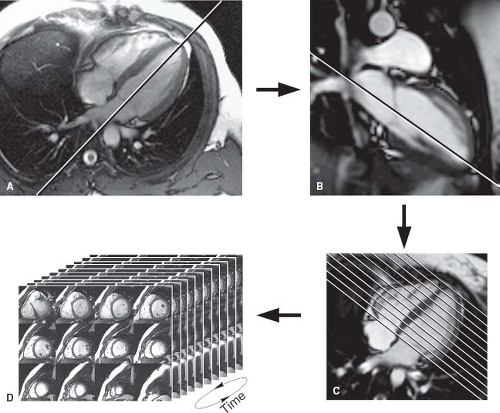
Figure 14.12 Evaluation of ventricular volumes and mass. A: Using a localizing image obtained in the axial (transverse) plane, a two-chamber (also known as vertical long-axis) plane is prescribed as shown; B: Prescription of the four-chamber plane from an end-diastolic image of the previous two-chamber cine sequence; C: Prescription of the short-axis plane from an end-diastolic image of the previous four-chamber cine sequence extending from the plane of the atrioventricular (AV) valves through the cardiac apex; D: The short-axis stack is viewed in cine mode.
Four-chamber plane (also known as horizontal long-axis plane): A stack of slices (usually four) is prescribed from an end-diastolic image of a slice acquired perpendicular the previous two-chamber cine sequence (Fig. 14.12B). This acquisition accounts for the superior–inferior orientation of the ventricles in the chest.
Short-axis plane: Multiple equidistant slices are prescribed from an end-diastolic image of the previous four-chamber cine sequence covering the ventricles from the plane of the AV valve(s) to the cardiac apex (Fig. 14.12C). The first slice is placed at the level of the AV annuli by connecting the right coronary artery (seen in cross-section in the right AV groove) with the left circumflex coronary artery (seen in the left AV groove). Subsequent slices are positioned in equidistance through the cardiac apex (Fig. 14.12D). In most patients, 12 slices will cover the ventricles from base-to-apex with adjustment of slice thickness between 4 and 8 mm and the interslice spacing from 0 to 2 mm. Using these guidelines, the range of ventricular lengths covered is 4.8 to 12 cm. In some infants, the number of slices can be reduced whereas in older patients with markedly dilated ventricles, or in those with abnormally shaped ventricles (e.g., basal RV “shoulder” protruding past the plane of the tricuspid valve), the number of slices may need to be increased. We prefer not to increase the slice thickness >8 mm and interslice spacing >2 mm to avoid partial volume effect and to minimize extrapolation of interslice data.
Image Analysis
Accurate determination of ventricular volume requires clear depiction of the blood–myocardial boundary. Adjustment of the image brightness and contrast on the computer screen can facilitate visualization of that boundary. By tracing the blood–endocardium boundary, the slice’s blood pool volume is calculated as the product of its cross-sectional area and thickness (which is prescribed by
the operator). The left ventricular papillary muscles and the major trabeculations of the RV (e.g., septal and moderator bands) are excluded from the blood pool and are considered part of the myocardium (51,52). Ventricular volume is then determined by summation of the volumes of all slices. The process can be repeated for each frame in the cardiac cycle to obtain a continuous time–volume loop or it may be performed only on end-diastolic (maximal area) and end-systolic (minimal area) frames to calculate diastolic and systolic volumes. From these data one can calculate left and right ventricular ejection fractions and stroke volumes. Since the patient’s heart rate at the time of image acquisition is known, one can calculate left and right ventricular outputs as the product of stroke volume and heart rate. Ventricular mass is calculated by tracing the epicardial borders and calculating the epicardial volume, subtracting the endocardial volume, and multiplying the resultant muscle volume by the specific gravity of the myocardium (1.05 g/mL).
the operator). The left ventricular papillary muscles and the major trabeculations of the RV (e.g., septal and moderator bands) are excluded from the blood pool and are considered part of the myocardium (51,52). Ventricular volume is then determined by summation of the volumes of all slices. The process can be repeated for each frame in the cardiac cycle to obtain a continuous time–volume loop or it may be performed only on end-diastolic (maximal area) and end-systolic (minimal area) frames to calculate diastolic and systolic volumes. From these data one can calculate left and right ventricular ejection fractions and stroke volumes. Since the patient’s heart rate at the time of image acquisition is known, one can calculate left and right ventricular outputs as the product of stroke volume and heart rate. Ventricular mass is calculated by tracing the epicardial borders and calculating the epicardial volume, subtracting the endocardial volume, and multiplying the resultant muscle volume by the specific gravity of the myocardium (1.05 g/mL).
Several approaches to measurements of biventricular size and function have been reported. In general, these can be divided into two broad categories: (1) Methods that rely on summation of discs (Simpson’s principle) (53); and (2) methods that rely on modeling the chamber or extrapolation of sparse data (54,55,56). In the first category, each of the slices covering the ventricles is contoured at least once at end-diastole (largest volume) and at end-systole (smallest volume). Some groups have advocated the use of images obtained in axial or oblique long-axis planes (57,58). The major advantage of this approach, as compared with analysis based on short-axis images, is the ease of determining the planes of the AV and semilunar valves. This advantage is likely responsible for the slightly higher reproducibility of measurements using older software (58). However, this approach limits evaluation of ventricular mass because the epicardial and endocardial borders of the diaphragmatic wall of the heart are not clearly defined. Recent development of techniques that incorporate cross-references between long-axis and short-axis images has greatly reduced the difficulty in determining valve plane on short-axis images (Fig. 14.12) (59). Moreover, most reports on normal values as well as the majority of the literature on ventricular size and function in CHD and acquired heart disease is based on analysis of short-axis images (51,60,61).
In the second category, either a formula based on a geometrical model or extrapolation from sparse data is used to generate ventricular volumes (54,55,56). The major advantage of this approach is shorter analysis time but it is disadvantaged by reduced accuracy.
In our center ventricular volumes and mass are measured from short-axis cine SSFP images (52). Cross-referencing the short-axis images with left and right ventricular two-chamber (vertical long-axis) and four-chamber (horizontal long-axis) cine SSFP facilitates accurate determination of the AV and semilunar valves planes during systole and diastole (59). To optimize interstudy reproducibility in patients followed longitudinally, contours should be compared side-by-side with those from previous studies. Saving the contour files along with previous studies facilitates this comparison. On average, total analysis time is ∼25 minutes and decreases with operator experience (59).
Manufacturers of MRI scanners and several third party companies offer software packages that automatically perform the above calculations. Development of algorithms for automatic border detection has facilitated the application of these techniques, but further refinements are required to improve its accuracy (62,63).
Potential Sources of Errors in Determining Ventricular Volumes by MRI
Translational motion of the ventricles in the base-to-apex direction is most prominent at the base of the heart. Given that the prescribed short-axis slices are fixed in space, there is significant through-plane motion in the basal slices during the cardiac cycle. As a result, the first (and sometimes also the second) most basal slices may contain atrial blood pool during part of the cardiac cycle because the AV junction has moved out of the imaging plane during systole. To avoid erroneous inclusion of the atrial blood pool in the calculation of ventricular volume, the image dataset is examined to distinguish between ventricular and atrial structures. In general, when a slice contains a ventricular chamber throughout the cardiac cycle, the chamber’s cross-sectional area decreases in systole and its wall thickness increases. In contrast, in a slice containing ventricular myocardium in diastole and atrial blood pool in systole, the chamber’s cross-sectional area increases and wall thickness decreases. Recent development of techniques that incorporate cross-references between long-axis and short-axis images has greatly reduced the difficulty in determining valve plane on short-axis images (59).
Another potential source of error in measurements of ventricular volumes is when the left ventricular papillary muscles and the right ventricular trabeculations are traced in an inconsistent fashion during systole and diastole. For example, exclusion of the papillary muscles from the blood pool in diastole but not in systole will lead to underestimation of end-systolic volume, stroke volume, and ejection fraction.
Inconsistent position of the diaphragm during breath holding can lead to spatial variations in the location of the ventricles during acquisition of the short-axis images. This source of error in volume calculation can be minimized by instructing the patient to hold his/her breath at end-expiration (64,65).
Accuracy, Reproducibility, and Reference Values of Ventricular Volumes and Function by CMR
The combination of a 3-D dataset, clear distinction between the blood pool and the myocardium, and high spatial and temporal resolutions allow accurate measurements of any cardiac chamber regardless of its morphology and without geometrical assumptions. Much research was performed in the late 1980s and early 1990s on in vitro phantoms, animal models, and in human subjects to validate the accuracy of CMR measurements of ventricular volumes and mass (66,67,68,69,70). More recently, attention has focused on investigating the test characteristics of CMR assessment of chamber dimensions and function, and on comparison of its accuracy and reproducibility with those of echocardiography and radionuclide techniques (71,72). Germain et al. (73), in a study of 20 patients with “good echocardiographic windows,” found that the mean (±SD) interstudy variability of CMR measurement of left ventricular mass was 6.75 ± 3.8% compared with 11 ± 6.4% for M-mode echocardiography. Bellenger et al. (74) calculated that the sample size required to detect changes in left ventricular volumes, ejection fraction, and mass by CMR in patients with heart failure were substantially smaller compared with published values for 2-D echocardiography. For example, to detect a 10-mL change in end-diastolic volume (with 90% power and p<0.05), 12 subjects must be studied by CMR versus 121 patients examined by 2-D echocardiography; a 3% change in ejection fraction requires 15 CMR versus 102 echocardiograms; and a 10-g change in mass requires 9 CMR versus 273 echocardiograms. Ioannidis et al. (75) compared the accuracy of single-photon emission computed tomography (SPECT) for assessment of left ventricular volumes and ejection fraction with that of CMR. Although the two modalities correlated well, compared with CMR, there was a substantial variation in individual measurements by SPECT. Half of the SPECT ejection fraction determinations deviated by at least 5% from CMR-obtained values and one in four deviated by at least 10%. In patients with CHD, Mooij et al. (59) demonstrated low interobserver coefficient of variations in 60 children, most with abnormalities affecting the right heart. The coefficient of variations for RV volumes and mass ranged from 6.4% to 11.3% and for LV volumes and mass from 3.6% to 10.5%.
Because CMR techniques continue to evolve, different imaging sequences may yield different measurements of ventricular dimensions and function. Several studies have compared the normal range of left and right ventricular mass, volume, and ejection
fraction measured by cine SSFP with values obtained by the fast (turbo) GRE cine technique (76). In general, compared with fast GRE, measurements based on cine SSFP resulted in larger ventricular volumes, lower mass, and similar ejection fraction. Importantly, both intraobserver and interobserver variations were lower with SSFP measurements. The range of SSFP-based left and right ventricular volumes, mass, and ejection fraction in 60 healthy subjects ranging in age from 20 to 65 years is published by Alfakih et al. (51). Other groups have published similar data in healthy adults (60,77). Several reports on SSFP-based normal values of ventricular dimensions in children have been published (61,78,79) but data in infants and young children are still lacking.
fraction measured by cine SSFP with values obtained by the fast (turbo) GRE cine technique (76). In general, compared with fast GRE, measurements based on cine SSFP resulted in larger ventricular volumes, lower mass, and similar ejection fraction. Importantly, both intraobserver and interobserver variations were lower with SSFP measurements. The range of SSFP-based left and right ventricular volumes, mass, and ejection fraction in 60 healthy subjects ranging in age from 20 to 65 years is published by Alfakih et al. (51). Other groups have published similar data in healthy adults (60,77). Several reports on SSFP-based normal values of ventricular dimensions in children have been published (61,78,79) but data in infants and young children are still lacking.
Assessment of Myocardial Function
Although ejection fraction and other ejection phase indices such as shortening fraction and velocity of circumferential fiber shortening are useful markers of ventricular function and provide valuable prognostic information, they are influenced by preload, afterload, heart rate, and the contractile state of the myocardium. Moreover, load-dependent ejection phase indices such as ejection fraction can be normal despite depressed contractility and, conversely, can be depressed despite having normal contractility. Therefore, assessment of ventricular function by load-independent indexes provides useful information on the contractile state of the myocardium. A detailed discussion of ventricular mechanics is beyond the scope of this chapter and can be found elsewhere (80,81).
Assessment of the contractile state of the myocardium by CMR has been investigated by Setser et al. (82) using normalized maximal ventricular power. An alternative approach is to adjust ejection phase variables such as ejection fraction, velocity of fiber shortening, or wall strain to end-systolic stress. With knowledge of left ventricular end-systolic volume, mass, and pressure (estimated based on mean arterial blood pressure measured by sphygmomanometry), end-systolic stress can be estimated as follows (81):
where
Vc is cavity volume
V0 is chamber volume (cavity volume + myocardial volume)
σp is average of orthogonal fiber stresses (σpφ + σpθ)/2.
It should be noted that experience with this method in CMR is lacking.
Analysis of Regional Wall Motion
A simple qualitative approach is to visually evaluate segmental ventricular wall motion and thickening imaged from long- and short-axis cine SSFP sequences. The LV is divided into 17 segments, as recommended by the American Heart Association (Fig. 14.13) (83) and the RV is divided into 9 segments as described by Klein et al. (Fig. 14.14) (84). Ventricular wall motion is classified as normal (appropriate systolic wall motion normal to the local wall segment accompanied by myocardial thickening indicative of fiber shortening), hypokinesis (reduced systolic motion and wall thickening), akinesis (no appreciable systolic wall motion and no change in wall thickness), or dyskinesis (outward systolic wall motion without myocardial thickening). A more objective approach is to define the endocardial and epicardial boundaries of the ventricles throughout the cardiac cycle, and, using commercially available software, quantitatively analyze wall motion and myocardial thickening (85). The main drawback of this approach is that it is time consuming, which hinders its acceptance into routine clinical practice. However, improvements in automatic border detection can shorten the process and may lead to increased use of this technique.
Analysis of Myocardial Strain and Stress
Analysis of myocardial strain provides information on regional myocardial function. Although myocardial strain can be calculated from velocity information obtained by phase velocity cine MRI technique (similar to tissue Doppler imaging), most investigators favor a technique called myocardial tagging using spatial modulation of magnetization (SPAMM) (86). This technique is a modification of cine gradient echo MRI that allows tracking of myocardial motion in two or three spatial dimensions over time. Using a preparatory RF pulse, saturation bands or “tags” that appear as dark lines or stripes are applied across the image at end-diastole (Fig. 14.15). On subsequent images, the stripes (tags) will remain unchanged on stationary tissue such as the chest wall and spine but will change their position on moving tissues such as ventricular myocardium. As the myocardium moves during the cardiac cycle, the tags follow it and their rotation, translation, and deformation can be tracked allowing for calculation of myocardial strain and strain rate (87). This analysis can be done during systole or diastole and in two or three dimensions (88). Early studies with myocardial tagging were mostly done by manually tracking of the tags, a time-consuming process that hindered the clinical use of this technique. A modified technique for the analysis of myocardial tagging data, harmonic phase imaging (HARP), greatly shortens analysis time because it does not require manual tracing of the tags (89). This technique relies on automatic analysis of the raw MRI data for changes in phase between images. With recent advances in automatic analysis of the tag data and fast image acquisition and display techniques, it is now possible to evaluate myocardial strain in real-time (8).
Myocardial tagging has been shown to be an important research tool in the study of normal left (90,91,92) and right (84,93) ventricular mechanics in healthy volunteers. In the clinical arena, analysis of wall strain by myocardial tagging has provided useful information in patients with ischemic and valvular heart disease (94,95,96). In a study of 211 patients with chest pain, Kuijpers et al. (97) demonstrated that myocardial tagging detects more segments with regional wall motion abnormalities by dobutamine stress CMR (DSMR) than visual assessment alone. Evaluating patients with CHD, Fogel et al. (98,99,100) used myocardial tagging to characterize patterns of wall motion and strain in patients with functionally single ventricles. As new fast MRI techniques coupled with automatic analysis of myocardial tagging become more widely available, the clinical application of ventricular strain analysis will likely expand. Further research is required to determine the clinical implications of the strain data and how it can be used to assess prognosis and guide patient management.
Tissue tracking, which is a relatively new method to assess myocardial motion and deformation by echocardiography (101), has recently been successfully applied to CMR (Fig. 14.16) (102). By comparing differences in signal intensities (speckles) from one frame to the next, specialized software tracks the motion of the myocardium and calculates displacement, strain, and strain rate in user-defined regions of the ventricles. Advantages of this technique include the ability to perform the analysis on existing cine CMR images and no requirement for additional sequences such as myocardial tagging. Using this technique, Ortega et al. (103) recently demonstrated in patients with repaired TOF that indexes of left ventricular dyssynchrony were associated with death and sustained ventricular tachycardia.
Stress CMR
There is a growing body of literature on the use of DSMR in the evaluation of myocardial ischemia in adults with coronary artery disease (see discussion in the section on myocardial ischemia below). Several studies have evaluated the use of stress CMR in patients with CHD. In a study of 32 children with congenital and acquired pediatric heart disease, Strigl et al. (104) demonstrated the
feasibility of dobutamine CMR for evaluation of stress-induced wall motion abnormalities. Using a protocol that included dobutamine doses up to 40 μg/kg/min and atropine to attain a target heart rate [0.85 − (220 − age)], the authors demonstrated excellent interobserver agreement (100%) for test positivity and good agreement (92%) for segmental wall motion score. Tulevski et al. (105,106) used a low-dose (15 μg/kg/min) dobutamine to evaluate the functional reserve of the LV and RV in asymptomatic and minimally symptomatic patients with repaired transposition of the great arteries, physiologically corrected transposition of the great arteries, and pulmonary outflow obstruction. Compared with controls, patients with systemic RV had decreased functional reserve. In another study from the same group, Dodge-Khatar et al. (107) showed that the functional reserve of the systemic ventricle is comparable in healthy adults and in patients with unoperated physiologically corrected transposition of the great arteries. Roest et al. (108) demonstrated the feasibility of assessing biventricular dimensions and function by CMR during supine exercise, a method that provides an alternative to pharmacologic stress.
feasibility of dobutamine CMR for evaluation of stress-induced wall motion abnormalities. Using a protocol that included dobutamine doses up to 40 μg/kg/min and atropine to attain a target heart rate [0.85 − (220 − age)], the authors demonstrated excellent interobserver agreement (100%) for test positivity and good agreement (92%) for segmental wall motion score. Tulevski et al. (105,106) used a low-dose (15 μg/kg/min) dobutamine to evaluate the functional reserve of the LV and RV in asymptomatic and minimally symptomatic patients with repaired transposition of the great arteries, physiologically corrected transposition of the great arteries, and pulmonary outflow obstruction. Compared with controls, patients with systemic RV had decreased functional reserve. In another study from the same group, Dodge-Khatar et al. (107) showed that the functional reserve of the systemic ventricle is comparable in healthy adults and in patients with unoperated physiologically corrected transposition of the great arteries. Roest et al. (108) demonstrated the feasibility of assessing biventricular dimensions and function by CMR during supine exercise, a method that provides an alternative to pharmacologic stress.
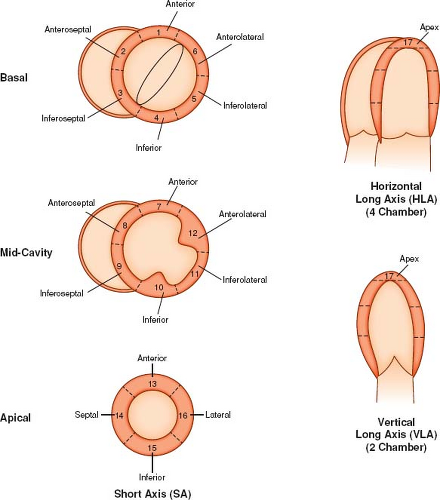 Figure 14.13 Left ventricular wall segments. Ant, anterior; Inf, inferior; Lat, lateral; LV, left ventricle; MV, mitral valve; PM, papillary muscles; Post, posterior; RV, right ventricle; SAX, short-axis; Sept, septal. (Adapted and modified from Cerqueira MD, Weissman NJ, Dilsizian V, et al. Standardized myocardial segmentation and nomenclature for tomographic imaging of the heart: a statement for healthcare professionals from the Cardiac Imaging Committee of the Council on Clinical Cardiology of the American Heart Association. Circulation. 2002;105:539–542 with permission.) |
Diastolic Function
Diastole is a complex process during which the force of the myofibers is restored (109). A detailed discussion of diastolic ventricular mechanics is beyond the scope of this chapter and can be found
elsewhere in this text. Researchers have utilized various modalities and a wide array of parameters to assess diastolic function, such as changes in pressure and chamber dimensions, wall thinning, myocardial velocities and strain, and a wide range of flow-derived variables obtained by Doppler interrogation of the AV valves and pulmonary veins. With the exception of direct pressure measurements, MRI can also evaluate all of the above variables (110,111,112,113,114). For example, Helbing et al. (110) used CMR to measure blood flow through the tricuspid and pulmonary valves as well as changes in right ventricular dimensions to assess diastolic function after TOF repair. Although the data derived from analysis of blood flow and chamber dimensions by MRI are not fundamentally different from similar data obtained by other techniques, MRI offers an advantage in terms of its ability to track tissue motion and deformation during the cardiac cycle using tissue tagging techniques (112,113,115). Fogel et al. (112) used myocardial tagging to study left ventricular diastolic strain in 11 infants with structurally normal hearts. They demonstrated inhomogeneities in both circumferential lengthening (E2) and radial thinning (E1). Another investigation has demonstrated in a canine model that measurements of the velocity of myocardial untwisting and recoil rate assessed by MRI using tissue tagging correlate closely with the time constant of relaxation or tau (τ) (r = −0.86), was unaffected by left atrial pressure, and that τ but not loading conditions was an independent predictor of the recoil
rate (113). Thus, the rate of recoil of torsion derived by tissue tagging may provide a noninvasive preload independent isovolumic phase measure of ventricular relaxation.
Stay updated, free articles. Join our Telegram channel

Full access? Get Clinical Tree


