Chapter 13 Magnetic Resonance Imaging
Magnetic resonance angiography (MRA) is widely accepted for the majority of vascular imaging applications and is the modality of choice for many of them, particularly peripheral and renal arteriography.1–3 Gadolinium-based contrast-enhanced (CE) MRA yields high-quality spatial resolution images with relatively short acquisition times. Detailed comparison with other imaging technologies is beyond the scope of this chapter, but general advantages and disadvantages appear in Table 13-1. These become important for many applications such as aortography, where multiple modalities (e.g., computed tomography [CT] and MRA) are routinely diagnostic and capable of providing images for planning most interventions.
Table 13-1 Advantages and Disadvantages of Vascular Imaging Methods
| Method | Advantages | Disadvantages |
|---|---|---|
| MR | No ionizing radiation | Expensive hardware Acquisition requires technical expertise |
| CE | High signal from gadolinium-based agents Less nephrotoxic than comparable iodine-based imaging (CT) | Nephrogenic systemic fibrosis can occur rarely in patients with severe renal insufficiency |
| Non-contrast | Eliminates toxicity concern | Longer acquisition times compared to CE protocol Increased risk of artifacts that are largely mitigated with CE-MRA |
| CT | Rapid, high signal, high-quality image acquisition Less technical expertise required compared to MR | Ionizing radiation Nephrotoxicity of iodine |
| DSA | Intervention can be performed at time of diagnosis Highest spatial resolution | Invasive Nephrotoxicity of iodine Projectional data may be inferior to volumetric acquisitions (CT, MR) that can be viewed in any plane |
| Sonography | No ionizing radiation Less expensive Flow information readily obtained Portable | Better for superficial imaging Limited by artifacts from bone, air, and sonographic interfaces Lower CNR, SNR compared to CT and MRI Operator-dependent |
CE, contrast-enhanced; CNR, contrast-to-noise ratio; CT, computed tomography; DSA, digital subtraction angiography; MRA, magnetic resonance angiography; MRI, magnetic resonance imaging; SNR, signal-to-noise ratio.
Magnetic Resonance Angiography Techniques
Magnetic resonance imaging relies on selective imaging of moving blood where signals from blood vessels are maximized, whereas signals from the stationary tissues are suppressed. Algorithms then enable reformatted images similar to those found in conventional x-ray angiography (Table 13-2).
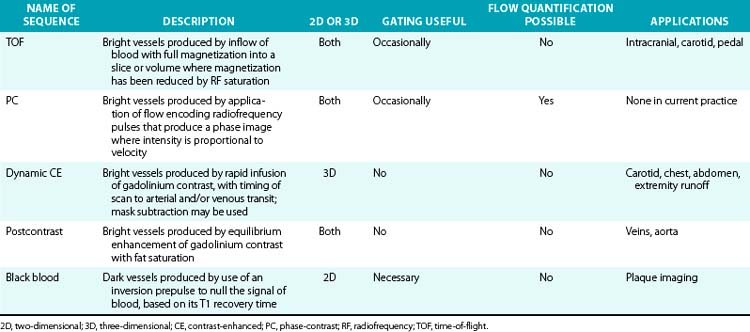
Magnetic resonance angiography methods can depict blood as either black or white. For those “black-blood” methods that use standard spin echo (SE) sequences (Fig. 13-1A), the excitation RF pulse is applied at 90° and followed by a refocusing pulse at 180°. If the imaging slice cuts across a vessel, then depending on the flow velocity and time interval between the pulses, the blood volume originally excited by the first pulse may not “see” the second pulse. This results in a black-appearing signal void in the vessel lumen. The use of thin sections or long echo times can further emphasize this flow void. This technique allows detailed examination of arterial wall morphology. Fast spin echo (FSE) sequences, in which a long train of echoes is obtained by use of repeated 180° pulses, produce images more rapidly. The double inversion recovery (DIR) FSE offers a new approach to enhance black-blood sequences. The technique uses two consecutive inversion pulses: the first nulls or blackens the blood everywhere in the coil, and the second restores magnetization in the slice being imaged. Between these pulses and image production, blood within the slice is replaced by nulled blood from outside. This produces more reliable black blood than conventional approaches, making this sequence ideal for examining wall thickness, dissection flaps, and the presence of mural thrombus or inflammation.4 This provides a clear advantage over traditional x-ray angiography.
TOF-MRA techniques depend on the inflow of unsaturated protons in blood from outside the field of view (FOV) into the stationary tissue within a section already saturated by its exposure to repeated RF pulses. These “saturated” protons are unable to contribute signal to the image. The signals in the stationary tissues of GRE images used in MRA are therefore typically low. The “unsaturated” protons in blood flowing into the imaging plane have not experienced the RF pulses and yield maximum signal. The unsaturated blood appears bright compared to background tissue (Fig. 13-1B). The time required for blood to flow through an image slice and its effect on the resulting signal is known as TOF. Saturation of signals can occur in vessels with slow-moving blood as a result of repeated RF excitation in the acquisition plane. This can create artifacts in vessels with stenotic lesions or reduced blood flow.
Visualization of the arterial system with PC and TOF is adequate5 but has limitations. Acquisition times can be long and prevent imaging within the time span of a single breath-hold. This increases the chance of movement artifacts. Some of the limitations are caused by flow-related artifacts such as in-plane saturation and phase dispersion. Flow-based imaging also has limits in areas of slow flow, such as aneurysms. Overgrading of stenotic lesions is most commonly a manifestation of signal loss in the areas of complex flow. Undergrading is a matter of inadequate spatial resolution. Complex turbulent flow patterns in areas of stenoses can create signal loss and mimic a critical lesion. This is due to “intravoxel dephasing.” An accelerated flow across a stenosis consists of a wide distribution of velocities and thus a large distribution of proton phases. In the smallest volume element, a “voxel” of the image, this distribution of phases can result in cancellation rather than coherent addition of signals, accounting for the presence of signal voids at the site of stenosis. A short TE minimizes flow-phase dispersion artifacts. Phase dispersion is further decreased when voxel size is minimized using thin sections. Small voxels and short TE are most easily obtained with 3D TOF methods. The biggest drawback of the thick volumes used with 3D techniques is that slow or recirculating flow can become saturated. The MOTSA (multiple overlapping thin-slab acquisitions) technique of sequential 3D TOF gives better flow enhancement than single-slab 3D TOF techniques and less dephasing than 2D techniques. However, the need for substantial overlap of adjacent slabs increases acquisition time.
Contrast-Enhanced Magnetic Resonance Angiography
The introduction of CE-MRA has revolutionized MRA.6,7 This technique overcomes many of the limitations of traditional bright blood modalities: respiratory motion artifacts, poor SNR, and flow and saturation-related artifacts (Fig. 13-1C). Gadolinium increases the signal intensity of blood on contrast-enhanced 3D T1-weighted (spoiled) GRE images. Blood contrast is not flow dependent. It is determined by the concentration of contrast agent within the arterial system while imaging data are being collected. Reliable images can be acquired irrespective of whether flow is laminar, turbulent, or stagnant. This technique acquires large-volume data sets in coronal or sagittal orientation within a single breath-hold during the first pass of the contrast material. The contrast agent, gadolinium, is a heavy metal but becomes inert when bound to a chelator. Intravenous (IV) administration of gadolinium-diethylenetriamine pentaacetic acid (DTPA) results in a marked reduction of the T1 or longitudinal relaxation time of blood, therefore reducing the effects of spin saturation. Signal reduction is also problematic in 3D TOF sequences. Moreover, the very short TE reduces spin dephasing and allows accurate evaluation of vascular stenoses.
CE-MRA is limited by venous and soft-tissue enhancement. Contrast media not only passes into venous structures, dependent on the arteriovenous transit time of the tissue, but also rapidly leaks out of the vascular compartment, creating significant tissue enhancement. New “blood pool” agents, which are currently undergoing clinical trials, are retained within blood vessels and selectively enhance the blood pool on T1-weighted MR images. These use either gadolinium compounds that bind to albumin, or are large enough to stay within the vascular space or ultra-small iron particle. Another agent, gadobenate, has a higher T1 relaxation time because of its capacity for weak and transient interaction with serum albumin. This may enhance vascular signal intensity and thus increase diagnostic efficacy at doses comparable to those used for current gadolinium agents. It is approved for imaging use in Europe but is under clinical investigation in the United States. It provides a higher and longer-lasting vascular signal enhancement in the abdominal aorta compared with gadolinium, which does not interact with proteins.8
Gadolinium-based contrast has a very favorable safety profile. However, gadolinium is nephrotoxic. For patients with underlying chronic renal insufficiency, gadolinium chelates can cause acute renal failure. Nephrogenic systemic fibrosis (NSF) is linked to gadolinium-based contrast agents9 and largely involves the skin, though it may also affect the muscle, joints, or internal organs such as the lungs, liver, and heart in patients with renal failure. Nephrogenic systemic fibrosis occurs in patients with severe renal disease who are exposed to high doses of gadolinium agents, or in patients who receive multiple standard doses of contrast agents in a short period of time. The reported prevalence of NSF among patients with glomerular filtration rate (GFR) less than 30 mL/min is 3% to 5%.10 Therefore, the MR protocol should aim to minimize contrast volume, especially in patients with moderate to severe renal failure.11
Metal objects, such as surgical clips, lead to susceptibility artifacts in MRA. The increasing use of stents has important implications for MRA. Cavagna et al. evaluated CE-MRA of seven stent types in the aortic, iliac, and popliteal positions.12 Few of the commonly used stents permitted visualization of the lumen. Susceptibility artifact results in significant signal loss that can preclude proper visualization of the stent lumen even with gadolinium-enhanced MRA. Some nitinol, tantalum, or polytetrafluoroethylene (PTFE)-based devices, on the other hand, cause less artifact on CE-MRA.
Postprocessing Techniques
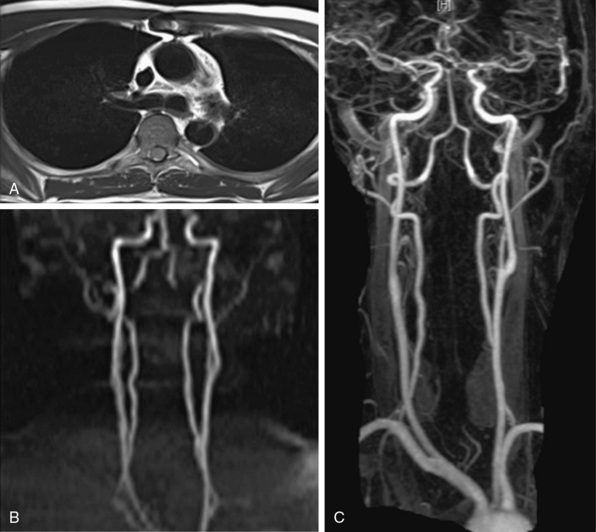
Magnetic resonance data can be viewed as source images or be displayed in projections with any orientation. Image postprocessing allows reformation in any desired plane to improve conspicuity of overlapping vessels (Table 13-3). The origins of the left common carotid artery (CCA) and left subclavian artery, for example, can overlap in coronal projections, whereas the origins of the right subclavian artery and right CCA can overlap in some oblique views. The renal ostia are usually best seen in either coronal or slightly oblique view. The celiac axis and superior mesenteric artery (SMA) are best depicted on sagittal projections. One advantage of MR versus digital subtraction angiography (DSA) is that the latter may require multiple injections to assess the origins of these vessels. The details of image interpretation are beyond the scope of this review, but source image data, multiplanar reconstruction (MPR), maximum-intensity projection (MIP), and volume rendering (VR) are used (Fig. 13-2). Source images are the initial reconstructions and should be used for problem solving and to confirm findings. Interpretation often begins with a vascular survey using MPR and MIP data sets. Multiplanar reconstructions are very useful in volumetric acquisitions because the desired imaging plane can be prescribed to enhance vascular separations. Subtracted MIPs are routinely created from CE-MRA. The noncontrast (mask) images are subtracted from the enhanced images, and resulting high SNR data sets undergo projection of maximum intensity. By performing the projections of all angles around the z-axis of the patient, the data sets can be viewed in cine. These projections are referred to as rotating MIPs.
Table 13-3 Types of Postprocessing Techniques
| Technique | Description |
|---|---|
| MPR | Production of cross-sectional images in planes different from acquisition plane |
| MIP projection | Production of full- or partial-volume images along any desired axis from a stack of image slices |
| Volume rendering | Manipulation of MRI slices to produce full volumetric images; structures segmented for viewing by application of intensity thresholds and removal of unwanted structures |
MIP, maximum intensity projection; MPR, multiplanar reconstruction; MRI, magnetic resonance imaging.
Clinical Applications
Extracranial Carotid and Vertebral Arteries
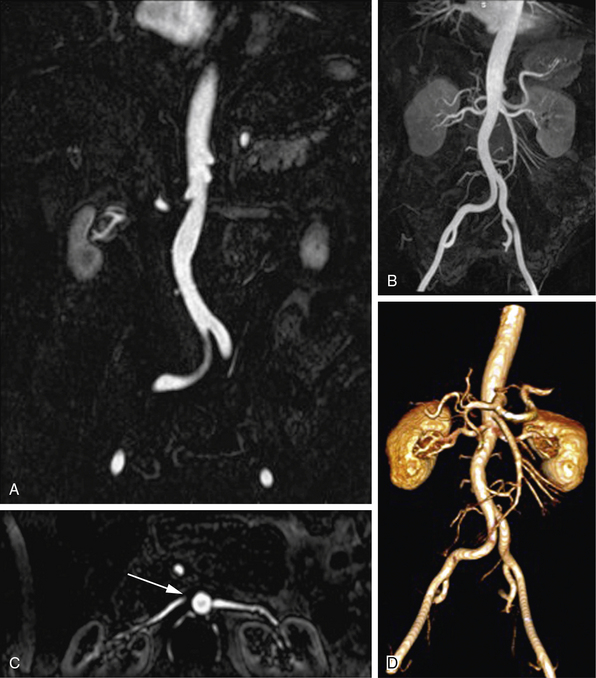
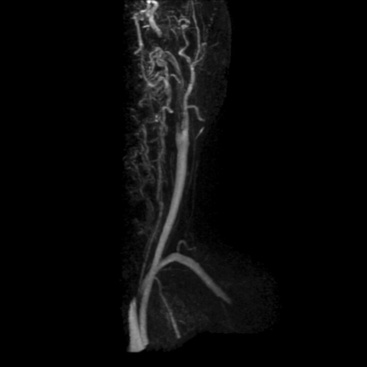
Atherosclerosis, dissection, and inflammatory diseases affect the extracranial carotid and vertebral arteries. Time-of-flight methods (2D and 3D) have been largely replaced by CE-MRA because CE-MRA allows imaging of the entire course of these vessels (Fig. 13-3). A problem with TOF imaging is turbulent flow at or near the carotid bifurcation where most of the lesions occur; this may lead to overestimation of lesion severity. Gadolinium-enhanced MRA has greater SNR than noncontrast imaging, is less sensitive to intravoxel dephasing from turbulence, and does not have signal loss from saturation effects. Phase-contrast sequences can supplement anatomical data for flow direction or quantification.
< div class='tao-gold-member'>
Stay updated, free articles. Join our Telegram channel

Full access? Get Clinical Tree


