Lung Cancer
Introduction/Epidemiology
At the outset of the 21st century, lung cancer remains one of the world’s leading causes of preventable death (1). In the United States alone, it was estimated as recently as 2004 that 173,700 Americans will be diagnosed with lung cancer, and 164,440 will have died of the disease (2). Lung cancer currently accounts for 33% of deaths from cancer in men, compared with carcinoma of the prostate, the second most common cause, which accounts for 14%. Similarly, lung cancer accounts for 24% of cancer deaths in women in the United States compared with 18% caused by breast carcinoma, now the second most common cause of death from cancer in women (3). The 5-year survival of lung cancer remains only 10% to 15%, despite intensive efforts over the past several decades, because most bronchogenic carcinomas are still unresectable when first diagnosed. Complete surgical excision of carcinoma remains the most effective form of therapy and offers the patient the only reasonable hope for cure.
Over the past several years, there has been a growing awareness of important changes in the epidemiology of lung cancer (4). For example, it is now established that adenocarcinomas have supplanted squamous cell carcinoma (SCC) as the most frequent form of the disease, across both genders and all races. Lung cancer remains predominantly a disease caused by tobacco exposure. Despite efforts to eliminate smoking, 50 million Americans still smoke; as important, even among those who do quit, the risk of developing lung cancer remains significantly higher than in never smokers for as long as 30 years (5). Unfortunately, although the rate of smoking in younger individuals has declined, it remains problematic. In addition to tobacco exposure, numerous other causes have been identified and include exposure to asbestos, radon, and a host of chemical agents, including nickel, polycyclic aromatic hydrocarbons, and chromates, among others. In the developing world, concern has also focused on the role of exposure to cooking oils (6).
There is also increasing appreciation of gender and race differences in lung cancer (6). Especially concerning is the epidemic of lung cancer appearing in women, including nonsmokers particularly in Asian populations (7). As reported by Toh et al. (8) in a retrospective study from
Singapore, whereas women comprised 33.8% of all lung cancer patients, they accounted for 73.9% of cancer occurring in nonsmokers. This raises the important question of whether a difference exists in the types and prognoses of cancer in smokers versus nonsmokers. Women have been reported to have longer survival times, especially after surgical resection of early-stage adenocarcinomas (9). In fact, the risk of developing lung cancer is multifactorial, the result of synergistic interactions between environmental causes and genetics (4). Although it is outside the scope of this chapter, awareness of the role of genetic susceptibility to developing cancer represents one of the most important developments over the past decade in our understanding of the epidemiology of this multifaceted disease (10). Understanding these factors is already essential to the development of molecular imaging techniques (11, 12, 13).
Singapore, whereas women comprised 33.8% of all lung cancer patients, they accounted for 73.9% of cancer occurring in nonsmokers. This raises the important question of whether a difference exists in the types and prognoses of cancer in smokers versus nonsmokers. Women have been reported to have longer survival times, especially after surgical resection of early-stage adenocarcinomas (9). In fact, the risk of developing lung cancer is multifactorial, the result of synergistic interactions between environmental causes and genetics (4). Although it is outside the scope of this chapter, awareness of the role of genetic susceptibility to developing cancer represents one of the most important developments over the past decade in our understanding of the epidemiology of this multifaceted disease (10). Understanding these factors is already essential to the development of molecular imaging techniques (11, 12, 13).
Pathology
As most recently specified by the 2004 World Health Organization (WHO), primary lung tumors are classified by their light-microscopic appearance into four broad categories, including adenocarcinoma, SCC, large cell carcinoma, and small cell carcinoma (Table 7-1) (14). Multiple subdivisions of these types have been defined, some of which are based on molecular biologic characteristics. Although these are not currently considered of primary importance for classification, in selected cases, knowledge of immunohistologic subtyping is important for differential diagnosis and may ultimately prove of prognostic and therapeutic value (15). From an imaging standpoint, some distinctions between the various subtypes of non–small cell lung cancer are worth identifying, in particular, between adenocarcinoma and squamous cell carcinoma.
Table 7-1 Histologic and Cytologic Differences between Major Histologic Classes of Lung Cancer | ||||||||||||||||||||
|---|---|---|---|---|---|---|---|---|---|---|---|---|---|---|---|---|---|---|---|---|
| ||||||||||||||||||||
Preinvasive Lesions
In addition to the four basic subtypes of lung cancer, a number of preinvasive lesions have also been identified, including atypical adenomatous hyperplasia (AAH) and diffuse idiopathic neuroendocrine cell hyperplasia (DIPNECH). As described extensively in Chapter 6, AAH is defined as a localized proliferation of mildly to moderately atypical cells lining the alveoli in the absence of underlying inflammation or fibrosis (14). Based on studies showing a variety of molecular alterations, including the frequent finding of k-ras and p53 mutations, AAH is now considered by most to represent a premalignant lesion, part of the spectrum of adenocarcinoma of the lung. These lesions are frequently identified incidentally in lobes resected for primary adenocarcinomas and typically appear as poorly defined ground-glass opacities smaller than 5 mm (Fig. 7-1 and Figs. 6-4, 6-5, 6-6).
Whereas AAH proves to be a common finding, especially on multidetector CT screening studies, DIP-NECH is an exceptionally rare abnormality that is defined by a purely intraepithelial proliferation of neuroendocrine cells,
identifiable on CT either as scattered tiny micronodules or, more characteristically, as a cause of mosaic lung attenuation due to small-airway involvement resulting in diffuse air trapping (16, 17, 18). This entity is frequently associated with multiple pulmonary tumorlets because of a nodular proliferation of airway neuroendocrine cells that extend beyond the epithelium into the adjacent lung. Although usually identified alone, evidence of bronchiectasis may be found as well as an association with carcinoid tumors.
identifiable on CT either as scattered tiny micronodules or, more characteristically, as a cause of mosaic lung attenuation due to small-airway involvement resulting in diffuse air trapping (16, 17, 18). This entity is frequently associated with multiple pulmonary tumorlets because of a nodular proliferation of airway neuroendocrine cells that extend beyond the epithelium into the adjacent lung. Although usually identified alone, evidence of bronchiectasis may be found as well as an association with carcinoid tumors.
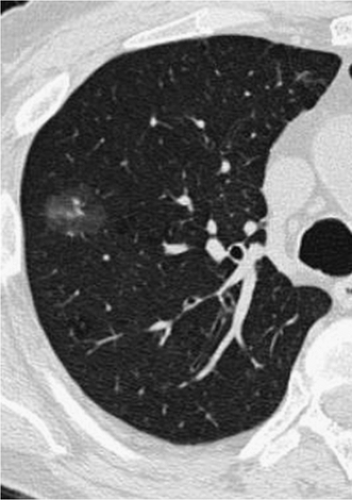 Figure 7-1 Mixed adenocarcinoma with bronchoalveolar cell features. Magnified CT section through the right upper lobe shows a part solid, part ground-glass nodule. Although this lesion appears to be predominantly ground-glass, the finding of a subtle solid component makes this more likely to represent a mixed adenocarcinoma. Accurate histologic diagnosis of these lesions requires that the entire nodule be resected. |
Adenocarcinoma
Currently, adenocarcinoma is the most frequent type of lung cancer identified in both men and women, representing approximately 30% to 35% of all primary lung neoplasms. These tumors most often are initially seen as peripheral lung nodules ranging in density from pure ground-glass to solid lesions, less frequently as central endobronchial lesions. As noted in the 2004 WHO classification, adenocarcinomas are most often heterogeneous, containing more than one subtype in a majority of cases, leading to the newer designation of “adenocarcinoma, mixed type” as the most common form of adenocarcinoma of the lung (Table 7-2) (19). From an imaging standpoint, the most important distinction among the various subtypes of adenocarcinoma is bronchoalveolar cell carcinoma (BAC). Incorporating initial seminal observations by Noguchi et al. (20), we define BAC strictly as a tumor showing only pure lepidic growth without evidence of interstitial or stromal invasion. Although BAC is further subdivided into nonmucinous, mucinous, and mixed types, these distinctions have no apparent radiologic counterparts. Most important, from a diagnostic standpoint, definitive diagnosis requires that the entire lesion be evaluated histologically; the diagnosis should not be made solely on the basis of transbronchial and/or transthoracic needle biopsy, as it is possible that focal areas of invasive adenocarcinoma may otherwise not be identified.
Table 7-2 Adenocarcinoma: 2004 World Health OrganiZation Classification | ||
|---|---|---|
|
Although adenocarcinomas with BAC components are properly classified as adenocarcinomas, mixed subtype, it has been shown that those with prominent BAC features may be further subdivided by additional histologic features, including the size of scars (<5 mm vs. >5 to 15 mm), percentage of lepidic growth, and the presence of vascular invasion, among others (19). These findings are of importance, as a close correlation appears to exist between these features and those identified on CT scans—in particular, the extent of ground-glass attenuation—with important implications for prognosis (Figs. 6-1 and 6-7, 6-8, 6-9, 6-10); specifically, the greater the degree of ground-glass attenuation, the better outcome, with 5-year survival of patients with surgically resected pure BAC defined histologically and pure ground-glass lesions identified by CT as 100% (see Chapter 6). Despite these correlations, at present no consensus exists regarding a definition of “minimally invasive” adenocarcinoma (19). Although most commonly first seen either as solitary or multiple nodules, adenocarcinoma, especially BACs, less commonly appears as diffuse parenchymal consolidation, frequently lobar in distribution (Fig. 7-2) (21). The differential in these cases should include, in particular, primary parenchymal lymphoma. In selected cases in which differentiation between primary and metastatic adenocarcinoma proves problematic, diagnosis may be facilitated by immunohistochemical evaluation. Specifically, it has been shown that thyroid transcription factor (TTF-1) is a highly specific marker for primary lung adenocarcinomas distinct from metastatic adenocarcinoma, positive in approximately 85% of cases (14) (Table 7-3). Histochemical staining may also be of value in differentiating between diffuse adenocarcinoma involving the pleura and mesothelioma.
Squamous Cell Carcinoma
In distinction to adenocarcinoma, SCC more often is initially seen as central lesions resulting in airway obstruction and peripheral atelectasis. Histologically, SCC may be differentiated from adenocarcinoma in particular by the presence of keratinization and intercellular bridges. Only approximately 25% of SCCs appear as peripheral lesions, frequently associated with central cavitation (Fig. 7-3). As a result of involvement of the central airways, patients with SCC often are seen earlier than are those with most cases of adenocarcinoma with cough, fever, or hemoptysis. Unfortunately, as documented by numerous early lung cancer CT screening trials, unlike for peripheral lung nodules that may be identified when they are as small as 3 to 4 mm, CT has proved of little value for early identification of focal airway lesions.
Large Cell Carcinoma
Large cell lung cancers represent approximately 10% of all primary lung neoplasms and are characterized by lacking features of either adenocarcinomas or SCCs. They
typically are first seen as peripheral lung tumors similar to adenocarcinomas, although statistically are more likely to be larger than 3 cm at presentation. As is discussed later, they may also show neuroendocrine features, in which case they are designated large cell neuroendocrine cancer.
typically are first seen as peripheral lung tumors similar to adenocarcinomas, although statistically are more likely to be larger than 3 cm at presentation. As is discussed later, they may also show neuroendocrine features, in which case they are designated large cell neuroendocrine cancer.
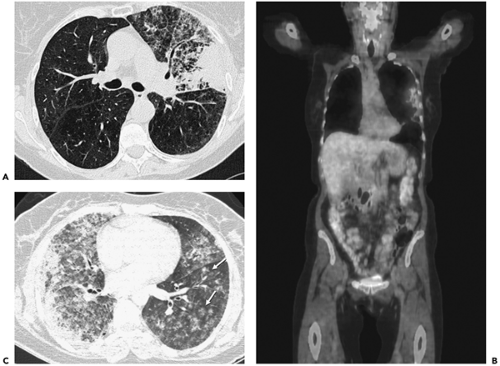 Figure 7-2 Bronchoalveolar cell carcinoma (BAC): lobar distribution. See Color Figure 7-2B. A: Left mid lung shows evidence of dense consolidation in the periphery of the left upper lobe, marginated posteriorly by the left major fissure, associated with a diffuse nodular infiltrate throughout the remainder of the left upper lobe. Many of these nodules appear to be centrilobular in distribution, some with a tree-in-bud configuration. Note that despite extensive disease, no evidence exists of architectural distortion; the anterior segmental bronchus is patent. Although nonspecific, when chronic, these findings are consistent with diffuse tumor manifesting at least in part a pattern of lepidic growth. B: Fluorodeoxyglucose–positron emission tomography (FDG-PET) correlation. Coronal maximum intensity projection image shows intense activity in the lateral aspect of the left upper lobe, corresponding to changes identified in A. No other abnormalities are identified. Although FDG-PET is often negative in cases with solid nodules due to BAC, in this case, PET is of value by further confirming that the disease is restricted to a single lobe and therefore is potentially resectable. C: High-resolution CT section, in a different patient than shown in A and B, demonstrates the appearance of diffuse consolidative BAC. Innumerable ill-defined ground-glass nodules can be identified in portions of the lung less extensively involved (arrows). |
Tumors with Neuroendocrine Morphology
Included in this category are lesions that share common morphologic and immunohistochemical characteristics and include both typical and atypical carcinoid tumors as well as large cell neuroendocrine cancer (LCNEC) and small cell lung cancer (SCLC) (22). Together these lesions account for 25% of primary lung neoplasms. Typical and atypical carcinoid tumors are considered low-grade tumors with few mitoses per high-power field and are currently not considered as a part of a continuum with either LCNEC or SCLC, despite sharing neuroendocrine features. They characteristically appear as well-defined lesions, either peripheral or more commonly central in location, the latter appearing as well-defined endobronchial lesions, approximately one third of which have evidence of calcification and/or ossification (see Figs. 6-15 and 6-16). Carcinoids are also extremely vascular, a feature that is easily identified when scans are performed after a bolus of intravenous contrast media (23).
Both SCC and LCNEC are high-grade tumors. SCC represents approximately 20% of lung cancers and
characteristically is first seen with extensive bulky central tumor (Fig. 7-4), frequently causing obstruction of the superior vena cava, often without a definable primary lesion. SCC is almost always associated with heavy cigarette smoking; only rarely is SCC seen as a solitary lung nodule, occurring in less than 5% of cases, and when found, has no distinguishing imaging features.
characteristically is first seen with extensive bulky central tumor (Fig. 7-4), frequently causing obstruction of the superior vena cava, often without a definable primary lesion. SCC is almost always associated with heavy cigarette smoking; only rarely is SCC seen as a solitary lung nodule, occurring in less than 5% of cases, and when found, has no distinguishing imaging features.
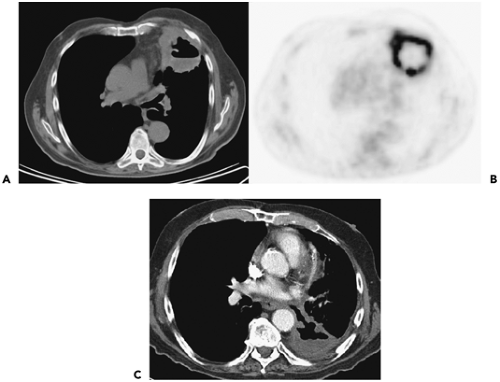 Figure 7-3 Squamous cell carcinoma (SCC). A: Non–contrast-enhanced CT image through the left upper lobe shows a thick-walled irregular cavity within which a discrete air-fluid level is identified. Note that this lesion marginates the mediastinum anteriorly and the pleura and chest wall anterolaterally, without definite evidence of either mediastinal or chest-wall invasion. Note the absence of obvious mediastinal adenopathy or effusion. Although this appearance is consistent with a cavitary SCC, especially in the absence of signs of infection or vasculitis, neither mediastinal nor pleural/chest wall invasion can be excluded, pointing out the limitations of CT for differentiating between T3 and T4 lesions. The presence of an air-fluid level is also nonspecific, consistent either with superimposed infection or hemorrhage. B: Fluorodeoxyglucose–positron emission tomography (FDG-PET) correlation. Corresponding axial image demonstrates similar findings as shown in A. Although PET images are of limited use for establishing mediastinal or pleural/chest-wall invasion, in this case, PET is of value by excluding significant mediastinal or hilar adenopathy, or remote pleural malignancy. C: Contrast-enhanced CT study in a different patient than shown in A and B also shows a thick-walled cavitary mass occupying most of the left lower lobe. In this case, direct communication is found between the tumor and the left lower lobe bronchus. Histologically verified SCC. |
Table 7-3 Frequencies of Positive Immunohistochemical Results for Lung Carcinomas of Various Histologic Types by Marker | ||||||||||||||||||||||||||||||||||||||||||||||||||||||||||||||||||||||||||||||||||||||||||||||||||||||||||||||
|---|---|---|---|---|---|---|---|---|---|---|---|---|---|---|---|---|---|---|---|---|---|---|---|---|---|---|---|---|---|---|---|---|---|---|---|---|---|---|---|---|---|---|---|---|---|---|---|---|---|---|---|---|---|---|---|---|---|---|---|---|---|---|---|---|---|---|---|---|---|---|---|---|---|---|---|---|---|---|---|---|---|---|---|---|---|---|---|---|---|---|---|---|---|---|---|---|---|---|---|---|---|---|---|---|---|---|---|---|---|---|
| ||||||||||||||||||||||||||||||||||||||||||||||||||||||||||||||||||||||||||||||||||||||||||||||||||||||||||||||
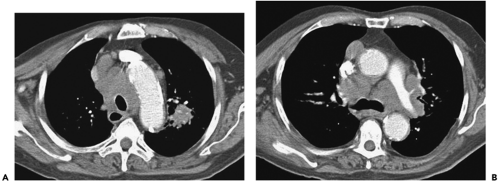 Figure 7-4 Small cell carcinoma. A, B: Contrast-enhanced CT images at the level of the aortic arch and carina show the characteristic appearance of bulky adenopathy involving all visualized mediastinal compartments. Whereas some nodes appear discrete, others appear coalescent, a finding consistent with extranodal spread. Note that in this case, a spiculated nodule appears in the medial aspect of the left upper lobe in A, likely the primary tumor. |
Large cell neuroendocrine carcinomas, although classified as large cell tumors, show features of neuroendocrine differentiation, falling between atypical carcinoids and SCC in aggressiveness. The diagnosis of these tumors requires demonstration of specific neuroendocrine markers, including, for example, chromogranin A, synaptophysin, or neural cell adhesion molecule (14,23). LCNEC accounts for approximately 3% of resected lung cancers and 19% of neuroendocrine tumors (23). Although both SCC and LCNEC are aggressive neuroendocrine lesions with a poor prognosis, they differ importantly in that SCC typically responds to chemotherapy in distinction to LCNEC, for which surgery is the primary method of therapy.
It should be noted that neuroendocrine markers may be identified in as many as 20% of non–small cell lung cancers (NSCLCs), which are accordingly designated non– small cell lung cancers with neuroendocrine differentiation (NSCLC-NDSCC). Furthermore, both SCC and LCNEC may occur in combination with NSCLC, as well as with each other, so-called “combined SCC/LCNEC” tumors.
Miscellaneous Lung Tumors
In addition to the main variants described earlier, a number of additional lesions may be encountered, including adenosquamous cell cancer, pleomorphic carcinomas with sarcomatous features, and carcinomas of salivary gland type, including both mucoepidermoid and adenoid cystic carcinomas (14). Of these, the most distinctive radio-graphically are the salivary gland tumors, as they typically involve the trachea and proximal mainstem bronchi.
Non–Small Cell Lung Cancer
TNM Classification
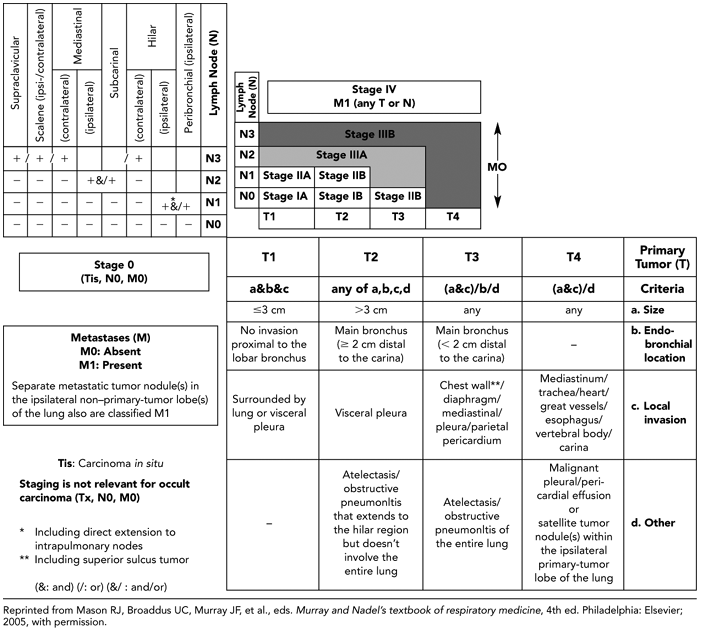
Accurate staging is critical in the selection of treatment and in the evaluation of prognosis in patients with bronchogenic carcinoma. The responsibility for accurate staging is shared by the surgeon, pulmonologist, radiologist, and pathologist (24). A uniform staging system enables every participant in the management of the patient to communicate results unambiguously. Familiarity with the current staging system for lung cancer as proposed by the International System for Staging Lung Cancer and Regional Lymph Nodes is essential to an understanding of the role of imaging in the assessment of these patients (Table 7-4) (see refs. 29,82,83).
The staging system devised for lung cancer has evolved over the years, after the establishment of the American Joint Committee on Cancer and End Results Reporting (AJCC) in 1959. In 1970, the task force on lung cancer of the AJCC adopted the TNM system originally proposed by Pierre Denoix (25). Lung cancer stage is determined by the extent of the primary tumor (T), the presence of intrapulmonary, hilar, or mediastinal lymph node metastases (N), and the presence of extrathoracic metastases (M). Small cell carcinoma is still staged as either limited or extensive disease and consequently is considered separately (26).
Table 7-4 Definition of Primary Tumor, Nodal Involvement, and Distant Metastases (TNM) Characteristics in Lung Cancer | ||||||||||||||||||||||||||||||||||||||
|---|---|---|---|---|---|---|---|---|---|---|---|---|---|---|---|---|---|---|---|---|---|---|---|---|---|---|---|---|---|---|---|---|---|---|---|---|---|---|
| ||||||||||||||||||||||||||||||||||||||
The initial classification scheme was published in 1973, and a modified version appeared in 1979 (27,28). At the World Conference on Lung Cancer in 1985, a new uniform international staging system was adopted (see ref. 43). This system, based largely on the prior AJCC formulation, has successively been modified to reflect changes in the therapeutic approach to lung cancer. The present International Staging System for Lung Cancer (ISSLC), revised in 1997, again has two major components: anatomic extent of disease (TNM) and cell type (29; see refs. 82,83).
Primary Tumor Extent
T is the descriptor given to the primary tumor and its local extent. The precise definitions are given in Table 7-4. As pertains to radiologic interpretation, T staging is subdivided in four groups: T1 to T4. T1 lung cancer is a tumor that is 3 cm or less in greatest dimension, is surrounded by lung or visceral pleura, and has no evidence of invasion proximal to a lobar bronchus at bronchoscopy.
T2 lung cancer is a tumor more than 3.0 cm in greatest diameter, or a tumor of any size that invades the visceral pleura or has associated atelectasis or obstructive pneumonitis extending to the hilar region.
T3 lung cancer is defined as a tumor of any size with direct extension into the chest wall (including superior sulcus tumors), diaphragm, or the mediastinal pleura or pericardium without involving the heart, great vessels, trachea, esophagus, or vertebral body, or a tumor in the main bronchus within 2 cm of the tracheal carina without involvement of the carina (Table 7-4). This may be associated with either atelectasis or obstructive pneumonitis involving the entire lung.
In distinction to T3, T4 tumors may be of any size when evidence exists of invasion of the heart or mediastinal organs, including the great vessels, trachea, esophagus, or carina. Additional qualifiers include direct invasion of vertebral bodies or evidence of malignant pleural or pericardial effusions. Importantly, in comparison with prior staging systems, the current ISSLC classification also includes lesions with satellite tumor nodule(s) within the ipsilateral primary-tumor lobe of the lung (29).
Nodal Disease
The descriptor N refers to the presence or absence of regional lymph node metastases (Fig. 7-5). The definitions proposed in the 1997 ISSLC revision are listed in Table 7-1
and include anatomic landmarks for 14 hilar, intrapulmonary, and mediastinal lymph node stations (Table 7-5). It should be emphasized that although prognosis is affected by the number and size of involved nodes, as well as the levels of involvement, and intracapsular versus extracapsular, or microscopic versus macroscopic nodal disease, these characteristics are not considered in the current TNM staging system.
and include anatomic landmarks for 14 hilar, intrapulmonary, and mediastinal lymph node stations (Table 7-5). It should be emphasized that although prognosis is affected by the number and size of involved nodes, as well as the levels of involvement, and intracapsular versus extracapsular, or microscopic versus macroscopic nodal disease, these characteristics are not considered in the current TNM staging system.
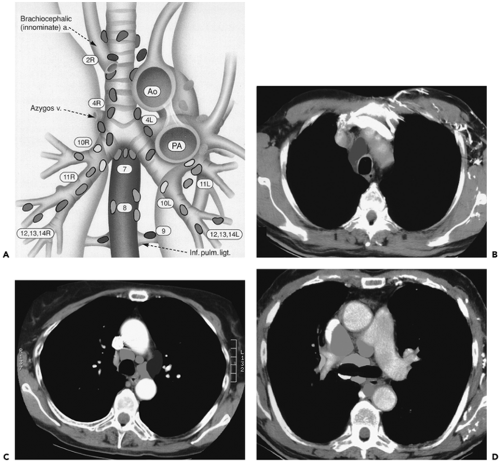 Figure 7-5 Nodal mapping. See Color Figure 7-5A,B,C,D. A: Diagram depicting intrathoracic nodal groups as classified by the International Staging System. B–D: Color-coded cross-sectional images illustrating the location of high paratracheal nodes (B), aortopulmonary window nodes (C), and pericarinal nodes (D), respectively. (From Ko JP, Drucker EA, Shepard JO, et al. CT Depiction of regional nodal stations for lung cancer staging. Am J Roentgenol. 2000;174:775–782 , with permission.) |
N0 indicates no demonstrable metastases to regional lymph nodes. Only 10% to 15% of patients have N0 status at diagnosis. N1 status is characterized by direct tumor extension or metastases to ipsilateral peribronchial or hilar nodes. These nodes are all within the lung and are completely covered by pleura. Although the presence of N1 disease adversely affects prognosis, it usually does not affect resectability. However, N1 status may necessitate a pneumonectomy (rather than a lobectomy) for total removal of disease.
N2 status includes all patients with ipsilateral mediastinal lymph node or subcarinal lymph node involvement. Subcarinal nodes remain N2 despite the fact that in a few series, when careful nodal analysis was undertaken, metastases to the subcarinal lymph nodes carried a poor prognosis (30, 31, 32). Some disagreement exists about the significance of uppermost ipsilateral mediastinal lymph node involvement,
which is listed as a contraindication for surgical resection by some authors (33,34) but not by others (35).
which is listed as a contraindication for surgical resection by some authors (33,34) but not by others (35).
Table 7-5 Lymph Node Map Definitions | ||||||||||||||||||||||||||||||||||||||||||||||||||||||
|---|---|---|---|---|---|---|---|---|---|---|---|---|---|---|---|---|---|---|---|---|---|---|---|---|---|---|---|---|---|---|---|---|---|---|---|---|---|---|---|---|---|---|---|---|---|---|---|---|---|---|---|---|---|---|
| ||||||||||||||||||||||||||||||||||||||||||||||||||||||
N3 status includes metastases to contralateral mediastinal, contralateral hilar, and both ipsilateral and contralateral supraclavicular nodes. Although, as is discussed later, some controversy surrounds the interpretation of N2 disease, there is general agreement that N3 status implies nonresectability. It should be emphasized that in selected cases, N3 status may be conferred as the result of clinical sequelae, as in patients with signs of recurrent laryngeal nerve involvement. It should also be noted that in the current staging system, both ipsilateral and contralateral supraclavicular and scalene nodes are designated “regional” nodes because radiotherapists can include them in the radiation therapy portal. Consequently, metastases to the scalene and supraclavicular nodes are classified as N3 rather than M1.
Distant Metastases
The descriptor M relates to the presence of distant metastases (M1) or their absence (M0) (Table 7-4). Although scalene, cervical, and contralateral hilar nodes are not considered evidence of distant metastases, one of the most important changes introduced in the 1997 ISSLC classification was altering M1 status to include patients with separate metastatic tumor nodules in the ipsilateral non– primary-tumor lobe(s) of the lung (29). Extrathoracic metastases are present in approximately 40% of patients
with newly diagnosed bronchogenic carcinoma (36) and carry a very poor prognosis (Fig. 7-6). Unfortunately, clinically silent sites of distant metastatic disease are frequently discovered post mortem. Mathews et al. (37) studied 200 patients who died within 30 days of presumed curative surgery. At autopsy, 48 (23.4%) of these patients had metastases, 18 of them to the adrenal gland and 16 to the liver. In a comparable population, a 26% incidence of extrathoracic metastases was found at autopsy (38). In a study of 95 patients with bronchogenic carcinoma in whom preoperative CT scan showed a solitary lung mass without evidence of hilar or mediastinal lymphadenopathy, 25% had extrathoracic metastases (39). Interestingly, in this same study, the majority of these patients (67%) had adenocarcinoma. More recently, Finke et al. (40) reviewed autopsy results performed within 30 days of surgery in a total of 32 patients who had undergone curative resection of NSCLC and identified extrathoracic metastases in 5 (16%) patients, including in the liver in two patients and the lung, epicardium, adrenal gland, and kidney in one patient each.
with newly diagnosed bronchogenic carcinoma (36) and carry a very poor prognosis (Fig. 7-6). Unfortunately, clinically silent sites of distant metastatic disease are frequently discovered post mortem. Mathews et al. (37) studied 200 patients who died within 30 days of presumed curative surgery. At autopsy, 48 (23.4%) of these patients had metastases, 18 of them to the adrenal gland and 16 to the liver. In a comparable population, a 26% incidence of extrathoracic metastases was found at autopsy (38). In a study of 95 patients with bronchogenic carcinoma in whom preoperative CT scan showed a solitary lung mass without evidence of hilar or mediastinal lymphadenopathy, 25% had extrathoracic metastases (39). Interestingly, in this same study, the majority of these patients (67%) had adenocarcinoma. More recently, Finke et al. (40) reviewed autopsy results performed within 30 days of surgery in a total of 32 patients who had undergone curative resection of NSCLC and identified extrathoracic metastases in 5 (16%) patients, including in the liver in two patients and the lung, epicardium, adrenal gland, and kidney in one patient each.
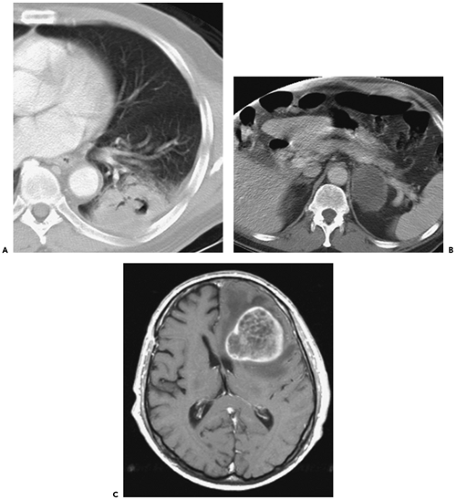 Figure 7-6 Squamous cell carcinoma: metastatic disease. A: Enlarged CT section through the left lower lobe shows a cavitary thick-walled lesion consistent with squamous cell carcinoma. Note an apparent filling defect within the cavity, in this case consistent with intracavitary hemorrhage. B: Magnified CT image shows the characteristic appearance of a heterogeneous adrenal metastasis on the left side. C: Gadolinium-enhanced MRI showing a rim-enhancing left frontal lesion associated with extensive edema, causing considerable mass effect. |
Brain metastases are the most frequent site of distant metastatic disease in patients without lymph node disease (Fig. 7-6). Although more often occurring in patients with SCLC, overall, in approximately 15% of patients with NSCLC, brain metastases will develop within 5 years after resection (41). The likelihood of developing brain metastases increases with increasing tumor stage (42). Although brain lesions clearly fall into the category of distant metastases, interestingly, no differentiation is made between solitary and multiple brain metastases, although isolated brain metastases may be an indication for surgical resection. Whereas resection of solitary brain metastases is indicated, unfortunately, as documented by one recent study, the 5-year survival rate in patients with operable brain metastases remains identical, regardless of initial stage, equivalent to survival in patients with stage IIIA disease at 23% (41).
Stage Groupings
Based on comparable extent of disease, anticipated treatment, and prognosis, TNM subsets have been defined corresponding to four stages of disease, not including carcinoma in situ (Fig. 7-7 and Table 7-6). Initially formulated on the basis of results of careful studies by Mountain (43) of the prognostic factors and treatment outcomes in 3,753 patients treated in tertiary care facilities (43), modifications have been adopted most recently in 1997 (29). The most important of these include dividing previous stage 1 and stage II disease into stage IA, IB, IIA, and IIB categories; the assignment of T3N0M0 to stage IIB; the designation of satellite lesions in the same lobe as the primary tumor as T4; and the assignment of primary lesions with synchronous satellite tumor within any other lobe as M1 disease.
As noted, in the latest classification, stage I is now subdivided into IA (T1N0M0) and IB (T2N0M0) categories to reflect differences in survival between these two groups; 67% of patients with surgical–pathologic stage IA disease survive 5 years compared with 57% with stage IB disease (29).
Similarly, the new classification calls for subdividing previous stage II disease into IIA (T1N1M0) and IIB (including both T2N1M0 and T3N0M0), reflecting the prognostic implications of hilar nodal status, tumor size, and tumor location (including extrapulmonary extension in the absence of adenopathy); 55% of patients with stage IIA survive 5 years compared with 38% and 39% of patients with T2N1M0 and T3N0M0 tumors, respectively (29). It should be noted that as part of this revision, T3N0M0, previously classified as stage IIIA, is now considered stage IIB (Table 7-6 and Fig. 7-7).
Modifications in the stage III classifications include reclassifying T3N0M0 as stage IIB, as noted earlier to reflect the generally better prognosis of peripheral lesions with limited focal chest-wall invasion. Otherwise, stage III remains unchanged, albeit heterogeneous, subdivided into two subgroups. Stage IIIA (T3N1M0 or T1-T3N2M0) represents patients with advanced disease in whom extensive surgery (including resection of all ipsilateral and subcarinal lymph nodes) may be of value. Stage IIIB includes all cases of more advanced disease without distant metastases for which surgery is generally contraindicated. Stage IV represents any patient with evidence of distant metastases.
Current Controversies
Although the current ISSLC proposed in 1997 has proved a consistent and reliable method for assessing prognosis, a number of questions and controversies regarding this system have arisen.
In one study, for example, assessing the reliability of the new staging system when applied to an unselected lung cancer population, each stage and substage accurately reflected differences in survival (with the sole exception of stage IIA, for which insufficient numbers of cases were available for statistically meaningful evaluation). However, comparing the 1986 and the 1997 classifications, no substantial differences were observed in a cohort of 1,296 consecutive patients (p < 0.0001), leading these authors to speculate that simple reliance on TNM descriptors alone might represent an improvement over the current staging system (44).
Although a complete review of potential limitations of the current staging system is outside the scope of the present review, a number of issues seem especially likely to lead to revisions when the newest recommendations are reported in 2007 (45). These include, among others, substaging stage 1 to reflect current data regarding differences in prognosis among T1 lesions of different sizes; re-evaluation of the significance of satellite lesions, especially those identified in the same lobe as the primary tumor; and the significance of small pleural effusions identified only by CT.
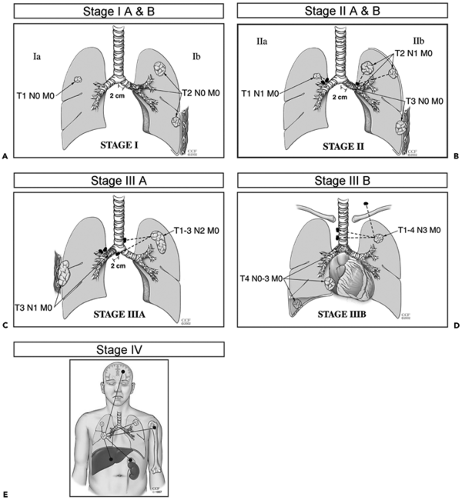 Figure 7-7 A–E: Diagrammatic representations depicting stage IA through IV non–small cell lung cancer, respectively. See Color Figure 7-7A,B,C,D,E. (Images courtesy of Thomas W. Rice, MD. Reprinted with permission of The Cleveland Clinic Foundation.) |
Substaging Stage I Lung Cancer
One question that has received considerable attention is whether the size of T1 lesions matters. At present, T1 lesions are defined as smaller than 3 cm. However, growing evidence—most recently derived from data obtained from low-dose lung cancer screening trials—indicates that not all T1 lesions have the same prognosis, raising the question of whether substaging of stage I lesions should be performed (46). In a review of 7,620 stage I patients with NSCLCs undergoing curative resections, by using data compiled from the Surveillance, Epidemiology, and End Results (SEER) 2003 registry, for example, Wisnivesky et al. (47)
divided lesions into those between 5 and 15 mm, 16 and 25 mm, 26 and 35 mm, 36 and 45 mm, and larger than 45 mm in size, respectively, and showed statistically higher cure rates for all categories of tumors (p < 0.05) except those between 26 and 35, and 36 and 45 mm (47). Gajra et al. (48), in a retrospective review of 246 consecutive patients with pathologically proved stage IA cancers, divided cases into those with lesions 1.5 cm or larger (n = 86) and those with lesions measuring 1.6 to 3.0 cm (n = 160) and showed a significantly improved overall 5-year survival in the group with smaller lesions (85.5% vs. 78.6%, respectively; p = 0.05). In a similar study evaluating 130 consecutive resections for pathologic stage IA NSCLCs, in which lesions were classified as 0 to 20 mm versus 21 to 30 mm in size, with a median follow-up of 6.8 years, reported by Birim (49), both the 5-year disease-free interval and overall survival proved superior for smaller lesions (68% vs. 48% and 69% vs. 51%, respectively, for lesions smaller than versus larger than 2 cm).
divided lesions into those between 5 and 15 mm, 16 and 25 mm, 26 and 35 mm, 36 and 45 mm, and larger than 45 mm in size, respectively, and showed statistically higher cure rates for all categories of tumors (p < 0.05) except those between 26 and 35, and 36 and 45 mm (47). Gajra et al. (48), in a retrospective review of 246 consecutive patients with pathologically proved stage IA cancers, divided cases into those with lesions 1.5 cm or larger (n = 86) and those with lesions measuring 1.6 to 3.0 cm (n = 160) and showed a significantly improved overall 5-year survival in the group with smaller lesions (85.5% vs. 78.6%, respectively; p = 0.05). In a similar study evaluating 130 consecutive resections for pathologic stage IA NSCLCs, in which lesions were classified as 0 to 20 mm versus 21 to 30 mm in size, with a median follow-up of 6.8 years, reported by Birim (49), both the 5-year disease-free interval and overall survival proved superior for smaller lesions (68% vs. 48% and 69% vs. 51%, respectively, for lesions smaller than versus larger than 2 cm).
Table 7-6 TNM Staging of Lung Cancer | ||
|---|---|---|
|
It should be noted that not all reports have concluded that subdividing T1 lesions will necessarily lead to altered prognosis (Fig. 7-8). In one retrospective study of 510 patients with pT1N0MO lesions who were identified from a tumor registry and were undergoing resection, no statistically
significant relationship could be established between survival and tumor size for lesions smaller than 3 cm (p = 0.701) (50). Although these data contradict the notion of the need to substage stage I lesions, it should be noted that reported observed survival in this study was based on deaths from all causes rather than disease-free survival or overall survival. Furthermore, although only 26 (5%) patients had lesions smaller than 1 cm, 80% of lesions measured between 2 and 3 cm, 90% of which proved resectable, suggesting that advanced-stage cancers were commonly not registered as nonsurgical candidates. A question remains whether this particular study had sufficient power, as only 62 deaths were reported among the 510 patients studied (51). It should be emphasized that not all lesions smaller than 2 cm are necessarily earlier-stage lesions. In fact, 21% of clinical stage IA lesions prove to have mediastinal adenopathy at the time of diagnosis, whereas in 24%, evidence exists of distant metastases, 13% at the time of diagnosis and 11% within 1 year (52). Nonetheless, the likelihood of adenopathy in particular does appear to be related to T status. In one retrospective study of 503 patients with completely resected NSCLCs 3 cm or smaller, lesions larger than 2 cm proved twice as likely to have nodal metastases as did those 2 cm or smaller (53). Furthermore, by using multivariate analysis, only tumor size proved to correlate with nodal status (53).
significant relationship could be established between survival and tumor size for lesions smaller than 3 cm (p = 0.701) (50). Although these data contradict the notion of the need to substage stage I lesions, it should be noted that reported observed survival in this study was based on deaths from all causes rather than disease-free survival or overall survival. Furthermore, although only 26 (5%) patients had lesions smaller than 1 cm, 80% of lesions measured between 2 and 3 cm, 90% of which proved resectable, suggesting that advanced-stage cancers were commonly not registered as nonsurgical candidates. A question remains whether this particular study had sufficient power, as only 62 deaths were reported among the 510 patients studied (51). It should be emphasized that not all lesions smaller than 2 cm are necessarily earlier-stage lesions. In fact, 21% of clinical stage IA lesions prove to have mediastinal adenopathy at the time of diagnosis, whereas in 24%, evidence exists of distant metastases, 13% at the time of diagnosis and 11% within 1 year (52). Nonetheless, the likelihood of adenopathy in particular does appear to be related to T status. In one retrospective study of 503 patients with completely resected NSCLCs 3 cm or smaller, lesions larger than 2 cm proved twice as likely to have nodal metastases as did those 2 cm or smaller (53). Furthermore, by using multivariate analysis, only tumor size proved to correlate with nodal status (53).
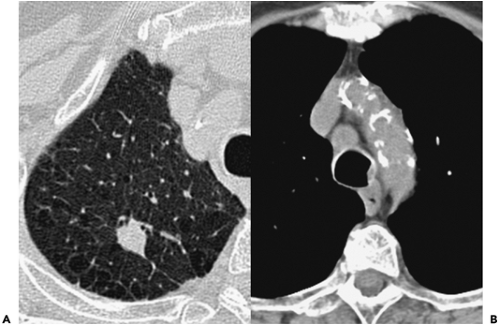 Figure 7-8 Peripheral adenocarcinoma, stage IIIA disease. A: Magnified view through the right upper lobe imaged with lung windows shows an approximate 1.5-cm well-defined peripheral nodule. B: Magnified view of the mediastinum at the level of the aortic arch shows an enlarged right paratracheal node (4R). Density along the left lateral edge of the trachea is consistent with retained secretions. This case illustrates that even small lesions (<2 cm) may still be biologically aggressive. Metastatic nodal disease was biopsy confirmed. |
To date, the most compelling data supporting the notion that smaller size conveys an earlier stage have been obtained from low-dose (LD) CT screening trials. In one study, of a total of 28,689 asymptomatic individuals screened with LDCT, 464 lung cancers were diagnosed, including 436 NSCLCs (376 prevalence cancers, 88 incidence cancers) further categorized by both size and consistency (53a). Of these, surgical staging was obtained in 368 (84%) of 426 patients. Stage IA tumors were identified in 91% of solid lesions smaller than 15 mm, 83% of solid lesions between 16 and 25 mm, 68% of solid lesions between 26 and 35 mm, and 55% of solid lesions measuring greater than 36 mm.
Although reasons exist to consider subdividing stage IA lesions into T1a and T1ab, there is no consensus as to the appropriate size cut-off. Further confounding interpretation, most studies, to date, have failed to take into account the morphology of lesions as established by CT—specifically, whether lesions are subsolid ground-glass opacities, mixed solid–subsolid, or solid lesions.
It should also be noted that a similar rationale has been offered to distinguish between T1 and T2 lesions. In one study, for example, using 5 cm as a cut-off compared with lesions measuring between 3 and 5 cm, a significant difference in survival was noted (46% vs. 61%) (46), leading to the suggestion that lesions larger than 5 cm should be reclassified as T3 (54).
Synchronous Satellite Lesions
Also controversial is the significance of synchronous satellite lesions. It has been suggested, for example, that classification of synchronous pulmonary nodules in the same lobe as the primary tumor as T4 stage IIIB lesions is unwarranted (Figs. 7-9 and 7-10). To date, several studies have shown that the finding of synchronous satellite lesions in
the same lobe as the primary tumor does not necessarily imply a worse prognosis, especially when these are dis-covered only incidentally at the time of surgical resection (55,56). As reported by Shimizu et al. (57), for example, in a study of 42 patients with satellite lesions in the same lobe as primary tumors not detected before surgery, a significant improvement in survival was noted at 2 years (41.5% vs. 20%) when compared with synchronous lesions identified in different lobes. This difference in prognosis may reflect differences in the manner in which disease is spread, with satellite lesions in the same lobe as the primary lesions resulting from local pulmonary arterial invasion and
subsequent embolization rather than true hematogenous metastatic disease (45). Determining whether a synchronous satellite lesion represents a true second primary versus a metastatic lesion remains problematic, especially when they have similar histologic appearances. Similar difficulty is encountered when differentiating metachronous pri-maries from recurrent metastatic disease. As suggested by Martini and Melamed (58), synchronous tumors are defined either as having different histology, or if the same histology is present, defined as synchronous if they are identified in different segments, lobes, or the contralateral lung, provided no evidence of tumor is found in lymphatics common to both lesions, and no evidence of metastatic disease is seen. Identical guidelines have been proposed as well for differentiating metachronous primaries from recurrent metastatic lesions.
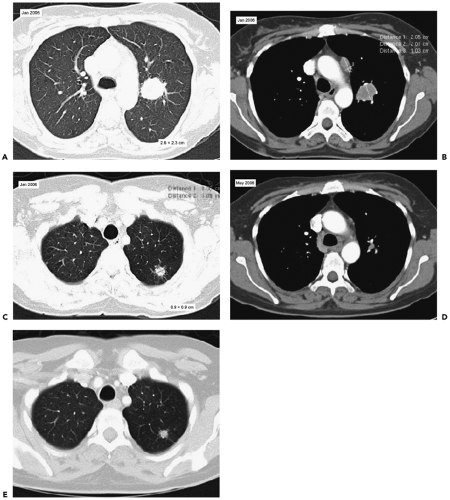 Figure 7-9 Tumor staging: T4 satellite lesions. A: CT section at the level of the carina imaged with lung windows shows a 2.6 × 2.3–cm irregular nodule in the medial aspect of the left upper lobe. B: Contrast-enhanced CT section at approximately the same level as in A shows an enlarged ipsilateral anterior mediastinal para-aortic (station 6) node. Based on these images, this represents a stage II (T2N2M0) lesion. C: Section several centimeters above A shows an approximate 9 × 9-mm satellite lesion in the same lobe. This finding technically results in this tumor being restaged as stage IIIB (T4). D: Follow-up contrast-enhanced CT section at the same level as shown in B obtained 3 months after adjuvant chemotherapy, showing an apparent complete response. E: Section obtained at the same time as D shows that whereas the primary lesions has nearly completely disappeared, this satellite lesion has only marginally decreased in size. This case illustrates the difficulty in accurately assessing the significance of satellite lesions in the absence of definitive histologic staging as well as the limitations of CT in predicting response to therapy. This patient is currently awaiting definitive surgical resection. |
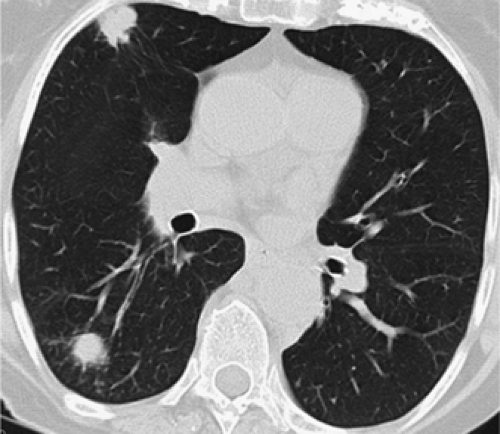 Figure 7-10 Tumor staging: synchronous cancers vs. metastatic disease. CT section shows two discrete nodules of approximately the same size in the superior segment of the right lower lobe and the middle lobe, respectively, in the absence of obvious hilar or mediastinal adenopathy (not shown). Although subtle differences are seen in their morphology, it is not possible, on the basis of this image, to differentiate two synchronous primary lesions from one dominant lesion and a metastasis involving a different lobe. In the absence of mediastinal adenopathy or evidence of extrathoracic disease, both lesions should be considered resectable. At surgery, both proved to be adenocarcinomas. Lack of lymphatic involvement is consistent with presumed synchronous lesions. |
Although of proven value, these guidelines were proposed based on routine radiographic evaluation before the widespread availability of CT scanners. Numerous studies have subsequently established that subcentimeter lesions as small as only a few millimeters, impossible to identify with chest radiography, may be identified in as many as 60% of asymptomatic individuals with multidetector CT, the vast majority of which prove to be benign (59). This suggests that the finding of a subcentimeter nodule—one unlikely to be identified on a routine chest radiograph—should not necessarily be construed as evidence of T4 status and in our opinion should not in itself preclude surgery (45). Determination of acceptable CT characteristics to differentiate between these subsets of patients presumably must await further prospective evaluation.
Pleural Effusions Identified Only by Computed Tomography
As noted in the 1997 revision, tumors associated with malignant effusions are currently defined as T4 lesions. As cytology is frequently negative despite malignant pleural disease, it has been proposed that the finding of a hemorrhagic and/or exudative effusion in itself could also be considered malignant (29). Some have argued that the finding of a malignant effusion should more properly be considered M1 disease, as the prognosis in these cases is similar to the finding of extrathoracic disease. Interpreting the significance of pleural effusions has become more problematic, as it is not infrequent for small quantities of pleural fluid to be identified by CT, otherwise impossible to identify on routine chest radiographs and too small to aspirate easily. Although not directly addressed by the current staging system, it is likely that many of these will prove to be benign, especially in the absence of CT evidence of pleural thickening or loculation. Although the potential for fluorodeoxyglucose–positron emission tomography (FDG-PET) to differentiate more definitively between benign and malignant pleural and/or pericardial effusions is currently under evaluation, definitive guidelines regarding the use of FDG-PET for this purpose remain to be established (60, 61, 62).
Additional Staging Issues
In addition to reconsidering the need to substage stage I lesions, re-evaluate the staging of satellite lesions, and determine the significance of small effusions identified only by CT, a number of relatively rarer presentations of lung cancer occur that differ from predicted outcomes by the current staging system. Patients with skip mediastinal lymph node metastases, for example, have a slightly better prognosis than do patients in whom both hilar and mediastinal nodes are identified (63). Similarly, better outcomes have been described in patients with so-called “early hilar lung cancer (EHLC).” As defined by the Japan Lung Cancer Society, EHLC is a T1N0M0 cancer that is located in a segmental, lobar, or main bronchus with invasion limited to the bronchial wall. Terzi et al. (64), in a study of 29 patients with squamous cell tumors conforming to this definition, not surprisingly reported a 5-year cumulative survival rate after resection of 96%. A number of interventional bronchoscopic approaches to these focal endobronchial lesions have been proposed, including brachytherapy and electrocautery, among others, with varying results (65).
The importance of histologic evidence of blood vessel invasion has also been questioned (66), as has the significance of microscopic nodal disease, with implications for the use of routine immunohistochemical staining (15). It has been shown, for example, that in patients with histologic evidence of N0 disease, immunohistochemical analysis may reveal otherwise unsuspected micrometastases in as many as 40% of cases, leading to statistically
poorer survival (15). A similar impact on survival has been described in cases in which evidence is found of blood vessel invasion by the primary tumor. In one study of 72 patients with T1–3N0 disease undergoing resection, although the overall 5-year survival equaled 62.5%, in cases with documented blood vessel invasion, the survival rate was only 23.5% (66). Although these issues have clear therapeutic implications, it is unlikely that they will result in specific stage modifications.
poorer survival (15). A similar impact on survival has been described in cases in which evidence is found of blood vessel invasion by the primary tumor. In one study of 72 patients with T1–3N0 disease undergoing resection, although the overall 5-year survival equaled 62.5%, in cases with documented blood vessel invasion, the survival rate was only 23.5% (66). Although these issues have clear therapeutic implications, it is unlikely that they will result in specific stage modifications.
Multidisciplinary Imaging in the Evaluation and Staging of Lung Cancer
Computed Tomography Evaluation
There is no optimal CT technique to stage lung cancer. Even in the era of multidetector CT scanners, each study should reflect an initial estimate of the probable stage of disease based on routine chest radiographs as well as an estimate of the patient’s clinical status. For example, in patients with suspected stage IA disease in whom a diagnosis of malignancy has not yet been established, initial scans should be obtained before the administration of intravenous contrast, using thin (1.5 to 2 mm) sections to measure tissue density accurately. In selected cases, further evaluation using contrast enhancement to evaluate tissue vascularity may be indicated, especially for well-defined rounded lesions (see Figs. 6-36, 6-37, 6-38, 6-39). In distinction, in cases in which tumor appears primarily central on corresponding chest radiographs, especially when associated with peripheral atelectasis, images should be acquired after a bolus administration of intravenous contrast media to allow optimal differentiation between central lesions and postobstructive pneumonitis (Fig. 7-11). Attention should also focus on the need to ascertain the relation between tumor and the carina, frequently necessitating retrospective reconstruction of overlapping thin (≤1 mm) sections.
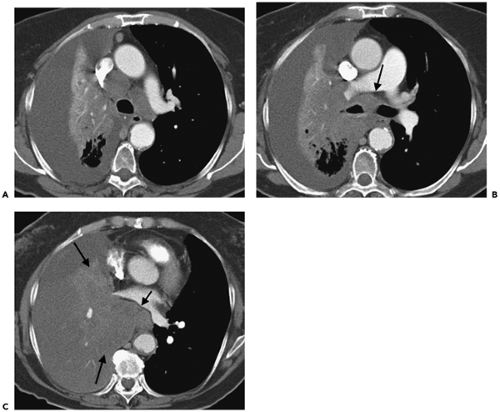 Figure 7-11 Central endobronchial tumor: use of contrast enhancement. A–C: Sequential contrast-enhanced CT images beginning at the level of the distal trachea (A) and extending inferiorly to the proximal ascending aorta (C) show extensive tumor infiltrating the right hilum, encasing the proximal right interlobar pulmonary artery, narrowing the right mainstem bronchus, and obstructing the remaining right-sided airways, with evidence of tumor infiltration of the subcarinal space (arrow in B). A subtle but distinct difference is seen in the density of tumor vs. peripheral atelectatic lung (arrows in C). Also noted are markedly enlarged mediastinal nodes, as well as marked compression of the posterolateral wall of the right atrium, likely causing obstruction of the right inferior pulmonary vein. A large right-sided effusion is also present. The use of intravenous contrast enhancement is clearly of value in cases in which complex disease involves multiple anatomic structures. |
Computed Tomography Evaluation of Tumor Extent
Chest-wall Invasion
The main role of CT is in differentiating T3 from T4 lesions. Unfortunately, from the outset, it has been apparent that CT is limited in assessing chest-wall invasion, with reported sensitivities and specificities ranging from 38% to 87% and from 40% and 89%, respectively (67). The only CT findings that allow a reliable diagnosis of chest-wall invasion are the presence of rib destruction (68) or an obvious chest-wall mass (Fig. 7-12) (69). These findings, however, have a low sensitivity, being present in only 20% to 40% of patients with surgically proven chest-wall invasion (70,71). Despite superior tissue contrast, MR has also proved of limited value for identifying chest-wall invasion, with sensitivities and specificities ranging from 63% to 90% and specificities of 84% to 86% (24).
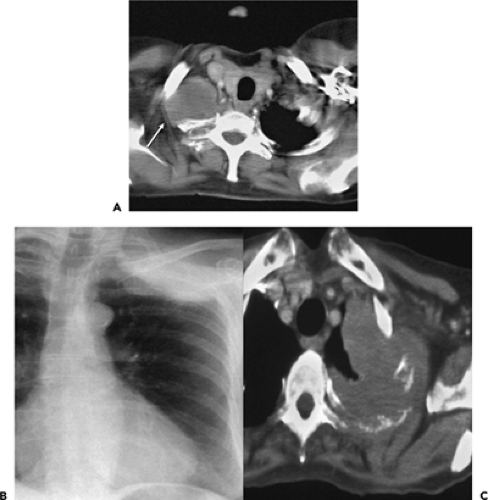 Figure 7-12 CT evaluation of tumor extent: chest-wall invasion. A: Magnified CT section through the right apex shows a superior sulcus tumor with subtle extension into the adjacent chest wall, resulting in lack of definition of chest-wall fascial planes (arrow in A). B: Coned-down posteroanterior chest radiograph from a different patient than in A shows extensive soft tissue density obliterating the left apex associated with destruction of the adjacent second and third ribs. C: Magnified CT section through the left apex, in the same patient as in B, demonstrates extensive tumor infiltration into the adjacent chest wall associated with lytic destruction of the second rib. In the absence of the signs illustrated in these two cases, definitive evaluation of chest-wall infiltration with CT is extremely limited. |
As will be discussed, one notable exception for the role of MR is the evaluation of superior sulcus tumors. A number of other CT findings have also been assessed but are considerably less accurate. Glazer et al. (72), in a study of 47 patients with peripheral tumors contacting the chest wall or pleural surface, found that the presence of an obtuse angle between the mass and pleura, pleural contact over a distance greater than 3 cm, and associated pleural thickening yielded a sensitivity of 87% for chest-wall invasion, with a specificity of only 59% and a diagnostic accuracy of 68%. In this study, the presence of focal chest pain, although not as sensitive as CT, was more specific (94%) and accurate (85%) in making the diagnosis of chest-wall invasion (72). Thus tumors abutting the pleura,
even when associated with local pleural thickening, may not be invasive (70, 71, 72).
even when associated with local pleural thickening, may not be invasive (70, 71, 72).
Two studies have suggested that the accuracy of CT in the detection of parietal pleural and chest-wall invasion can be improved by assessing the movement of lesions along the chest wall during expiration as evidence of a lack of pleural fixation or invasion (73,74). Although based on a limited number of cases, it appears that the finding of respiratory phase shifts in the relation between tumor and the adjacent pleural surfaces is evidence of a lack of parietal pleural and/or chest-wall invasion. Despite this, use of paired inspiratory–expiratory images to evaluate tumor– pleural relations has not become standard practice. Similarly, whereas it has been reported that the use of induced pneumothorax results in a sensitivity of 100% in the detection of chest-wall and mediastinal pleural invasion on CT, with specificities ranging from 57% to 80% (75,76), this technique has not gained widespread acceptance and is unlikely ever to be used in routine clinical practice.
Mediastinal Invasion
Mediastinal invasion that may be technically resectable (T3) includes limited invasion of the pericardium, mediastinal pleura or fat, and vagus and phrenic nerves (74,77). A lesion that abuts or makes only limited contact with the mediastinum, even if adjacent to areas of pleural or pericardial thickening, cannot confidently be diagnosed as being invasive because associated desmoplastic reaction and inflammation can simulate tumor extension into an adjacent structure (70). Likewise, microscopic invasion may be completely missed. The low reliability of CT in this context has been documented by several authors (77, 78, 79). Overall, the sensitivity, specificity, and accuracy of CT for identifying mediastinal invasion have been reported to vary, respectively, from 40% to 84%, 57% to 94%, and 56% to 89% (24). Although additional criteria have been proposed to identify patients with indeterminate mediastinal or pleural invasion whose lesions are likely to be technically resectable—including (a) less than 3 cm of contact between the tumor and the adjacent mediastinum; (b) less than 90 degrees of circumferential contact between the tumor and the aorta, and the presence of mediastinal fat between the mass and adjacent mediastinal structures—these findings have proven unreliable as a means for assessing individual cases (Fig. 7-13) (77).
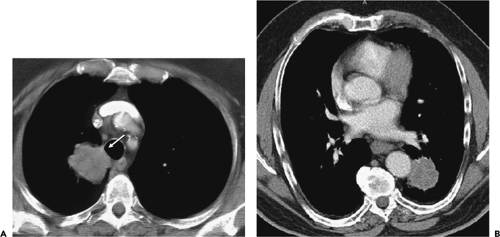 Figure 7-13 CT evaluation of tumor extent: mediastinal invasion. A: Magnified CT section at the level of the great vessels after intravenous contrast administration shows a lobular mass (arrow) in the medial aspect of the right upper lobe abutting the lateral and posterior wall of the trachea. Although a biopsy of this lesion can be performed via transbronchial needle aspiration, the results should not be overinterpreted to suggest either mediastinal invasion and/or nodal disease. B: Contrast-enhanced CT in a different patient than shown in A through the lower lobes shows a slightly irregular mass abutting the lateral wall of the mid descending aorta. Although it has been suggested that less than 3 cm of contact or less than 90 degrees of circumferential contact between the tumor and the aorta indicates resectability, only near-circumferential encasement with tumor extending into the adjacent mediastinal fat should be taken as signs of unresectability (see Fig. 7-14). In both cases, surgical resection proved successful. |
With the advent of bronchial reconstruction procedures, selected patients whose tumors are within 2 cm of the tracheal carina (T3) can also undergo curative resection (80,81). Determination of the proximity of lesions to the carina, however, may be problematic. This is especially true of left-sided SCCs in which the oblique orientation of the left mainstem bronchus makes assessment of submucosal extension of tumor to the carina particularly difficult to diagnose. As tumors more than 2 cm from the carina may
be resectable by using a “sleeve lobectomy” in place of a pneumonectomy, accurate assessment of the true extent of disease requires bronchoscopic correlation (81a).
be resectable by using a “sleeve lobectomy” in place of a pneumonectomy, accurate assessment of the true extent of disease requires bronchoscopic correlation (81a).
Stay updated, free articles. Join our Telegram channel

Full access? Get Clinical Tree


