Tachycardia-induced cardiomyopathy (TIC) is a treatable cause of heart failure in children, but there is little information as to which clinical variables best discriminate TIC from other forms of cardiomyopathy. TIC cases with dilated cardiomyopathy (DC) from 16 participating centers were identified and compared with controls with other forms of DC. Presenting clinical, echocardiographic, and electrocardiographic characteristics were collected. Heart rate (HR) percentile was defined as HR/median HR for age, and PR index as the PR/RR interval. P-wave morphology (PWM) was defined as possible sinus or nonsinus based on a predefined algorithm. Eighty TIC cases and 135 controls were identified. Cases demonstrated lower LV end-diastolic diameter and LV end-systolic diameter than DC controls (4.3 vs 6.5, p <0.001; 7.4 vs 10.9, p <0.001) and were less likely to receive inotropic medication at presentation (p <0.001 for both). Multivariable logistic regression identified HR percentile (OR 2.1 per 10% increase, CI 1.3 to 4.6; p = 0.014), PR index (OR 1.2, CI 1.1 to 1.4; p = 0.004), and nonsinus PWM (OR 104.9, CI 15.2 to 1,659.8; p <0.001) as predictive of TIC status. A risk score using HR percentile >130%, PR index >30%, and nonsinus PWM was associated with a sensitivity of 100% and specificity of 87% for the diagnosis of TIC. Model training and validation area under the curves were similar at 0.97 and 0.94, respectively. In conclusion, pediatric TIC may be accurately discriminated from other forms of DC using simple electrocardiographic parameters. This may allow for rapid diagnosis and early treatment of this condition.
Tachycardia-induced cardiomyopathy (TIC) has been formally defined as cardiac dysfunction resulting from a high and/or irregular ventricular rate that is completely or partially reversible after normalization of the rhythm abnormality. Correct and timely diagnosis of TIC is imperative in children and adolescents because the condition is completely reversible with effective control of the tachyarrhythmia, whereas inadequate rhythm control may lead to either heart transplantation or death. In an effort to improve the diagnostic work-up of TIC in pediatric patients with new-onset dilated cardiomyopathy (DC), we used a previously described multicenter registry of established cases. It was hypothesized that the most unique features of TIC could be determined through comparison of known cases with control patients with other forms of DC, enabling the development of a clinically relevant diagnostic risk score.
Methods
After obtaining local institutional review board approval at the 16 participating institutions, patient data were deidentified and electronically transferred to the coordinating center through a secure, web-based server (REDCap). Inclusion criteria for patients with TIC have been described previously, and in brief, included incessant or nearly incessant tachycardia (≥75% burden), LVEF <50%, LV end-diastolic diameter (LVEDD) z-score >2, and at least a partial (increase in LVEF ≥10%) or complete recovery (LVEF ≥ 55%) of systolic ventricular function after successful treatment of the tachyarrhythmia. Each patient underwent formal diagnosis of the arrhythmia by either standard electrocardiographic (ECG) criteria or invasive electrophysiology study demonstrating a nonsinus tachycardia mechanism (subsequently reviewed and adjudicated by 2 experienced electrophysiologists at the coordinating center). TIC cases were excluded from the analysis if there was evidence of congenital heart disease, familial cardiomyopathy, or other identifiable factor contributing to the cardiomyopathy. Patients with DC served as controls and were identified from the cardiomyopathy database at the coordinating site. DC was defined by echocardiographic evidence of both LV dilation (LVEDD z-score >2) and systolic dysfunction (LVEF <50%). Secondary cardiomyopathies (including those due to incessant tachyarrhythmia) were excluded. DC was classified as biopsy-confirmed myocarditis, probable myocarditis, familial cardiomyopathy, or idiopathic DC according to previously published criteria.
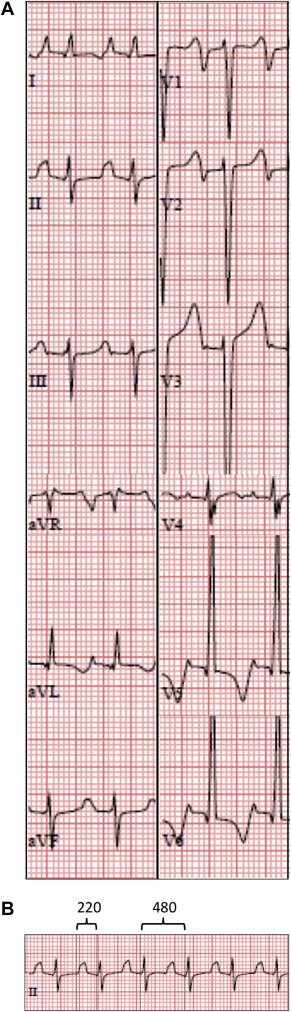
The following variables were measured and used in the univariable analysis: age at presentation, gender, LV z-score dimensions, LV ejection fraction (EF), heart rate (HR), PR interval, isoelectric PR interval, TP interval, P-wave duration, merging of the T wave with the P wave, P-wave morphology (PWM) in leads II and V1, QRS duration, and QTc. The HR was normalized for each patient by dividing it by the median HR for age (“HR percentile”). Additional variables that were derived from the previous list included the PR index, defined as the PR interval divided by the RR interval; and the isoelectric index, which was defined as the interval between the end of the P wave and the beginning of the QRS complex divided by the RR interval. A previously published algorithm was used to classify the PWM as possible sinus versus nonsinus origin. The rhythm was considered compatible with sinus rhythm if the PWM was positive-negative or negative in V1 with transition to upright in leads V2 to V4 and overall positivity in the inferior leads. Alternatively, if the PWM was positive in V1, leads I and aVL, and the inferior leads, the rhythm was considered to be possibly compatible with sinus rhythm. Appendage sites of origin were recorded based on known ECG patterns for these locations. The presenting ECG pattern was further classified as (1) “regular”—when the ventricular rate did not appreciably change during the ECG; (2) “variable”—when the atrial rhythm was not consistently followed by a QRS complex; and (3) “repetitive”—when characterized by short runs of tachycardia with occasional interruption by normal sinus rhythm. See Figure 1 for an example of the ECG analysis.
Continuous data were reported as median plus interquartile range (IQR) and categorical data as percentage. TIC cases were compared with controls using the rank-sum test for continuous and the Fisher’s exact test for dichotomous variables. Two multivariable logistic regression models were created. The first included all clinical, echocardiographic, and ECG variables with a univariable p value <0.2 and the second included only non-ECG variables with the exception of HR percentile. Stepwise forward logistic regression was performed using the minimum Akaike information criterion for selection of the most parsimonious model. Receiver-operator characteristic curves were used to determine the optimal cutpoints for the continuous variables used in both models. The regression models were then repeated using the dichotomous variables and a clinical risk score was developed by computing individual probabilities and applying values derived from the resulting beta coefficients to the existing data set. Descriptive statistics for the clinical risk score was then determined and reported. K-fold cross-validation was performed on the final logistic regression models where 5 subsets were selected randomly without replacement. This process was repeated 4 times so that 1/5 of the data set served as the validation set once. The area under the curve (AUC) was calculated for each iteration and the mean value reported. All statistics were performed with JMP version 12.0 (SAS Inc., Cary, North Carolina).
Results
A total of 215 patients who met inclusion criteria for either DC (n = 135) or TIC (n = 80) were identified from the central database and participating sites and are summarized in Table 1 . DC was classified as idiopathic in 97 (72%), familial in 15 (11%), biopsy-confirmed myocarditis in 12 (9%), and probable myocarditis in 11 (8%). The TIC diagnosis was ectopic atrial tachycardia (EAT) in 47 (59%), permanent junctional reciprocating tachycardia in 19 (24%), ventricular tachycardia in 6 (8%), atrioventricular reciprocating tachycardia in 4 (5%), competing EAT foci in 2 (3%), simultaneous EAT and junctional tachycardia in 1 (1%), and chaotic atrial tachycardia in 1 (1%). Patients with TIC presented with fewer signs/symptoms of congestive heart failure than patients with DC and by echocardiography, patients with TIC had smaller ventricular z-score dimensions and greater LVEF than DC controls ( Figure 2 ).
| Variable | TIC (n = 80) | Controls (n = 135) | P -Value |
|---|---|---|---|
| Baseline characteristics | |||
| Age (years) | 4.0 (0.3, 11.1) | 2.9 (0.7, 12.7) | 0.214 |
| Male | 40 (50%) | 68 (50%) | 1.000 |
| BSA (m 2 ) | 0.6 (0.3, 1.3) | 0.6 (0.4, 1.4) | 0.656 |
| Heart failure class | 2 (1,2) | 4 (3,4) | <0.001 |
| Heart rate (bpm) | 188 (151, 216) | 131 (112, 154) | <0.001 |
| Heart rate percentile | 161 (140, 182) | 119 (108, 136) | <0.001 |
| Symptoms | |||
| Palpitations/syncope | 13 (16%) | 14 (11%) | 0.207 |
| Respiratory | 26 (33%) | 114 (84%) | <0.001 |
| Gastrointestinal | 21 (27%) | 76 (56%) | <0.001 |
| Fatigue/Malaise | 25 (32%) | 61 (45%) | 0.061 |
| Shock | 6 (8%) | 16 (12%) | 0.362 |
| None | 13 (16%) | 7 (5%) | 0.013 |
| Echocardiographic | |||
| LVEDD (cm) | 4.9 (3.5, 5.9) | 5.5 (4.2, 6.3) | 0.005 |
| LVESD (cm) | 4.3 (2.0, 5.0) | 4.8 (3.8, 5.9) | <0.001 |
| LVEDD (z score) | 4.3 (3.0, 7.2) | 6.5 (5.0, 9.6) | <0.001 |
| LVESD (z score) | 7.4 (5.8, 11.6) | 10.9 (8.6, 15.3) | <0.001 |
| LVEF (%) | 28 (19, 38) | 18 (12, 26) | <0.001 |
| MR grade | 1 (1,2) | 2 (1,2) | 0.033 |
| Level of acuity ∗ | |||
| Outpatient | 9 (11%) | 17 (13%) | 0.831 |
| Floor | 9 (11%) | 2 (1%) | 0.001 |
| Intensive care | 62 (77%) | 116 (86%) | 1.000 |
| Medication | |||
| Milrinone | 13 (16%) | 61 (45%) | <0.001 |
| Beta agonist | 9 (11%) | 74 (55%) | <0.001 |
| Digoxin | 13 (16%) | 33 (24%) | 0.478 |
| Beta blocker | 9 (11%) | 9 (7%) | 0.205 |
| Mechanical support (%) | |||
| ECMO | 11 (14%) | 14 (6%) | 0.514 |
| VAD | 2 (2%) | 18 (8%) | 0.007 |
| ECMO + VAD | 0 | 3 (1%) | 0.294 |
Initial 12-lead electrocardiograms were available for 78 patients with TIC and 68 patients with DC. For TIC cases, the presenting tachycardia was characterized as regular in 48 (62%), variable in 11 (14%), and repetitive in 17 (22%) patients. The pattern was unclear in 2 patients due to competing atrial rhythms (n = 1), and junctional tachycardia competing with atrial tachycardia (n = 1).
Nine DC controls (13%) presented with a nonsinus rhythm. Five presented with an ectopic atrial rhythm, 1 with junctional rhythm competing with sinus rhythm, 1 with nonsustained atrial tachycardia, and 1 with nonsustained ventricular tachycardia (the last 2 with tachycardia burden <10%). One DC control patient presented with typical atrial flutter and serologic evidence of enterovirus infection. The ventricular rate was in the expected range for age throughout the course of the arrhythmia.
Two separate predictive models for TIC were created. The first was derived from all available clinical, echocardiographic, and ECG variables (model 1) and the second from only non-ECG variables with the exception of the HR percentile (model 2). Covariates retained in model 1 included HR percentile (OR 2.1 per 10% increase, CI 1.3 to 4.6; p = 0.014), PR index (OR 1.2, CI 1.1 to 1.4; p = 0.004), and nonsinus PWM (OR 104.9, CI 15.2 to 1,659.8; p <0.001). For model 2, covariates included inotropic support (OR 0.14, CI 0.05 to 0.37; p <0.001), LVEF (OR 2.4 per 10% increase, CI 1.5 to 4.0; p <0.001), and HR percentile (OR 2.4 per 10% increase, CI 1.9 to 3.2; p <0.001). By receiver-operator characteristic curve analysis for model 1, HR percentile >130% (sensitivity 71%, specificity 92%; AUC 0.79), PR index >0.33 (sensitivity 79%, specificity 89%; AUC 0.84), and nonsinus PWM (sensitivity 71% and specificity 92%; AUC 0.83) were the best discrimination points for the diagnosis of TIC. Likewise for model 2, HR percentile >130%, LVEF >20% (sensitivity 70%, specificity 62%; AUC 0.66) and lack of inotropic support (sensitivity 78%, specificity 63%; AUC 0.70) were the best discrimination points. See Figure 3 for a comparison of the multivariable predictors for model 1 between cases of TIC and DC controls.


