We aimed to describe the cardiac magnetic resonance (CMR) findings and determine the prognostic variables in patients with a cardiomyopathy after treatment with anthracyclines. CMR imaging was performed in 91 patients (58% men, mean age 43 ± 18 years, and mean anthracycline dose of 276 ± 82 mg/m 2 ) with a reduced ejection fraction after anthracycline-based chemotherapy. Major adverse cardiovascular events were defined as cardiovascular death, appropriate implantable cardioverter-defibrillator therapy, and admission for decompensated heart failure. Patients presented a median of 88 months (interquartile range 37 to 138) after chemotherapy and were followed for 27 months (interquartile range 22 to 38). Late gadolinium enhancement was an uncommon finding (5 patients, 6%) despite a reduced ejection fraction (36 ± 8%). An inverse association was found between the anthracycline dose and the indexed left ventricular (LV) mass by CMR (r = −0.67, p <0.001). A total of 52 adverse cardiac events occurred (event rate of 22%/year). When the patients were grouped according to the presence or absence of a major adverse cardiovascular event, the indexed LV mass and glomerular filtration rate were lower and the anthracycline dose was greater among the patients who experienced an adverse event. In a multivariate model, the indexed LV mass demonstrated the strongest association with major adverse cardiovascular events (hazard ratio 0.89, chi-square 26, p <0.001). In conclusion, myocardial scar by late gadolinium enhancement-CMR is infrequent in patients with anthracycline-cardiomyopathy despite a reduced ejection fraction, the event rate in patients with established anthracycline-cardiotoxicity is high, and indexed LV mass by CMR imaging is a predictor of adverse cardiovascular events.
Anthracyclines are a key component of many chemotherapy regimens. The long-term outcomes after anthracycline-based therapy are limited, in part, by cardiovascular morbidity and mortality. More than 50% of patients treated with anthracyclines will show cardiac dysfunction, with an associated 2-year survival of 40%. The risk factors for the development of anthracycline-cardiotoxicity are partially known ; however, the predictors of adverse outcomes, once heart failure has been established, are less clear. Cardiac magnetic resonance (CMR) with late gadolinium enhancement (LGE) is a sensitive and reproducible technique for the detection and quantification of myocardial fibrosis and function, and scarring found using LGE-CMR has been shown to be a strong predictor of outcomes in patients with a cardiomyopathy. However, data on the characteristic CMR findings and the presence and the extent of LGE specifically in patients with anthracycline-cardiomyopathy are limited. Also, the predictors of subsequent adverse events in patients with anthracycline-cardiomyopathy are poorly defined. Therefore, we aimed to add to the data on the role of CMR in patients with a reduced ejection fraction (EF) after the administration of anthracycline chemotherapy.
Methods
We performed a retrospective, observational study of consecutive patients with clinically diagnosed anthracycline-cardiomyopathy who attended Brigham and Women’s Hospital for CMR imaging that included gadolinium from 2003 to 2010. All patients were entered into a registry at the time of the CMR study. Patients were referred for a CMR study for evaluation of a cardiomyopathy. The diagnosis of anthracycline-cardiomyopathy was determined by the following criteria: (1) a lack of heart failure or reduced EF before treatment with anthracyclines; (2) exclusion of other causes of cardiomyopathy, such as a history of significant coronary artery disease, myocardial infarction, excess alcohol consumption, uncontrolled hypertension, or infiltrative cardiomyopathy; and (3) confirmation of depressed left ventricular (LV) EF after the initiation of anthracyclines. Coronary artery disease was excluded by negative coronary angiographic findings or negative stress test findings with imaging. Ten patients aged <30 years did not undergo either test. Patients with subendocardial or transmural LGE typical of an infarct in the territory of a coronary artery were excluded. After exclusion of the patients with significant coronary artery disease, myocardial infarction, and previous revascularization, 4 patients had unanticipated LGE in a distribution typical of myocardial infarction, these patients were excluded. The patients were grouped into 2 cohorts. Cohort 1 consisted of patients with stage C heart failure (symptomatic reduction in EF), and cohort 2 had stage B heart failure (an asymptomatic reduction in EF) detected using routine surveillance after chemotherapy. The Partners HealthCare System Human Subjects Review Committee in Brigham and Women’s Hospital approved the protocol.
All CMR images were acquired using either a 1.5-T (n = 25) or 3.0-T (n = 66) system (Signa CV/i, General Electric Healthcare, Waukesha, Wisconsin; Tim Trio, Siemens, Erlangen, Germany, respectively). The basic CMR protocol consisted of imaging for LV function and LV mass, as previously desrcibed. For calculation of LV mass and LVEF, the endocardial and epicardial borders of the left ventricle were manually traced on successive short-axis cine images at end-diastole and end-systole. The papillary muscles were excluded in the LV mass calculation. The LV mass using CMR was derived by the summation of disks method by multiplying the myocardial muscle volume by 1.05 g/cm 3 . To assess the contribution of cardiac edema, we performed a T 2 -weighted inversion recovery prepared fast spin echo sequence using 3 short-axis slices of 12 mm thickness at the base, mid, and apex and a single long-axis slice in a 4-chamber view. Qualitatively, the sequence was considered abnormal if patchy areas of high T 2 -weighted signal intensity were seen, indicating focal or regional edema. Quantitatively, the sequence was considered abnormal if the average signal intensity of the myocardium, normalized to skeletal muscle, was ≥2. The results were considered abnormal if they were positive using either qualitative or quantitative methods. Images were analyzed with specialized software (Mass Research, Leiden University Medical Center, Leiden, The Netherlands) by researchers who were unaware of the clinical outcome. All patients underwent an LGE imaging protocol, as previously described.
The LV mass by echocardiography was derived from the 2-dimensional measurements of intraventricular septal thickness, posterior wall thickness, and LV internal dimensions in diastole, as recommended by the American Society of Echocardiography. The LVEF was measured using the biplane method of disks. Pulmonary artery systolic pressure was estimated from the tricuspid regurgitant velocity plus an estimate of right atrial pressure derived from the inferior vena cava.
The patients were also followed at 3- to 6-month intervals by clinic visits performed as a part of routine care. The follow-up duration was determined from the CMR study date. The outcome of interest was a composite of cardiovascular death, appropriate implantable cardioverter defibrillator therapy (implantable cardioverter defibrillator discharge or antitachycardia pacing), and admission for decompensated heart failure. We ascertained mortality using the Social Security Death Index and confirmed it using chart review and, if required, discussion with the primary healthcare providers. For patients who experienced an adverse cardiac outcome, the interval to that first event was used. For patients who did not experience an adverse cardiac outcome, censoring occurred on the last date of clinical follow-up.
Continuous data are presented as the mean ± SD and compared using an unpaired Student t test or Mann-Whitney U nonparametric test, as appropriate. Nominal data are presented as numbers and percentages and were compared with a chi-square test for trend. To test a correlation between the LV mass index and anthracycline dose, Spearman’s rank correlation coefficient was used. The difference in the LV mass measurement between methods was calculated for 50 randomly selected subjects. To test the inter- and intraobserver variability of the CMR-derived LV mass and CMR-derived LV end-diastolic volume, another 15 randomly selected patients were selected. Bland-Altman plots were constructed to determine the 95% limits of agreement between methods. The hazard ratio was calculated for the combined outcome using a Cox regression model. Considering all the significant variables from the univariate analysis, we sought the best-overall multivariate models for the composite end point, by stepwise-forward selection with a probability to enter set and leave at p = 0.01. To test whether previous heart failure admissions were associated with subsequent major adverse cardiovascular events (MACE), we performed a second model that included previous heart failure hospitalization on univariate analysis. Receiver operating characteristic curves were constructed to determine the optimal cutoff of the CMR-derived LV mass index, LVEF, anthracycline dose, and glomerular filtration rate to predict adverse cardiovascular events. Event curves were determined according to the Kaplan-Meier method, and comparisons of cumulative event rates were performed by the log-rank test. A 2-tailed p value of <0.05 was deemed significant for all other analyses, and SAS was used for statistical analysis (SAS Institute, Cary, North Carolina).
Results
We identified 91 patients, 53 men and 38 women, with a mean age at initiation of chemotherapy of 43 ± 18 years, a mean anthracycline dose of 276 ± 82 mg/m 2 , and presenting 88 months (interquartile range 37 to 138) after chemotherapy. Overall, 82% were either taking an angiotensin-converting enzyme inhibitor or angiotensin receptor blocker ( Table 1 ). The estimated glomerular filtration rate was lower among patients with adverse events, and the dose of anthracyclines administered was greater; otherwise, the nonimaging parameters were similar between the 2 groups.
| Variable | Cohort (n = 91) | MACE | p Value | |
|---|---|---|---|---|
| Yes (n = 52) | No (n = 39) | |||
| Age at start of chemotherapy (years) | 43 ± 18 | 43 ± 19 | 44 ± 15 | 0.76 |
| Men | 53 (58%) | 27 (52%) | 26 (67%) | 0.13 |
| Chest radiotherapy | 30 (33%) | 20 (38%) | 10 (29%) | 0.07 |
| Anthracycline dose (mg/m 2 ) | 276 ± 18 | 296 ± 76 | 246 ± 85 | 0.005 |
| Interval from chemotherapy to clinical presentation (months) | 0.53 | |||
| Median | 88 | 86 | 90 | |
| Interquartile range | 37–138 | 38–145 | 26–141 | |
| Interval from clinical presentation to cardiac magnetic resonance study (months) | 0.89 | |||
| Median | 3 | 3 | 3 | |
| Interquartile range | 1–5 | 1–5 | 1–5 | |
| Heart failure stage C | 75 (82%) | 45 (87%) | 30 (77%) | 0.86 |
| Previous admission for heart failure | 14 (15%) | 10 (19%) | 4 (10%) | 0.38 |
| Diabetes mellitus | 11 (12%) | 7 (13%) | 4 (10%) | 1.00 |
| Hypertension | 35 (38%) | 21 (40%) | 14 (36%) | 0.64 |
| Atrial fibrillation | 20 (22%) | 11 (21%) | 9 (23%) | 1.00 |
| New York Heart Association functional class | ||||
| I | 16 (18%) | 9 (17%) | 7 (18%) | 0.76 |
| II | 60 (66%) | 35 (67%) | 25 (64%) | 0.56 |
| III | 15 (16%) | 10 (19%) | 5 (13%) | 0.30 |
| Body mass index (kg/m 2 ) | 28 ± 5 | 27 ± 4 | 29 ± 5 | 0.18 |
| Systolic blood pressure (mm Hg) | 116 ± 16 | 115 ± 17 | 117 ± 12 | 0.43 |
| Diastolic blood pressure (mm Hg) | 71 ± 12 | 71 ± 12 | 73 ± 12 | 0.4 |
| Heart rate (beats/min) | 73 ± 14 | 74 ± 15 | 72 ± 13 | 0.37 |
| Medications | ||||
| Angiotensin-converting enzyme inhibitor/angiotensin receptor blocker | 75 (82%) | 46 (88%) | 29 (74%) | 0.40 |
| β Blocker | 75 (82%) | 42 (81%) | 33 (85%) | 0.77 |
| Spironolactone | 21 (22%) | 13 (25%) | 8 (21%) | 0.44 |
| Diuretics | 52 (57%) | 31 (60%) | 21 (54%) | 0.83 |
| Antiarrythmic agent | 17 (19%) | 11 (21%) | 6 (15%) | 0.58 |
| Warfarin | 23 (25%) | 14 (27%) | 9 (23%) | 0.63 |
| Aspirin | 21 (23%) | 11 (21%) | 10 (26%) | 0.83 |
| Statin | 29 (32%) | 17 (33%) | 12 (31%) | 0.65 |
| QRS duration (ms) | 96 ± 16 | 97 ± 17 | 95 ± 16 | 0.47 |
| QTc duration (ms) | 454 ± 28 | 458 ± 28 | 447 ± 24 | 0.07 |
| Glomerular filtration rate ⁎ (ml/min/1.73 m 2 ) | 78 ± 24 | 75 ± 23 | 81 ± 25 | 0.0003 |
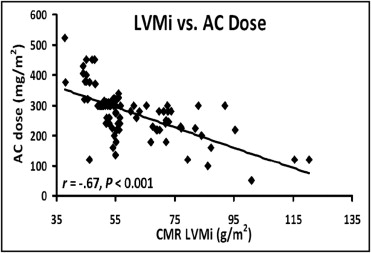
The mean LVEF using echocardiography was 35 ± 8% ( Table 2 ). The indexed LV mass using CMR imaging was lower in those that received greater chemotherapy doses ( Table 2 ). Otherwise, the imaging characteristics were similar between the 2 groups. An inverse association was seen between the CMR-derived indexed LV mass and the anthracycline dose (r = −0.67, p <0.001; Figure 1 ). A mean difference was seen between the transthoracic echocardiographic-derived LV mass index and CMR-derived LV mass index of 20 g/m 2 ( Figure 2 ). We found an absolute mean difference in the CMR-derived LV mass of 5 ± 2 g, within observers and 6.4 ± 2 g between observers. We found an average difference of 8 ± 3 cm 3 for intraobserver and 11 ± 3 cm 3 for interobserver variability for the CMR-derived LV end-diastolic volume (data not shown). One patient in the entire cohort had qualitative and quantitative evidence of myocardial edema (qualitative edema and global relative signal intensity of 2.4 ± 0.2). The signal intensity of the myocardium/skeletal muscle ratio was normal and was similar between groups with and without an adverse event ( Table 2 ). LGE was an infrequent finding occurring in 5 of patients (6%). The distribution of LGE was either midmyocardial (n = 2), right ventricular insertion point (n = 1), and epicardial (n = 2).
| Variable | Cohort (n = 91) | MACE | p Value | |
|---|---|---|---|---|
| Yes (n = 52) | No (n = 39) | |||
| Echocardiography | ||||
| Left ventricular ejection fraction (%) | 35 ± 8 | 36 ± 9 | 35 ± 7 | 0.61 |
| Left ventricular internal dimensions in diastole (mm) | 49 ± 6 | 49 ± 5 | 49 ± 7 | 0.95 |
| Estimated pulmonary artery systolic pressure (mm Hg) | 33 ± 10 | 33 ± 10 | 33 ± 9 | 0.98 |
| Left ventricular mass index (g/m 2 ) | 78 ± 18 | 78 ± 18 | 78 ± 17 | 0.97 |
| Cardiac magnetic resonance | ||||
| Left ventricular end-diastolic volume (cm 3 ) | 181 ± 48 | 186 ± 44 | 173 ± 52 | 0.23 |
| Indexed left ventricular end-diastolic volume (ml/m 2 ) | 92 ± 22 | 100 ± 23 | 89 ± 18 | 0.31 |
| Left ventricular end-systolic volume (cm 3 ) | 116 ± 34 | 118 ± 35 | 112 ± 32 | 0.42 |
| Indexed left ventricular end-systolic volume (ml/m 2 ) | 59 ± 17 | 61 ± 22 | 53 ± 14 | 0.16 |
| Left ventricular ejection fraction (%) | 36 ± 8 | 37 ± 7 | 35 ± 7 | 0.23 |
| Left ventricular mass index (g/m 2 ) | 60 ± 16 | 51 ± 5 | 71 ± 12 | <0.0001 |
| Right ventricular end-diastolic volume (cm 3 ) | 154 ± 41 | 155 ± 41 | 154 ± 42 | 0.73 |
| Indexed right ventricular end-diastolic (ml/m 2 ) | 78 ± 18 | 80 ± 20 | 77 ± 16 | 0.41 |
| Right ventricular end-systolic volume (cm 3 ) | 84 ± 33 | 77 ± 32 | 82 ± 29 | 0.18 |
| Indexed right ventricular end-systolic volume (ml/m 2 ) | 43 ± 15 | 45 ± 15 | 41 ± 14 | 0.21 |
| Right ventricular ejection fraction (%) | 46 ± 12 | 44 ± 11 | 47 ± 11 | 0.25 |
| Relative T 2 -weighted signal intensity | 1.6 ± 0.2 | 1.6 ± 0.2 | 1.5 ± 0.2 | 0.46 |
| Late gadolinium enhancement | 5 ± 6 | 3 ± 6 | 2 ± 5 | 0.88 |
| Volume of late gadolinium enhancement ⁎ (% of mass) | 7 ± 4 | 9 ± 5 | 4 ± 1 | 0.27 |
⁎ Volume of LGE as percentage of total LV volume using 2 standard deviation (SD) method in patients identified with LGE.
There were 52 events during follow-up (5 cardiovascular deaths, 8 appropriate implantable cardioverter-defibrillator therapies, and 39 admissions for decompensated heart failure, 22% event rate annually) during a median follow-up period of 27 months (interquartile range 22 to 38). Fifty patients underwent implantation of an implantable cardioverter-defibrillator. On univariate analysis, the dose of anthracycline, glomerular filtration rate, and CMR-derived indexed LV mass were predictors of MACE ( Table 3 ). Of these, the indexed LV mass using CMR had the strongest unadjusted association with adverse outcomes (hazard ratio 0.85, chi-square 26, p <0.0001; Table 3 ). On multivariate analysis using predictors developed from the univariate model, the CMR-derived indexed LV mass demonstrated the strongest adjusted association with MACE. In a second analysis that included previous heart failure hospitalization, the indexed LV mass still provided the strongest adjusted association with the outcome of interest (hazard ratio 0.87, chi-square 23, p <0.0001). The variables were also separated according to the median CMR-derived LV mass ( Table 4 ). Receiver operating curve analyses, testing the ability of anthracycline dose, glomerular filtration rate, CMR-derived LVEF, and CMR-derived indexed LV mass to predict MACE revealed an area under the curve of 0.90 for the CMR-derived indexed LV mass. The analyses also revealed that a CMR-derived indexed LV mass of <57 g/m 2 had a sensitivity of 100% and specificity of 85% for the prediction of MACE ( Figure 3 ). Because the LV mass is lower in women, the entire analysis was also performed in the cohort separated by gender. In that analysis, the LV mass index was significantly reduced in both men and women with an adverse event (indexed LV mass 72 ± 11 vs 51 ± 4 g/m 2 for women with and without MACE, p <0.001; indexed LV mass 73 ± 20 vs 51 ± 4 g/m 2 for men with and without MACE, p <0.001). In the receiver operating characteristic analysis confined to women, an indexed LV mass <56 g/m 2 provided the strongest combination of sensitivity and specificity for the prediction of MACE (sensitivity 100%, 95% confidence interval 86% to 100% and specificity 92%, 95% confidence interval 64% to 99%). In men, we found that an indexed LV mass of <57 g/m 2 provided the strongest combination of sensitivity (95% confidence interval 87% to 100%) and specificity (81%, 95% confidence interval 61% to 94%). Kaplan-Meier curves of event-free survival are shown, after stratifying the entire cohort according to an indexed LV mass of <57 g/m 2 . Patients with an indexed LV mass of <57 g/m 2 developed more long-term adverse events than patients with an indexed LV mass of ≥57 g/m 2 ( Figure 4 ).
| Variable | HR | 95% CI | Chi-Square | p Value |
|---|---|---|---|---|
| Age at chemotherapy | 0.00 | 0.97–1.02 | 0.001 | 0.97 |
| Anthracycline dose | 1.00 | 1.00–1.00 | 7.7 | 0.005 |
| Male gender | 0.68 | 0.28–1.69 | 0.69 | 0.40 |
| Stage B heart failure | 0.68 | 0.16–2.97 | 0.27 | 0.60 |
| Stage C heart failure | 1.48 | 0.38–6.43 | 0.27 | 0.60 |
| Glomerular filtration rate | 0.97 | 0.96–0.99 | 8.48 | 0.0003 |
| Echocardiography | ||||
| Left ventricular ejection fraction | 0.98 | 0.95–1.02 | 1.11 | 0.29 |
| Estimated pulmonary artery systolic pressure | 1.01 | 0.98–1.05 | 0.58 | 0.44 |
| Indexed left ventricular mass | 0.99 | 0.98–1.01 | 0.02 | 0.86 |
| Cardiac magnetic resonance | ||||
| Left ventricular end-diastolic volume | 0.99 | 0.99–1.02 | 0.03 | 0.86 |
| Left ventricular end-systolic volume | 1.01 | 0.99–1.02 | 1.73 | 0.52 |
| Left ventricular ejection fraction | 0.98 | 0.95–1.03 | 0.53 | 0.46 |
| Indexed left ventricular mass | 0.85 | 0.80–0.90 | 26.2 | <0.0001 |
| Right ventricular end-diastolic volume | 1.03 | 0.98–1.07 | 0.62 | 0.44 |
| Right ventricular end-systolic volume | 1.01 | 0.99–1.02 | 1.83 | 0.18 |
| Right ventricular ejection fraction | 0.97 | 0.92–1.01 | 1.11 | 0.25 |
Stay updated, free articles. Join our Telegram channel

Full access? Get Clinical Tree


