Longitudinal studies of the association of estimated glomerular filtration rate (eGFR) and albuminuria with coronary artery calcium (CAC), a measure of cardiovascular disease burden, are few and contradictory. In this study, 421 community-dwelling men and women (mean age 67 years) without known heart disease had eGFRs assessed using the Modification of Diet in Renal Disease (MDRD) equation and albuminuria assessed by urine albumin/creatinine ratio (ACR) from 1997 to 1999. The mean eGFR was 78 ml/min/1.73 m 2 , and the median ACR was 10 mg/g. CAC was measured using electron-beam computed tomography from 2000 to 2001, when the median total Agatston CAC score was 77; 4.5 years later, 338 participants still without heart disease underwent repeat scans (median CAC score 112); 46% of participants showed CAC progression, defined as an increase ≥2.5 mm 3 in square root–transformed CAC volume score. Cross-sectional and longitudinal logistic regression analyses showed no separate or joint association between eGFR or ACR and CAC severity or progression. In conclusion, this study does not support the use of eGFR or ACR to identify asymptomatic older adults who should be screened for subclinical cardiovascular disease with initial or sequential scanning for CAC. In the elderly, kidney function and CAC may not progress together.
Coronary artery calcium (CAC) has been shown to predict coronary heart disease death, nonfatal myocardial infarction, and coronary revascularization in the general population. CAC progression predicts cardiovascular disease (CVD) events and may be a better predictor of all-cause mortality than a single measure of CAC. Evidence is conflicting for an association between estimated glomerular filtration rate (eGFR), albuminuria, or both and CAC in cohorts of community-dwelling participants; only 3 previous studies have included CAC progression. The present study was designed to evaluate the association of eGFR and urine albumin/creatinine ratio (ACR), separately and combined, with CAC severity and CAC progression over a 4.5-year period in community-dwelling older adults with no histories of heart disease.
Methods
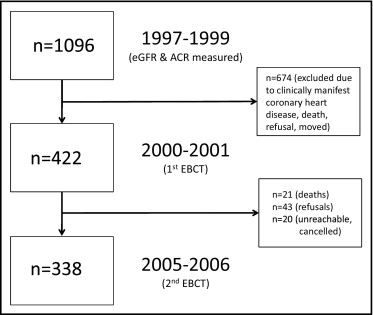
The Rancho Bernardo Study, a cohort of Caucasian, middle-class, community-dwelling adults living in southern California, was established in 1972. From 1997 to 1999, 77% of all surviving community-dwelling participants from the Rancho Bernardo Study (n = 1,096) attended a research clinic visit at which blood and urine were obtained for measurement of CVD risk factors and kidney function. A mean of 2.3 ± 0.9 years later, from 2000 to 2001, 422 men and women who were free of clinically manifest coronary heart disease (no physician-diagnosed angina, myocardial infarction, or coronary artery revascularization) underwent electron-beam computed tomography for CAC assessment. Four hundred twenty-one of these participants (199 men and 222 women) had blood drawn for the assessment of serum creatinine and calculation of eGFR, and 362 (172 men and 190 women) had urine sampled for ACR from the 1997 to 1999 research clinic visit. From 2005 to 2006, 338 participants still without known heart disease (156 men and 182 women) returned 4.5 ± 0.5 years later for repeat CAC scans ( Figure 1 ). Those who did not return for follow-up (n = 84) included refusals (n = 43), deaths (n = 21), and participants who were unreachable or who had canceled their appointments for unknown reasons (n = 20). The study protocol was approved by the Human Research Protection Program at the University of California, San Diego, and all participants gave written informed consent.
At the 1997 to 1999 visit, participants completed standardized questionnaires about their medical histories, current medications, and dietary supplement use; current medications and prescriptions were brought to the clinic for validation. Cigarette smoking and physical exercise were assessed using standard questionnaires. Height and weight were measured using a calibrated stadiometer and balance-beam scale with participants wearing light clothing and no shoes. Body mass index was calculated as weight in kilograms divided by the square of height in meters. Systolic and diastolic blood pressures were measured twice in seated resting subjects using the Hypertension Detection and Follow-Up Program protocol. Hypertension was defined by patient report of antihypertensive medication and/or measured systolic blood pressure ≥140 mm Hg and/or diastolic blood pressure ≥90 mm Hg.
A blood sample was obtained by venipuncture after a requested overnight fast (12 to 16 hours). Serum was separated and stored at −70°C within 30 minutes of collection. A single, clean-catch, untimed morning urine sample (usually second void) was obtained. Glucose was measured by the glucose oxidase method. Diabetes was defined by patient report of physician diagnosis and/or fasting plasma glucose >126 mg/dl. Plasma cholesterol, triglycerides, and high-density lipoprotein cholesterol were measured at a lipid research clinic laboratory certified by the Centers for Disease Control and Prevention according to the standardized procedures of the lipid research clinics manual, and low-density lipoprotein cholesterol was estimated using the Friedewald equation. Serum 25(OH)D (25[OH]D 2 + 25[OH]D 3 ) and 1,25(OH) 2 D were measured using vitamin D competitive binding protein recognition and chemiluminescence detection. The intra- and interassay coefficients of variation for the 25(OH)D assay were 8% and 10%, respectively; the limit of detection was 5 ng/ml. The intra- and interassay coefficients of variation for 1,25(OH) 2 D were 5% to 10% and 10% to 15%, respectively; the limit of detection was 5 pg/ml. The intact parathyroid hormone values were determined in the same laboratory using a chemiluminescence assay kit (Nichols Institute Diagnostics, San Juan Capistrano, California). The intra- and interassay coefficients of variation were 6%. Serum creatinine was measured using a variation of the Jaffe enzymatic method on a Hitachi 911 analyzer (Roche Diagnostics Corporation, Indianapolis, Indiana), with intra- and interassay coefficients of variation of 4%. Urine albumin was measured using the Behring Nephelometer BNA (Dade Behring GmbH, Marburg, Germany) in the National Institutes of Health laboratory (Phoenix, Arizona). The interassay coefficient of variation was 5%. The lower limit of detection of the assay was 6.8 mg/dl; values <6.8 mg/dl were assigned a value of 6.7 mg/dl. Urine creatinine was measured by the kinetic alkaline picrate method using the Ciba-Corning Express (Corning, Medfield, Massachusetts).
CAC was determined in the Lifescore Laboratory of Michael Wright using an Imatron C-150 ultrafast computed tomographic scanner (GE Imatron, San Francisco, California), a stationary source detector combination, and a rotating electron beam that produces serial contiguous thin-section (100-ms) scans. Scans were obtained at end-diastole, usually during a single breath hold. The Agatston method was used to quantify the total CAC score, defined as the product of the area of calcium per coronary tomographic segment and a factor rated 1 through 4 depending on the maximal calcium x-ray density in that segment.
The eGFR was calculated using the Modification of Diet in Renal Disease (MDRD) equation for Caucasians: eGFR (ml/min/1.73 m 2 ) = 186 × (serum creatinine [mg/dl]) −1.154 × (age [years]) −0.203 × (0.742 if female). ACR was calculated as ACR (mg/g) = urine albumin (mg/dl)/urine creatinine (g/dl).
CAC scores from the 2000 to 2001 scan were categorized according to the Rumberger criteria, which defines a calcium score ≤10 as absent or minimal, 11 to 100 as mild, 101 to 399 as moderate, and ≥400 as severe. CAC progression was analyzed as a categorical outcome (CAC progression, yes or no) and was defined as a difference ≥2.5 mm 3 between the follow-up and the baseline square root–transformed CAC volume score. Because interscan variability and error depend on absolute CAC value (CAC variability and score error are larger in patients with higher baseline CAC scores than in those with lower scores), this definition provides an estimate of change that is unbiased with respect to baseline CAC.
Baseline characteristics at the 1997 to 1999 clinic visit were compared by CAC category at the 2000 to 2001 visit, and by CAC progression status at the 2005 to 2006 visit, using the Kruskal-Wallis test for continuous variables and Pearson’s chi-square test for categorical variables. The association of a 1-SD decrease in eGFR or a 1-SD increase ACR and baseline CAC category was examined using ordinal logistic regression analysis, with lesser severity as the reference. In ordinal logistic regression, the outcome variable is interpreted as a set of cumulative logits on the basis of an increasingly severe CAC score, that is, the odds of greater severity compared to lesser severity. First, the independent and joint crude associations for eGFR and ACR with CAC category were determined. Next, traditional CVD risk factors (age, sex, body mass index, systolic blood pressure, fasting glucose, high-density lipoprotein cholesterol, and triglycerides) were entered in blocks, and finally, additional CVD and kidney covariates biologically implicated in vascular calcium (smoking, low-density lipoprotein cholesterol, 25[OH]D, 1,25[OH] 2 D, intact parathyroid hormone, lipid-lowering medications, antihypertensive medications, and calcium and vitamin D supplements) were added to a fully adjusted, multivariate model. Secondary analyses included interactions between eGFR and ACR with sex and age to test for effect modification. Analyses were repeated using logistic regression with the categorical outcomes CAC <100 or CAC ≥101 and linear regression with continuous CAC as the outcome.
For longitudinal analyses, the independent and joint associations of a 1-SD decrease in baseline eGFR or a 1-SD increase in ACR with categorical CAC progression were examined in logistic regression models before and after adjustment for the same confounders as described earlier. An additional time-interval variable was added to the progression models to account for differences in the time between the baseline and follow-up scans. Analyses were repeated using linear regression with absolute and relative change in CAC volume scores as the outcome and using logistic regression dividing CAC progressors into initiators (those without CAC at baseline) and progressors (those with CAC at baseline).
The proportional odds assumption was tested using the methods proposed by Brant. Model diagnostics failed to indicate violations of the model assumptions. A p value <0.05 was considered statistically significant for all analyses including interaction terms. Statistical analyses were performed with SPSS base 15.0 for Windows (SPSS, Inc., Chicago, Illinois) and Stata version 11.1 for Windows (StataCorp LP, College Station, Texas).
Results
Baseline characteristics from 1997 to 1999 for all participants who participated in the 2000 to 2001 CAC visit are listed in Table 1 . Forty-three participants (12%) had eGFRs < 60 ml/min/1.73 m 2 ; 31 (9%) had ACRs ≥30 mg/g, and 181 (50%) had ACRs ≥10 mg/g. Two hundred ninety-two (81%) had eGFRs ≥60 ml/min/1.73 m 2 and ACRs <30 mg/g, 27 (8%) had eGFRs ≥60 ml/min/1.73 m 2 and ACRs ≥30 mg/g, 39 (11%) had eGFRs < 60 ml/min/1.73 m 2 and ACRs <30 mg/g, and 4 (1%) had eGFRs < 60 ml/min/1.73 m 2 and ACRs ≥30 mg/g.
| Characteristic | All (n = 421) | CAC Score (2000–2001) | p Value for Trend ⁎ | |||
|---|---|---|---|---|---|---|
| ≤10 (n = 141 [33%]) | 11–100 (n = 89 [21%]) | 101–399 (n = 92 [22%]) | ≥400 (n = 99 [24%]) | |||
| CAC score | 77 (1.0–357) | 0 (0–1.2) | 43 (22–73) | 185 (141–254) | 815 (523–1,389) | NA |
| Age (years) | 67 ± 7 | 63 ± 6 | 68 ± 7 | 69 ± 7 | 72 ± 6 | <0.001 |
| Systolic blood pressure (mm Hg) | 130 ± 19 | 125 ± 17 | 130 ± 18 | 132 ± 17 | 137 ± 24 | <0.001 |
| Body mass index (kg/m 2 ) | 26 ± 4 | 26 ± 4 | 26 ± 4 | 27 ± 4 | 27 ± 4 | 0.13 |
| Fasting plasma glucose (mg/dl) | 104 ± 22 | 98 ± 10 | 103 ± 15 | 108 ± 25 | 109 ± 33 | <0.001 |
| Low-density lipoprotein (mg/dl) | 123 ± 30 | 121 ± 29 | 123 ± 29 | 118 ± 30 | 129 ± 32 | 0.13 |
| High-density lipoprotein (mg/dl) | 59 ± 17 | 64 ± 17 | 60 ± 18 | 54 ± 14 | 55 ± 15 | <0.001 |
| Triglycerides (mg/dl) | 129 ± 68 | 128 ± 70 | 124 ± 64 | 140 ± 76 | 126 ± 62 | 0.26 |
| Serum calcium (mg/dl) | 9.0 ± 0.4 | 9.0 ± 0.3 | 9.1 ± 0.4 | 9.1 ± 0.3 | 9.1 ± 0.4 | 0.02 |
| 25(OH)D (ng/ml) | 44 ± 15 | 43 ± 13 | 44 ± 12 | 44 ± 18 | 45 ± 14 | 0.37 |
| 1,25(OH) 2 D (pg/ml) | 34 ± 19 | 34 ± 14 | 36 ± 20 | 36 ± 24 | 33 ± 18 | 0.68 |
| Intact parathyroid hormone (pg/ml) | 49 ± 23 | 48 ± 19 | 55 ± 36 | 49 ± 20 | 47 ± 18 | 0.73 |
| Serum creatinine (mg/dl) | 0.9 ± 0.4 | 0.9 ± 0.2 | 1.0 ± 0.8 | 0.9 ± 0.2 | 1.0 ± 0.2 | <0.001 |
| eGFR (ml/min/1.73 m 2 ) | 78 ± 17 | 78 ± 17 | 79 ± 18 | 78 ± 16 | 77 ± 17 | 0.70 |
| Urine ACR (mg/g) | 10 (6–17) | 11 (6–18) | 10 (6–17) | 9 (6–14) | 10 (6–17) | 0.70 |
| Women | 222 (53%) | 108 (77%) | 51 (57%) | 41 (45%) | 22 (22%) | <0.001 |
| Exercise ≥3 times per week | 323 (77%) | 101 (72%) | 69 (78%) | 73 (79%) | 80 (81%) | 0.34 |
| Current smokers | 22 (5%) | 7 (5%) | 5 (6%) | 3 (3%) | 7 (7%) | 0.70 |
| Diabetes mellitus | 33 (8%) | 3 (7%) | 7 (8%) | 13 (14%) | 10 (10%) | <0.01 |
| Hypertension | 241 (57%) | 61 (43%) | 54 (61%) | 58 (63%) | 68 (69%) | <0.001 |
| Current use of any antihypertensive medication | 118 (28%) | 26 (19%) | 27 (31%) | 29 (31%) | 36 (36%) | 0.01 |
| Current use of any statin | 93 (22%) | 18 (13%) | 19 (22%) | 25 (27%) | 31 (31%) | <0.01 |
| Current use of any lipid-lowering medication | 158 (38%) | 43 (31%) | 30 (34%) | 41 (45%) | 44 (44%) | 0.06 |
| Current use of calcium supplement | 178 (42%) | 75 (53%) | 37 (42%) | 35 (38%) | 31 (31%) | <0.01 |
| Current use of vitamin D supplement | 96 (23%) | 36 (26%) | 21 (24%) | 22 (24%) | 17 (17%) | 0.48 |
⁎ Kruskal-Wallis tests for continuous variables and Pearson’s chi-square tests for categorical variables.
At the time of first CAC measurement in 2000 and 2001, 1/3 of these older participants had no or minimal CAC (≤10), and nearly 1/4 had severe CAC (≥400). As expected, CAC severity increased with age, and greater CAC was more common in men. Serum 25(OH)D, 1,25(OH) 2 D, and intact parathyroid hormone levels did not differ significantly by CAC. Vitamin D supplement use was not associated with CAC, and calcium supplement use was less common in those with higher CAC. Antihypertensive medications were used by 1/4 of participants, mainly diuretics (n = 47), calcium channel blockers (n = 46), β blockers (n = 39), and angiotensin-converting enzyme inhibitors (n = 27).
In separate unadjusted models using ordinal logistic regressions, there were no statistically significant associations between decrease in eGFR or increase in ACR and CAC severity ( Table 2 ). When eGFR and ACR were modeled jointly (mutually adjusting for eGFR and ACR) and in interaction (eGFR × ACR) models, neither the main nor the interaction term was significantly associated with CAC severity ( Table 2 ). These null findings persisted in models adjusting for traditional CVD risk factors (age, sex, body mass index, systolic blood pressure, fasting glucose, high-density lipoprotein cholesterol, and triglycerides; Table 2 ) and in a multivariate model including all these and additional CVD and kidney covariates biologically implicated in vascular calcium (smoking, low-density lipoprotein cholesterol, 25[OH]D, 1,25[OH] 2 D, intact parathyroid hormone, lipid-lowering medications, antihypertensive medications, and calcium and vitamin D supplements; data not shown). There was no effect modification of CAC severity by age or sex (data not shown; p values for interaction >0.16), and sex-stratified analyses showed no important difference (data not shown). Repeating analyses using logistic regression for CAC ≥101 versus <100 or linear regression using continuous CAC also revealed no statistically significant associations (data not shown).
| Model | Sample Size | eGFR ⁎ (n = 421) | Urine ACR † (n = 362) | ||
|---|---|---|---|---|---|
| OR (95% CI) | p Value | OR (95% CI) | p Value | ||
| 1 | 421 | 0.95 (0.80–1.12) | 0.52 | — | |
| 2 | 421 | 1.01 (0.85–1.20) | 0.91 | — | |
| 3 | 420 | 0.99 (0.82–1.19) | 0.90 | — | |
| 1 | 362 | — | 1.04 (0.85–1.27) | 0.68 | |
| 2 | 362 | — | 1.07 (0.86–1.33) | 0.55 | |
| 3 | 361 | — | 1.00 (0.81–1.23) | 0.98 | |
| 1 | 362 | 0.93 (0.77–1.23) | 0.48 | 1.05 (0.86–1.28) | 0.66 |
| 2 | 362 | 1.03 (0.85–1.25) | 0.77 | 1.07 (0.86–1.33) | 0.56 |
| 3 | 361 | 0.99 (0.81–1.22) | 0.94 | 1.00 (0.81–1.24) | 1.00 |
| 1 | 362 | 0.94 (0.78–1.14) | 0.56 | 0.99 (0.80–1.24) | 0.95 |
| 2 | 362 | 1.02 (0.84–1.24) | 0.85 | 1.11 (0.89–1.39) | 0.37 |
| 3 | 361 | 1.01 (0.81–1.22) | 0.91 | 0.99 (0.80–1.27) | 0.91 |
⁎ OR for a 1-SD decrease in eGFR.
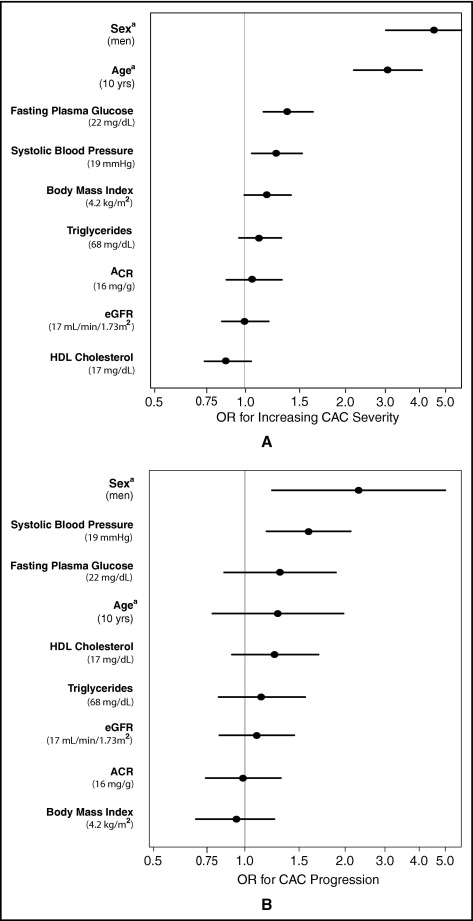
To aid interpretation of the null results observed in this study, Figure 2 compares the cross-sectional associations of eGFR and ACR with CAC severity to those of other CVD covariates in separate models adjusting for age and sex. Results are presented per population 1-SD increase for continuous variables (except age, which is per 10 years) and for male gender. As expected, age and sex were strongly associated with CAC severity; systolic blood pressure and fasting plasma glucose were weakly associated with CAC. Point estimates for eGFR, ACR, body mass index, triglycerides, and high-density lipoprotein cholesterol were near 1 and not significant. Importantly, the confidence intervals around the associations of eGFR and ACR with CAC were narrow and similar to those of other covariates, suggesting that any missed association would be small.
Compared to 338 participants who returned for repeat CAC scans a mean of 4.5 ± 0.5 years after the first scan, 84 participants who did not were older (71 vs 66 years, p <0.001) at baseline and had higher systolic blood pressure (135 vs 129 mm Hg, p = 0.02) but did not differ significantly by baseline eGFR (75 vs 79 ml/min/1.73 m 2 ) or median ACR (9.8 vs 10.2 mg/g).
Table 3 lists the differences in baseline characteristics among 157 participants (46%) with and 181 (54%) without CAC progression. Similar to baseline CAC, CAC progression was more common in men than women, but those with CAC progression were not significantly older than those without.
| Characteristic | All (n = 338) | Progression | p Value † | |
|---|---|---|---|---|
| No (n = 181 [54%]) | Yes (n = 157 [46%]) | |||
| Age (years) | 66 ± 7 | 66 ± 7 | 67 ± 6 | 0.13 |
| Systolic blood pressure (mm Hg) | 129 ± 18 | 126 ± 16 | 133 ± 19 | <0.001 |
| Body mass index (kg/m 2 ) | 26 ± 4 | 26 ± 4 | 27 ± 4 | 0.45 |
| Fasting plasma glucose (mg/dl) | 103 ± 21 | 101 ± 13 | 106 ± 28 | 0.03 |
| Low-density lipoprotein (mg/dl) | 123 ± 30 | 121 ± 29 | 126 ± 32 | 0.19 |
| High-density lipoprotein (mg/dl) | 59 ± 17 | 60 ± 17 | 58 ± 16 | 0.51 |
| Triglycerides (mg/dl) | 130 ± 71 | 128 ± 70 | 132 ± 65 | 0.59 |
| Serum calcium (mg/dl) | 9 ± 0.3 | 9 ± 0.3 | 9 ± 0.3 | 0.96 |
| 25(OH)D (ng/ml) | 44 ± 15 | 43 ± 14 | 45 ± 15 | 0.15 |
| 1,25(OH) 2 D (pg/ml) | 34 ± 18 | 34 ± 15 | 35 ± 22 | 0.53 |
| Intact parathyroid hormone (pg/ml) | 49 ± 24 | 50 ± 28 | 47 ± 19 | 0.21 |
| Serum creatinine (mg/dl) | 0.9 ± 0.4 | 0.9 ± 0.2 | 1.0 ± 0.6 | 0.08 |
| eGFR (ml/min/1.73 m 2 ) | 79 ± 17 | 79 ± 17 | 78 ± 16 | 0.54 |
| Urine ACR (mg/g) | 10 (6–18) | 10 (6–18) | 10 (7–15) | 0.93 |
| Women | 182 (54%) | 112 (62%) | 70 (45%) | <0.01 |
| Exercise ≥3 times per week | 258 (76%) | 139 (77%) | 119 (76%) | 0.83 |
| Current smoker at baseline | 18 (5%) | 9 (5%) | 9 (6%) | 0.76 |
| Diabetes mellitus | 21 (6%) | 8 (4%) | 13 (8%) | 0.13 |
| Hypertension | 191 (57%) | 87 (48%) | 104 (66%) | 0.01 |
| Baseline use of any antihypertensive medication | 94 (28%) | 44 (24%) | 50 (32%) | 0.12 |
| Baseline use of any statin | 77 (23%) | 34 (19%) | 43 (28%) | 0.06 |
| Current use of any statin at second scan | 68 (20%) | 29 (16%) | 39 (25%) | 0.04 |
| Baseline use of any lipid-lowering medication | 130 (39%) | 63 (35%) | 67 (43%) | 0.14 |
| Current use of any lipid-lowering medication at second scan | 68 (20%) | 29 (16%) | 39 (25%) | 0.04 |
| Baseline use of calcium supplement | 144 (43%) | 82 (46%) | 62 (40%) | 0.26 |
| Baseline use of vitamin D supplement | 77 (24%) | 45 (25%) | 32 (20%) | 0.33 |
Stay updated, free articles. Join our Telegram channel

Full access? Get Clinical Tree


