Type 1 diabetes mellitus (DM) is associated with early atherosclerosis and increased cardiovascular mortality. The relation between carotid intima–media thickness (cIMT), a marker of subclinical atherosclerosis, and left ventricular (LV) mass, an independent predictor of cardiovascular morbidity, has not been previously studied in type 1 DM. The Epidemiology of Diabetes Interventions and Complications (EDIC) study is a multicenter observational study designed to follow up the Diabetes Control and Complications Trial (DCCT) cohort. LV mass was measured with cardiac magnetic resonance imaging at EDIC year 15 and common cIMT was assessed using B-mode ultrasound at EDIC year 12. Multivariable linear regression models were used to assess the relation between cIMT at year 12 and LV mass at year 15. In total 889 participants had cardiac magnetic resonance imaging and cIMT measurements available for these analyses. At EDIC year 15, mean age of the participants was 49 ± 7 years, mean DM duration was 28 ± 5 years, and 52% were men. Spearman correlation coefficient (r) between LV mass and cIMT was 0.33 (p <0.0001). After adjusting for basic covariates (machine, reader, age, and gender), a significant association between LV mass and cIMT (estimate 2.0 g/m 2 per 0.1-mm cIMT increment, p <0.0001) was observed. This association was decreased by the addition of systolic blood pressure, in particular 1.15 g/m 2 per 0.1-mm cIMT increment (p <0.0001), and to a lesser extent other cardiovascular disease risk factors. Furthermore, the relation observed between LV mass and cIMT was stronger in patients with shorter duration of DM. In conclusion, cIMT was an independent predictor of larger LV mass in a well-characterized population with type 1 DM.
Parallel relations have been demonstrated between carotid intima–media thickness (cIMT) and left ventricular (LV) mass in population studies and particularly well documented in hypertensive populations. In this report we examine the relation between cIMT and LV mass in a cohort of patients with type 1 diabetes mellitus (DM). We further explore how traditional cardiovascular risk factors and diabetic factors affect the association between cIMT and LV mass. We hypothesized that delineation of these interrelations would provide a better understanding of the mechanism of end-organ remodeling in type 1 DM and offer increased prognostic information for risk stratification.
Methods
The study designs for the Diabetes Control and Complications Trial (DCCT) and the Epidemiology of Diabetes Interventions and Complications (EDIC) study have been described elsewhere. Briefly, 1,441 patients with type 1 DM 13 to 39 years old without cardiovascular disease, hypertension, or hypercholesterolemia at baseline were recruited and randomly assigned to intensive or conventional diabetes therapy. More than 90% of the surviving DCCT cohort (1,301 subjects) agreed to be followed up in the EDIC study, which was designed as a prospective observational follow-up study of the DCCT cohort ( Figure 1 ). The study was approved by the institutional review boards of all participating centers and all participants gave written informed consent.
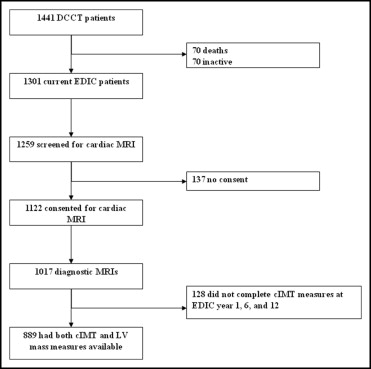
One thousand one hundred twenty-two participants from the EDIC cohort consented and were eligible for cardiac magnetic resonance imaging (MRI) examination, which was done at EDIC year 15 ( Figure 1 ). Details of the cardiac MRI protocol have been previously described. Briefly, participants were scanned with 1.5-T magnets in all but 1 center, which had a 3-T magnet. Cardiac cine images were acquired in 2-chamber, 4-chamber, and short-axis planes with breath holds using an electrocardiograph-triggered steady-state free-precession pulse sequence (repetition time <3.8 ms, echo time minimized milliseconds, flip angle maximized, spatial resolution 2.5 × 2 × 8 mm, slice gap 2 mm, temporal resolution 30 to 50 ms). All cardiac MRI studies were evaluated and quantified at a single reading center by readers who were blinded to patients’ clinical information. LV mass, volumes, and functional parameters were determined from short-axis cine images covering the heart from base to apex throughout the cardiac cycle using QMASS 6 (Medis, Leiden, the Netherlands). The intraclass correlation coefficient and percent technical error of measurement for LV mass were 0.96 and 4.52% respectively.
Measurement of cIMT has been described in detail. cIMT was measured 3 times during the EDIC study, at baseline and years 6 and 12. A single longitudinal lateral view of the distal right and left common carotid arteries was obtained. Studies were performed by certified technicians at clinical centers, recorded on videotapes, and read in a central unit (Tufts University, Boston, Massachusetts) by 2 single readers who were unaware of subjects’ diagnostic groups, treatment assignments, and time of studies. Mean of the maximum IMT of the common carotid artery was defined as the mean of the maximum value for the near and far walls on the right and left sides. Intraclass correlation coefficient for cIMT measurements was 0.71. Because there was only a single measure available for cardiac MRI, we used the cIMT measure from EDIC year 12 because this was obtained closest to the time of the cardiac MRI study.
During the DCCT participants underwent an annual medical history and physical examination, electrocardiography, and laboratory testing for fasting lipid levels, serum creatinine values, and other risk factors for cardiovascular disease. Glycated hemoglobin (hemoglobin A1c) values were measured quarterly. During the EDIC follow-up study the same methods used in the DCCT were continued, but hemoglobin A1c was measured annually, and fasting lipid levels and renal function indexes were measured in alternate years. Hypertension was defined as blood pressure ≥140/90 mm Hg or use of antihypertensive medications. Hyperlipidemia was defined as low-density lipoprotein (LDL) levels ≥130 mg/dl or use of lipid-lowering medication. Macroalbuminuria was defined by urinary excretion of albumin ≥300 mg during a 24-hour period or end-stage renal disease.
Clinical characteristics of DCCT/EDIC participants, measured immediately before or at time of cardiac MR scan, are reported as mean ± SD or percentage as appropriate. Differences between participants and nonparticipants or men and women were compared using Wilcoxon rank-sum test for quantitative variables and chi-square test for categorical variables. Adjustment for body size was made by dividing LV mass by body surface area (LV mass index). Relation between cIMT and LV mass index was evaluated using the Spearman correlation coefficient. Multivariable linear regression models were used to study the association between LV mass and cIMT after adjusting for basic covariates: age, gender, MRI scan, primary versus secondary cohort, and cIMT reader and machine. Further models included cardiovascular risk factors: current smoking, mean systolic blood pressure over the DCCT/EDIC, mean LDL cholesterol, mean hemoglobin A1c, attained duration of DM, and history of macroalbuminuria. Covariate mean values were weighted means where values at each visit were weighted by the interval between values owing to differences in visit schedules during the DCCT and EDIC. The most significant factor for the multivariate association among similar variables (e.g., systolic and diastolic blood pressures) was used. Strength of a covariate effect was measured by the semipartial type II R 2 , which is the change in model R 2 when that covariate is dropped from the model, expressed as a percentage. The 2-way interaction between cIMT and each risk factor was assessed, and the interaction of cIMT and attained DM duration was significant in the final full model. cIMT and DM duration are continuous variables so the slope for regression of LV mass on cIMT over the range of attained duration is presented. All analyses were performed using SAS 9.2 (SAS Institute, Cary, North Carolina). A p value <0.05 was considered statistically significant.
Results
Cardiac MRI and cIMT measurements were available in 889 participants ( Figure 1 ). Comparison of included subjects to excluded subjects ( Table 1 ) showed no significant differences in age, gender, DM duration, treatment assigned, renal function, body mass index, systolic and diastolic blood pressures, or total cholesterol levels. However, hemoglobin A1c levels, percentage of participants who were current smokers, and total triglyceride levels were significantly lower in subjects included in the present study versus values in those not included.
| Clinical Characteristics | Included (n = 889) | Excluded (n = 552) | p Value ⁎ |
|---|---|---|---|
| Women | 47.5% | 46.7% | 0.787 |
| Primary | 49.0% | 52.5% | 0.197 |
| Intensive | 51.2% | 46.4% | 0.076 |
| DCCT baseline | |||
| Age (years) | 27 ± 7 | 27 ± 8 | 0.775 |
| Adult | 88.3% | 83.5% | 0.010 |
| Diabetes duration (years) | 5.8 ± 4.2 | 5.4 ± 4.1 | 0.072 |
| Smoker | 16.1% | 22.3% | 0.003 |
| Body mass index (kg/m 2 ) | 23.3 ± 2.7 | 23.5 ± 3.0 | 0.411 |
| Hemoglobin A1c | 8.7% ± 1.5 | 9.1% ± 1.7 | <0.0001 |
| Serum cholesterol | |||
| Total (mg/dl) | 175 ± 33 | 178 ± 34 | 0.309 |
| High-density lipoprotein (mg/dl) | 50 ± 12 | 51 ± 12 | 0.466 |
| Low-density lipoprotein (mg/dl) | 109 ± 29 | 110 ± 30 | 0.910 |
| Triglycerides (mg/dl) | 79 ± 45 | 85 ± 51 | 0.029 |
| Blood pressure (mm Hg) | |||
| Systolic | 114 ± 11 | 115 ± 12 | 0.080 |
| Diastolic | 73 ± 8 | 73 ± 9 | 0.570 |
| Renal function | |||
| Serum creatinine † | 0.81 ± 0.15 | 0.80 ± 0.15 | 0.344 |
| Log albumin excretion rate (mg/24 hours) | 2.39 ± 0.78 | 2.47 ± 0.80 | 0.098 |
| Albumin excretion rate ≥30 mg/24 hours | 9.8% | 12.7% | 0.086 |
| Estimated glomerular filtration rate (ml/min/1.73 m 2 ) | 112 ± 26 | 114 ± 28 | 0.183 |
| Estimated glomerular filtration rate <60 ml/min/1.73 m 2 | 0% | 0.4% | 0.073 |
| Weight gain (DCCT baseline to close-out) | 6.9 ± 7.8 | 8.3 ± 9.4 | 0.061 |
⁎ Based on chi-square test for categorical variables and Wilcoxon rank-sum test for continuous variables.
† No one had serum creatinine ≥2 mg/dl at Diabetes Control and Complications Trial baseline.
Clinical characteristics of study participants at time of cardiac MRI stratified by gender are presented in Table 2 . Most participants were white and 53% were men. Mean age was slightly older for men than women. Men had higher body mass index, higher systolic blood pressure, higher diastolic blood pressure, higher triglyceride levels, and lower high-density lipoprotein cholesterol than women and were more likely to be on antihypertensive and lipid-lowering medications than women. Men were also more likely to have albuminuria. Men and women had similar attained duration of DM, weighted hemoglobin A1c levels, and LDL cholesterol levels. A smaller proportion of women than men were on angiotensin-converting enzyme inhibitors or angiotensin receptor blockers. LV mass indexed for body surface area and cIMT measurements were significantly higher in men than women and cIMT was significantly higher in men compared to women ( Table 2 ).
| Variable | Women (n = 422) | Men (n = 467) | p Value ⁎ |
|---|---|---|---|
| White | 96.7% | 96.6% | 0.857 |
| Attained age (years) | 49 ± 7 | 50 ± 6 | 0.005 |
| Attained duration of diabetes mellitus (years) | 27.8 ± 4.9 | 27.4 ± 4.8 | 0.207 |
| Current cigarette smoker | 10.7% | 12.0% | 0.533 |
| Body mass index (kg/m 2 ) | 27.9 ± 5.3 | 28.2 ± 4.1 | 0.043 |
| Body mass index ≥25 kg/m 2 | 67.1% | 75.8% | 0.004 |
| Body mass index ≥30 kg/m 2 | 30.3% | 31.1% | 0.817 |
| Natural waist-to-hip ratio | 0.80 ± 0.07 | 0.91 ± 0.07 | <0.0001 |
| Mean systolic blood pressure (mm Hg) | 115 ± 8 | 120 ± 7 | <0.0001 |
| Mean diastolic blood pressure (mm Hg) | 72 ± 5 | 76 ± 5 | <0.0001 |
| Hypertension † | 45.0% | 52.9% | 0.019 |
| Antihypertensive medication | 36.3% | 44.5% | 0.012 |
| Hemoglobin A1c | |||
| Before cardiac magnetic resonance imaging | 8.0 ± 1.3 | 7.8 ± 1.2 | 0.063 |
| Mean hemoglobin A1c | 8.0 ± 1.0 | 7.9 ± 1.0 | 0.282 |
| Mean high-density lipoprotein cholesterol (mg/dl) | 60 ± 12 | 50 ± 11 | <0.0001 |
| Mean low-density lipoprotein cholesterol (mg/dl) | 110 ± 20 | 111 ± 21 | 0.523 |
| Mean total cholesterol (mg/dl) | 186 ± 23 | 178 ± 24 | <0.0001 |
| Mean triglyceride (mg/dl) | 78 ± 35 | 89 ± 45 | 0.0006 |
| Hypercholesterolemia ‡ | 54.3% | 72.4% | <0.0001 |
| Lipid-lowering medication | 47.6% | 67.5% | <0.0001 |
| Albumin excretion rate ≥30 mg/24 hours or end-stage renal disease (sustained) | 23.7% | 28.3% | 0.121 |
| Albumin excretion rate ≥300 mg/24 hours or end-stage renal disease (ever) | 6.6% | 11.4% | 0.015 |
| Estimated glomerular filtration rate <60 ml/min/1.73 m 2 | 7.8 | 4.9 | 0.075 |
| Left ventricular mass/body surface area (g/m 2 ) | 64.0 ± 10.3 | 76.5 ± 12.2 | <0.0001 |
| Common intima–media thickness year 12 (mm) | 0.65 ± 0.10 | 0.71 ± 0.16 | <0.0001 |
| Any angiotensin-converting enzyme inhibitor or angiotensin receptor blocker | 49.1% | 58.7% | 0.004 |
| Any β blocker | 8.1% | 7.9% | 0.941 |
⁎ Based on chi-square test for categorical variables and Wilcoxon rank-sum test for continuous variables.
† Blood pressure ≥140/90 mm Hg or use of antihypertensive medications.
‡ Low-density lipoprotein levels ≥130 mg/dl or use of lipid-lowering medication.
cIMT was significantly correlated with LV mass (r = 0.33, p <0.0001) and LV mass indexed to body surface area (r = 0.28, p <0.0001). In the basic adjusted model LV mass index was greater by 2 g/m 2 for every 0.1-mm higher common cIMT (semipartial R 2 = 3.8%, p <0.0001; Table 3 , basic model). In a model further adjusted for current smoking, presence of macroalbuminuria/end-stage renal disease, attained DM duration, mean systolic blood pressure, mean LDL cholesterol, and hemoglobin A1c, the association between LV mass and cIMT was attenuated but remained statistically significant ( Table 3 , fully adjusted model). Proportion of variability explained by covariates included in the basic model was 30% and that by the fully adjusted model was 40%. To assess the effect of individual risk factors on the relation between cIMT and LV mass index, we further developed a series of regression models over the basic model where each risk factor was added individually to the basic model ( Table 4 ). We compared the R 2 of the new model thus generated to the R 2 of the basic model and the change if any for the beta coefficient between cIMT and LV mass index. The greatest changes in the model R 2 and the semipartial R 2 for cIMT were seen after adding mean systolic blood pressure or a history of end-stage renal disease to the basic model, whereas other risk factors only minimally changed these R 2 values. Although the 2 models including systolic blood pressure or end-stage renal disease were comparable in extent of variability explained for LV mass, the model obtained by adding systolic blood pressure decreased the beta estimate for cIMT by 42.5%, whereas end-stage renal disease decreased the beta estimate for cIMT by only 16.5%.
| Variable | LV Mass (g/m 2 ) | |||||
|---|---|---|---|---|---|---|
| Basic Model ⁎ (R 2 = 30%) | Fully Adjusted Model (R 2 = 40%) | |||||
| Semipartial R 2 (%) | Estimate of Beta ± SE | p Value | Semipartial R 2 (%) | Estimate of Beta ± SE | p Value | |
| Age | 1.41 | −0.25 ± 0.06 | <0.0001 | 1.14 | −0.23 ± 0.06 | <0.0001 |
| Men vs women | 19.33 | 11.84 ± 0.77 | <0.0001 | 13.34 | 10.06 ± 0.73 | <0.0001 |
| Cohort † (secondary vs primary) | 0.35 | −1.56 ± 0.75 | 0.0365 | 0.001 | −0.15 ± 1.04 | 0.8880 |
| Smoking | 1.10 | 4.34 ± 1.09 | <0.0001 | |||
| Attained duration (per year) | 0.36 | −0.24 ± 0.11 | 0.0239 | |||
| Mean systolic blood pressure ‡ | 2.86 | 0.32 ± 0.05 | <0.0001 | |||
| Mean low-density lipoprotein ‡ | 0.74 | −0.06 ± 0.02 | 0.0011 | |||
| Mean hemoglobin A1c ‡ | 0.000 08 | 0.01 ± 0.40 | 0.9737 | |||
| Albumin excretion rate ≥300 mg/24 hours/end-stage renal disease | 2.82 | 8.27 ± 1.30 | <0.0001 | |||
| Common intima–media thickness (per 0.1 mm) | 3.79 | 2.00 ± 0.29 | <0.0001 | 1.22 | 1.19 ± 0.29 | <0.0001 |
Stay updated, free articles. Join our Telegram channel

Full access? Get Clinical Tree


