Obesity paradox is consistently demonstrated in cohorts of patients with systolic heart failure (HF). Recent reports suggest that cardiorespiratory fitness modifies the relation between adiposity measurements and mortality. We aimed to investigate the combined effect of obesity and physical capacity, measured by body mass index (BMI) and 6-minute walk distance (SMWD) test, respectively, on the prognosis of patients with systolic HF. We studied 543 consecutive patients with advanced systolic HF at their initial visit to the HF clinic. SMWD was categorized as low (<300 m) or high (≥300 m) physical capacity and BMI according to standard classification. Association of the BMI × SMWD product (kilogram per meter) with total mortality was assessed by Cox proportional hazards analyses. There were 216 deaths during a mean follow-up of 40 months. Obesity paradox was observed in the study cohort but was attenuated in the high physical capacity group. High compared with low physical capacity was associated with significant survival benefit in both the normal-weight and obese patients subgroups (log-rank p = 0.003 and p = 0.009, respectively). A progressive inverse relation between quartiles of BMI × SMWD product and mortality risk was observed. Compared with the lower quartile (Q1, reference group), Q2 had hazard ratio (HR) of 0.69 (95% confidence interval [CI] 0.49 to 0.97), Q3 had HR of 0.64 (95% CI 0.44 to 0.93), and Q4 had HR of 0.40 (95% CI 0.25 to 0.65). In conclusion, obesity paradox exists in patients with systolic HF but is modified by the degree of physical capacity. Therefore, the combined parameter of BMI × SMWD product is more reliable in predicting long-term mortality risk in patients with systolic HF.
Emerging data suggest an association among cardiorespiratory fitness level, adiposity, and mortality in heart failure (HF) and cardiovascular diseases. We aimed to assess the combined prognostic effect of body mass index (BMI) and physical capacity in a cohort of patients with advanced systolic HF, evaluated at their first visit to an outpatient HF clinic. In difference from the aforementioned studies, we used the 6-minute walk distance (SMWD) test as a measure of physical capacity. The SMWD test, a significant prognostic marker in HF, is simple to perform, reflects physical capacity, and was recently reported by Forman et al to provide a similar prognostic utility in systolic HF, comparable with the more complex and expensive cardiopulmonary exercise test. Moreover, it may be more suitable for some of the obese patients to accomplish an SMWD test than regular treadmill testing. Accordingly, we used an innovative index, multiplication product of BMI and SMWD (kilogram per meter), and assessed its joint impact on mortality in patients with systolic HF.
Methods
Study population included 545 consecutive patients with chronic systolic HF (>3-month symptomatic HF disease) defined as left ventricular ejection fraction <40%. Two patients had BMI <18.5 kg/m 2 and were excluded from data analysis because of a small group size of underweight patients. All subjects had documented BMI and SMWD measurements, carried out at their first visit to a tertiary outpatient HF clinic.
BMI was categorized according to World Health Organization definitions as normal weight (18.5 to 24.9 kg/m²), overweight (25 to 29.9 kg/m²), or obese (≥30 kg/m²). SMWD test was conducted in a standardized format according to accepted guidelines. Low physical capacity was defined as SMWD <300 m, a common prognostic cutoff of reduced functional exercise capacity in HF studies.
Baseline characteristics and co-morbidities were obtained from patients’ computerized medical records and routinely ascertained during the initial visit to the HF clinic in all patients. Data included hypertension, diabetes, coronary artery disease, paroxysmal or permanent atrial fibrillation, New York Heart Association grade, laboratory values of hemoglobin and creatinine, and treatment with β blockers, angiotensin-converting enzyme inhibitors or angiotensin receptor blockers, and aldosterone antagonists. Two-dimensional echocardiographic studies were performed in all patients. Data concerning all-cause mortality were gathered from patients’ electronic files and computerized records of health maintenance organizations. The study was approved by the Carmel Medical Center Institutional Review Board.
Continuous data are presented as means ± SD and categorical variables as numbers or percentages. The independent-samples t test and the 1-way analysis of variance were used to compare continuous variables, and the chi-square test was used to compare categorical variables. Survival curves were plotted by the Kaplan-Meier method using the log-rank test for comparison between variables. To assess the joint association of BMI and SMWD at baseline evaluation with the risk of all-cause mortality, the multiplication product of BMI and SMWD (kilogram per meter) was calculated for each patient, and a multivariate analysis was performed by the Cox proportional hazards regression analysis. Hazard ratios (HRs) for death were calculated, with 95% confidence intervals (CIs) in parentheses. Adjustment was made for other risk factors and baseline characteristics including gender, age, hypertension, diabetes mellitus, history of myocardial infarction, paroxysmal or permanent atrial fibrillation, renal dysfunction, and ejection fraction. The results were considered statistically significant when p value was <0.05. The SPSS statistical software, version 20.0 (IBM Corporation, Armonk, New York), was used to perform all statistical analyses.
Results
There were 543 patients (81% men) included in the analysis. Mean age was 64 ± 13 years. Most patients had advanced HF, with 53% New York Heart Association functional class III or IV, at their initial index visit to the HF clinic. During a mean follow-up period of 40 ± 26 months (median 35), 216 patients (40%) died.
Dividing the patients’ BMI levels according to World Health Organization categories defined 150 patients (28%) as normal weight, 202 (37%) as overweight, and 191 (35%) as obese. Baseline clinical characteristics according to BMI categories in patients with low (SMWD <300 m) and high (SMWD ≥300 m) physical capacity are presented in Table 1 . Hypertension and diabetes were significantly more prevalent in overweight and obese subjects. Low physical capacity patients tended to be older, with a higher prevalence of co-morbidities.
| Variable | SMWD | |||||||
|---|---|---|---|---|---|---|---|---|
| <300 m | ≥300 m | |||||||
| Normal Weight | Overweight | Obese | p Value | Normal Weight | Overweight | Obese | p Value | |
| Age (yrs) | 69.8 ± 13.0 | 68.4 ± 11.6 | 64.5 ± 12.3 | 0.01 | 59.9 ± 16.3 | 60.4 ± 13.8 | 56.3 ± 10.2 | 0.144 |
| Men | 72 (84) | 97 (82) | 86 (72) | 0.06 | 52 (81) | 72 (86) | 64 (90) | 0.321 |
| BSA | 1.71 ± 0.13 | 1.85 ± 0.15 | 2.05 ± 1.17 | <0.001 | 1.73 ± 0.13 | 1.90 ± 0.14 | 2.16 ± 0.18 | <0.001 |
| BMI (kg/m²) | 22.8 ± 1.6 | 27.1 ± 1.5 | 34.3 ± 3.8 | <0.001 | 22.5 ± 1.8 | 27.1 ± 1.4 | 33.9 ± 3.4 | <0.001 |
| Ejection fraction (%) | 24 ± 7 | 24 ± 7 | 26 ± 6 | 0.09 | 24 ± 6 | 25 ± 6 | 25 ± 7 | 0.658 |
| NYHA class | 3.07 ± 0.73 | 2.95 ± 0.70 | 2.95 ± 0.73 | 0.417 | 2.14 ± 0.80 | 2.04 ± 0.63 | 2.08 ± 0.58 | 0.628 |
| Hypertension | 45 (52) | 80 (68) | 91 (76) | 0.002 | 23 (36) | 37 (45) | 38 (53) | 0.04 |
| Diabetes mellitus | 29 (34) | 59 (50) | 68 (57) | 0.004 | 18 (28) | 28 (34) | 33 (47) | 0.03 |
| Previous myocardial infarction | 47 (55) | 85 (72) | 77 (64) | 0.237 | 34 (53) | 50 (60) | 32 (45) | 0.171 |
| Atrial fibrillation | 30 (35) | 44 (37) | 42 (35) | 0.915 | 18 (28) | 15 (18) | 19 (27) | 0.286 |
| Creatinine level (mg/dl) | 1.51 ± 0.87 | 1.41 ± 0.78 | 1.35 ± 0.56 | 0.323 | 1.20 ± 0.61 | 1.20 ± 0.59 | 1.17 ± 0.75 | 0.940 |
| β-Blocker treatment | 76 (88) | 113 (96) | 112 (93) | 0.181 | 58 (91) | 82 (98) | 68 (96) | 0.172 |
| ACEI/ARB treatment | 72 (84) | 101 (85) | 109 (91) | 0.274 | 53 (83) | 78 (94) | 63 (89) | 0.537 |
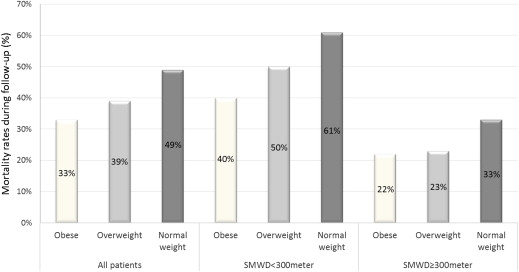
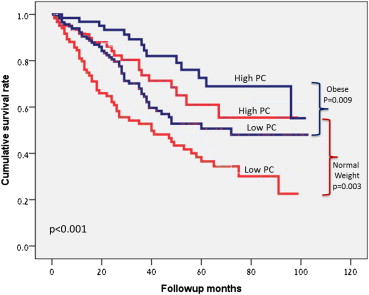
In the overall study group, mortality during follow-up was highest in the normal-weight patients (49%), lower in the overweight (39%), and lowest in the obese subjects (30%) demonstrating an obesity paradox (p = 0.017; Figure 1 ). When taking physical ability into consideration, the lower physical capability group showed the same significant linear inverse relation between BMI categories and mortality (p = 0.015) as the overall study population, but this association was significantly attenuated in the high physical capability group (p = 0.22); albeit the tendency for lower mortality rates in overweight and obese patients was retained ( Figure 1 ). In addition, high physical capacity was associated with better survival compared with lower physical capacity in both the obese and the normal-weight groups of patients (log-rank p = 0.009 and p = 0.003, respectively; Figure 2 ).


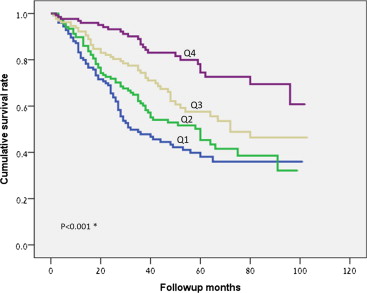
The multiplication product of BMI and SMWD (kilogram per meter) was used to assess the joint impact of adiposity level and physical capacity on mortality. Mean BMI × SMWD product was 7,079 kg/m (range 287 to 19,562 and median 6,797). Figure 3 shows Kaplan-Meier survival curves according to quartiles of BMI × SMWD product. Long-term survival rate was significantly better in both of the upper quartiles (Q4 and Q3) compared with each of the lower quartiles (Q2 and Q1; overall log-rank test p <0.001). HRs for all-cause mortality are presented in Table 2 for each quartile of BMI × SMWD product, including after adjustment for gender, age, hypertension, diabetes, history of myocardial infarction, paroxysmal or permanent atrial fibrillation, renal function, and ejection fraction ( Figure 4 ). Compared with the lowest quartile (Q1, reference group), patients in the higher quartiles had significantly reduced risk for mortality, in a declining pattern (Q2: HR 0.69, 95% CI 0.49 to 0.97, p = 0.03; Q3: HR 0.64, 95% CI 0.44 to 0.93, p = 0.02; and Q4: HR 0.40, 95% CI 0.25 to 0.65, p <0.001), illustrating a combined protective effect of high BMI and increased SMWD levels on mortality risk.

| BMI × SMWD | No. of Deaths (%) | Model 1, HR (95% CI) ∗ | Model 2, HR (95% CI) † | Model 3, HR (95% CI) ‡ |
|---|---|---|---|---|
| Quartile 1 | 71 (54) | 1 (Reference) | 1 (Reference) | 1 (Reference) |
| Quartile 2 | 67 (48) | 0.78 (0.56–1.10) | 0.67 (0.47–0.94) | 0.69 (0.49–0.97) |
| Quartile 3 | 51 (37) | 0.55 (0.38–0.80) | 0.56 (0.39–0.80) | 0.64 (0.44–0.93) |
| Quartile 4 | 26 (19) | 0.27 (0.17–0.42) | 0.38 (0.23–0.62) | 0.40 (0.25–0.65) |
Stay updated, free articles. Join our Telegram channel

Full access? Get Clinical Tree


