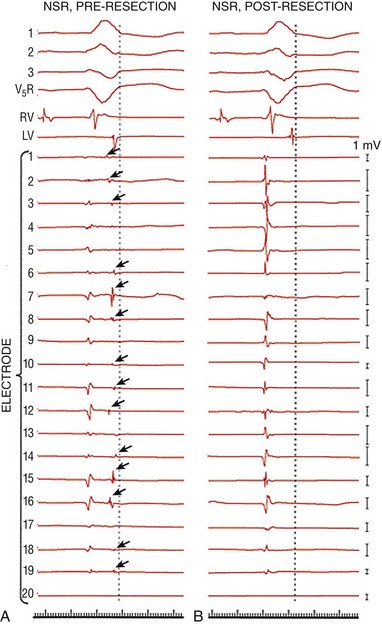
84 The most common anatomical substrate for monomorphic ventricular tachycardia (VT) is extensive healed myocardial infarction with resultant left ventricular (LV) dysfunction. The extent of myocardial scar and the degree of LV dysfunction are the most important determinants of arrhythmia risk after infarction.1,2 Patients with tolerated VT have more extensive scar, more frequent incidence of discrete LV aneurysm, and more pronounced LV dysfunction than patients with nonsustained VT or sudden cardiac death. The electrophysiological substrate for monomorphic VT gradually develops over the first 2 weeks after myocardial infarction and once established appears to remain indefinitely.3 The incidence of sustained monomorphic VT after myocardial infarction had traditionally been 3%; however, contemporary therapy with an early revascularization strategy has led to smaller infarcts with less frequent aneurysm formation and thus has reduced the incidence of VT to less than 1%.4 Nonetheless, this lower incidence of VT is balanced by increased prevalence owing to an aging population with a greater number of surviving patients at risk. It is unclear whether aggressive revascularization coupled with improved pharmacotherapies aimed at limiting cardiac remodeling has fundamentally changed the pathophysiology of ventricular arrhythmias. It is, however, perceivable that the resultant smaller and often patchy infarcts are associated with more limited conduction abnormalities, and thus result in faster and less well tolerated ventricular arrhythmias. During the infarct healing process, necrotic myocardium is replaced with fibrous tissue that surrounds surviving myocytes. In addition, the reduced number of gap junctions coupled with altered cellular distribution results in a slow, nonuniform anisotropic conduction that may promote reentry. Other electrophysiological consequences of infarction include abnormalities in refractoriness, inexcitability, and enhanced automaticity, all of which may contribute to arrhythmogenicity. However, abnormalities of conduction are most prominent and provide the electrophysiological substrate for VT.5 Abnormalities of conduction can be described in terms of electrogram characteristics and endocardial activation in sinus rhythm. Endocardial recordings from sites of VT origin during sinus rhythm consistently demonstrate low amplitude, prolonged duration, and multicomponent potentials frequently occurring after the end of the QRS (Figures 84-1 and 84-2). Furthermore, the degree of abnormal signals and conduction delay can distinguish patients with sustained VT from those with prior myocardial infarction and no tachycardia. In general, patients with prior myocardial infarction and sustained monomorphic VT have more profound electrogram abnormalities and endocardial conduction delay compared with those with coronary disease and no VT or nonsustained VT (Figure 84-3). Figure 84-1 Electrogram Abnormalities During Sinus Rhythm and Ventricular Tachycardia (VT) Figure 84-2 Examples of Various Types of Electrograms Figure 84-3 Sinus Rhythm Electrograms from Patients With and Without Coronary Artery Disease (CAD) Who Have Inducible or Noninducible VT The relationship between abnormal electrograms and VT was studied in tissues removed from sites of VT origin and sites distant from VT. These studies showed that abnormal electrograms are associated with viable bundles of muscle fibers embedded in and separated by connective tissue.5–7 Studies using confocal microscopy and immunofluorescent staining of gap junctions showed alterations in the number, the distribution, and possibly the function of connexin43—a major cardiac gap junction in the ventricle.8–10 The amplitude of the electrograms seems to be closely related to the number of viable muscle fibers under the recording electrode. Detailed mapping studies with microelectrodes in human tissue and in canine infarct models of VT demonstrated that slow propagation of an impulse through areas from which abnormal fractionated electrograms are recorded is associated with relatively normal sodium-dependent action potentials, implicating poor intercellular coupling in slow propagation of the cardiac impulse.5,11 The relationship between abnormal electrograms and the VT substrate was also validated in the surgical experience to treat ventricular arrhythmias. Miller et al. analyzed the mechanism by which subendocardial resection successfully treats postinfarct-related VT. The origin of VT was mapped and showed extensive areas of abnormal electrograms (especially late and split potentials) that were completely eradicated following subendocardial resection (Figure 84-4). These data suggest that subendocardial resection removes the critical areas of slow conduction that are required from reentry. Whether or not it removes the whole reentrant circuit is unknown, but certainly absence of late potentials and normalization of electrograms suggest improved conduction. These findings are supported by more recent data demonstrating reduced recurrence of arrhythmiafollowing catheter-based ablation of abnormal electrograms.12,13 In addition, data have shown that scars of myocardial infarction patients with no clinical arrhythmias not only are smaller than those of matched patients with spontaneous VT but also have much lower prevalence of isolated and late potentials within the scar.14 Figure 84-4 Effects of endocardial resection on electrograms. In each panel, ECG leads 1, 2, 3, and V5R; right and left ventricular (RV and LV) electrograms; and recordings from a 20-bipolar array are shown; a dotted vertical line denotes the end of the QRS during sinus rhythm (A and B); 1-mV calibration signals for each recording are shown at the far right. Split and late electrograms (dark arrows) are shown in sinus rhythm before resection (A). The same electrodes recorded no split electrograms after resection (B), as well as a general increase in amplitude of the remaining electrogram component. Note the similarities in morphology of the first electrogram component before and after resection. (Modified from Miller JM, Tyson GS, Hargrove WC 3rd, et al: Effect of subendocardial resection on sinus rhythm endocardial electrogram abnormalities. Circulation 91:2385-2391, 1995.) In attempts to replicate the surgical experience with catheter mapping, the development of three-dimensional mapping systems has allowed characterization of the anatomical substrate with detailed spatial relationships between substrate and voltage. Initial work by Cassidy and coworkers validated this concept using bipolar electrogram characteristics (voltage and duration) to identify the underlying substrate at individual endocardial sites.15 With the use of a 4-mm-tip electrode attached to a second pole 2 mm proximally (filtered at 10 and 400 Hz), normal bipolar voltage is approximately 1.6 mV in the left ventricle and 1.3 mV in the right ventricle. These data were further validated in human and porcine models of infarction and in isolated human autopsy studies.16–18 Statistical analysis showed that 95% of endocardial recordings from individuals with normal, nonhypertrophied left ventricle had a bipolar voltage greater than 1.55 mV. A bipolar electrogram amplitude of 0.5 mV or less represented dense scar, and areas with bipolar amplitude between 0.5 and 1.0 mV represented the border zone (Figure 84-5). In addition, an increasing body of literature is validating these voltage definitions in humans. Bello and coworkers were able to image scar with both computed tomography and positron emission tomography.19 Fahmy and associates extended this approach to allow image integration with bipolar voltage maps.20 However, the highest-resolution imaging of scar geometry is currently obtained by examination of the zone of delayed gadolinium enhancement (DGE) on magnetic resonance imaging. Codreanu and colleagues showed excellent correlation of DGE with a zone of bipolar voltage less than 1.54 mV.21 The ability to “visualize” electroanatomical information during both sinus rhythm and ventricular tachycardia reinforced several observations regarding the nature of the VT circuit. The “protected isthmus” of the reentrant VT circuits is contained within the dense scar (bipolar electrogram amplitude <0.5 mV), and the exit site of the arrhythmia to normal endocardium is consistently located at the border zone (bipolar electrogram amplitude between 0.5 and 1.5 mV). Voltage mapping may also facilitate identification of “channels” within the infarct. Channels are corridors of preferential conduction through dense scar that can serve as an isthmus during VT. They are indicated by relatively preserved voltage within the dense scar, the presence of late potentials, or a long stimulus to QRS time with pacing during sinus rhythm. They may be visualized on the electroanatomical map by adjustment of the voltage representation on the color isopotential map (Figure 84-6).22,23 In addition, data suggest that the endocardial unipolar voltage map, with its larger field of view, may reveal epicardial abnormalities; however, this requires further investigation.24 Figure 84-5 Sinus Rhythm Map in a Patient With VT in the Setting of Extensive Healed Inferior Wall Infarction Figure 84-6 Sinus Rhythm Bipolar Voltage Map in a Patient With Extensive Anteroseptal Infarction and Two Inducible Ventricular Tachycardias (VTs)
Ischemic Heart Disease
Anatomy and Pathophysiology
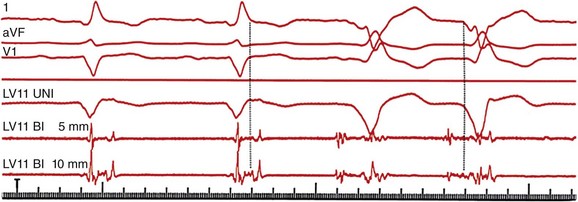
Three surface electrocardiogram (ECG) leads are shown with three intracardiac recordings from a catheter placed from the left ventricular (LV) anterior wall. During sinus rhythm, a fractionated, multicomponent signal is recorded; the final component of this electrogram is recorded after the end of the surface QRS complex. During VT (final two beats of the tracing), the electrogram at this site precedes the QRS complex by 90 milliseconds. (Adapted with permission from Josephson ME: Clinical Cardiac Electrophysiology: Techniques and Interpretations, 4th ed. Philadelphia, Lippincott Williams & Wilkins, 2008.)
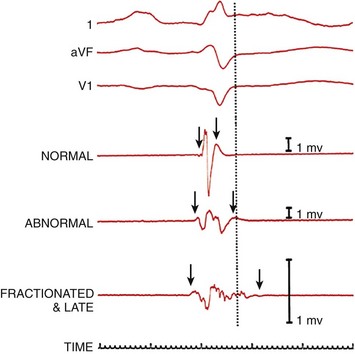
Three surface recordings accompanied by three local bipolar electrograms (normal, abnormal, and fractionated and late) recorded from different left ventricular endocardial sites are shown. The dotted vertical line denotes the end of the surface QRS activity. The arrows show the onset and offset (characterized by the amplification signal decay artifact) of local electrical activity. One-millivolt calibrations are shown. (Adapted with permission from Josephson ME: Clinical Cardiac Electrophysiology: Techniques and Interpretations, 4th ed. Philadelphia, Lippincott Williams & Wilkins, 2008.)
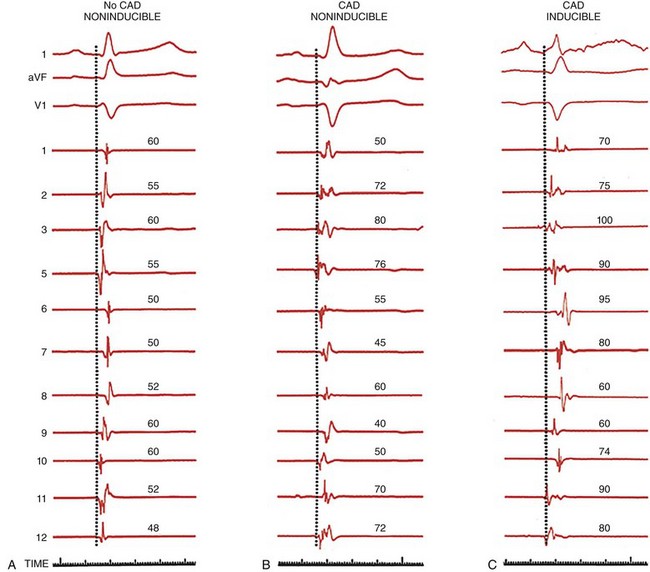
All three tracings are arranged in the same manner, with three ECG leads (l, aVF, and V1) and 11 of 12 left ventricular mapping sites along with timelines. The patient with no CAD and no inducible arrhythmias has relatively rapid endocardial activation, and the electrograms are normal in amplitude and duration (left). Patients with CAD and prior infarction and no inducible arrhythmia have a normal activation pattern; however, the electrograms are broader, some with multiple components but without late potentials (middle). In patients with prior infarction and inducible VT, many of the electrograms are abnormal, and the sequence of activation is markedly distorted by areas of prior infarction. Many electrograms have multiple components, and several are recorded near the end of the QRS. (Adapted with permission from Josephson ME: Clinical Cardiac Electrophysiology: Techniques and Interpretations, 4th ed. Philadelphia, Lippincott Williams & Wilkins, 2008)
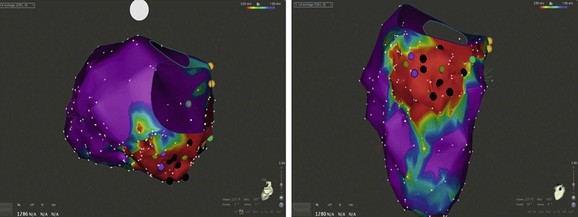
The map is color-coded to represent bipolar electrogram voltage: red represents dense scar (≤0.5 mV), purple represents normal voltage (≥1.5 mV), and the intervening colors represent voltage values in between. This patient had a large area of inferior wall scar extending from the mitral annulus to the mid wall. Three inducible VTs of varied morphology were localized to circuits within the scar.
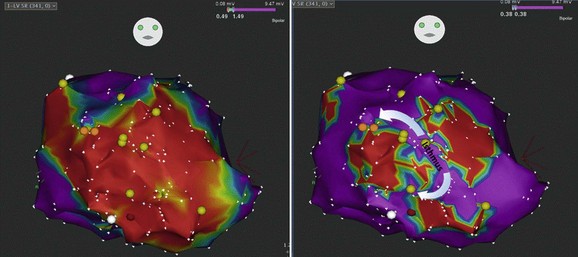
The VTs had similar cycle length; however, one had a superior axis and the second had an inferior axis. The left panel shows extensive and homogeneous dense scar in red on the color isopotential map. Adjustment of the color isopotential map revealed corridors of relatively preserved voltage within the dense scar (right panel). Entrainment mapping showed a common isthmus to the two VTs with superior and inferior exit sites. (Courtesy of Mathew D. Hutchinson, Hospital of the University of Pennsylvania.)![]()
Stay updated, free articles. Join our Telegram channel

Full access? Get Clinical Tree


Thoracic Key
Fastest Thoracic Insight Engine
