The aim of the present study was to assess the intravascular ultrasound predictors for angiographic edge restenosis after newer generation drug-eluting stent implantation. A total of 820 patients (987 lesions) who underwent newer generation drug-eluting stent placement (236 Endeavor zotarolimus-eluting stents, 246 Resolute zotarolimus-eluting stents, and 505 everolimus-eluting stents) with 9 months of angiographic surveillance were enrolled. The post-stenting angiographic and intravascular ultrasound images of 1,668 reference segments (681 proximal and 987 distal) were analyzed. Overall, 37% of angiographically normal proximal reference segments and 21% of angiographically normal distal reference segments had plaque burden >50%. In the overall cohort of 1,668 reference segments, 47 (2.8%) had 9-month angiographic edge restenosis (diameter stenosis >50%). Edge restenosis was predicted by a post-stenting reference segment plaque burden >54.5% (sensitivity 81%, specificity 80%) and a reference segment minimum lumen area of 5.7 mm 2 (sensitivity 72%, specificity 59%). The edge restenosis rate was 2.1% in the Endeavor zotarolimus-eluting stents, 2.4% in the Resolute zotarolimus-eluting stents, and 3.4% in the everolimus-eluting stents lesions (p = 0.311). The predictive cutoff of the reference plaque burden was 56.3% for Endeavor zotarolimus-eluting stents, 57.3% for Resolute zotarolimus-eluting stents, and 54.2% for everolimus-eluting stents. The criteria for residual plaque burden were similar between proximal and distal reference segments (56.4% vs 51.9%, respectively), but the minimum lumen area criteria were quite different (<7.1 mm 2 for proximal vs <4.8 mm 2 for distal reference segments). In conclusion, after newer drug-eluting stent implantation, edge restenosis was predicted by post-stenting reference segment plaque burden >55%.
Stent underexpansion and incomplete lesion coverage are consistent and important procedural factors responsible for stent failure. Intravascular ultrasound (IVUS) studies have reported that the reference segment plaque burden predicted both edge restenosis and stent thrombosis in lesions treated with bare metal stents and first-generation drug-eluting stents (DESs). The newer generation DESs differ from the first-generation devices regarding antiproliferative agents, polymer coatings, and metallic platforms. Although the newer DESs are generally used in daily practice, because they provide better safety and efficacy, no IVUS optimization criteria are available to determine the appropriate landing zones suitable for stent deployment to prevent edge restenosis and improve the long-term clinical outcomes. Thus, the aim of the present study was to assess the IVUS cutoffs for the reference segment plaque burden and lumen area to predict angiographic edge restenosis in patients undergoing newer generation DES implantation.
Methods
From January 2008 to August 2010, 820 patients (with 987 lesions) underwent newer generation DES implantation in ≥1 of 3 major coronary arteries with 9 months of follow-up angiographic surveillance at the Asan Medical Center, Seoul, Korea. The exclusion criteria were chronic total occlusion, in-stent restenosis, left main or saphenous vein graft lesions, and vessels with a reference lumen diameter <2.5 mm. The newer generation DESs used were the Endeavor zotarolimus-eluting stent (Medtronic, Santa Rosa, California) in 236 lesions, the Resolute zotarolimus-eluting stent (Medtronic) in 246 lesions, and everolimus-eluting stent (EES, Xience V, Abbott Vascular, Santa Clara, California, and Promus, Boston Scientific, Natick, Massachusetts) in 505 lesions. In 306 lesions, no proximal reference segment was present, because the lesions were ostial in location or were just distal to a major branch; therefore, a total of 1,668 reference segments (681 proximal and 987 distal reference segments) were included in the IVUS analysis.
Revascularization was defined as “ischemia driven” if angiographic diameter stenosis (DS) of ≥50% was present, with a documented positive functional study, ischemic changes on an electrocardiogram, or ischemic symptoms. In addition, lesions with angiographic DS of ≥70%, as assessed by quantitative coronary analysis, were considered to be “ischemia-driven,” even in the absence of documented ischemia. Myocardial infarction was diagnosed by the presence of ischemic symptoms or signs plus cardiac enzyme elevation (creatine kinase-MB elevation >3 times or creatine kinase elevation >2 times the upper limit of normal or troponin I >1.5 ng/ml). The diagnosis of stent thrombosis was determined using the Academic Research Consortium criteria. All patients provided written informed consent, and the ethics committee approved our study.
Qualitative and quantitative angiographic analysis was done using standard techniques with automated edge-detection algorithms (CAAS-5, Pie Medical Imaging, Maastricht, The Netherlands) in the angiographic analysis center of the CardioVascular Research Foundation (Seoul, Korea). On the final post-stenting angiogram, the minimal lumen diameter and DS were measured within the stent (in-stent) and within 5 mm of the proximal and distal edges of the stent. For bifurcation lesions, angiographic measurement was performed only in the main vessel. Angiographic restenosis was defined as DS >50% at the follow-up examination. The patterns of angiographic restenosis were assessed using the Mehran classification.
Final post-stenting IVUS imaging was performed after intracoronary administration of 0.2 mg nitroglycerin using motorized transducer pullback (0.5 mm/s) and a commercial scanner (Boston Scientific Scimed, Minneapolis, Minnesota) consisting of a rotating 40-MHz transducer within a 3.2F imaging sheath. Using computerized planimetry (EchoPlaque, version 3.0, Indec Systems, Mountain View, California), off-line IVUS analysis was performed. In-stent segment analysis included the minimum stent area and external elastic membrane area as measured using 2-dimensional planimetry. At both the proximal and the distal reference segments (5-mm-long segment adjacent to the stent edge), the minimum lumen area (MLA) and external elastic membrane area were measured. The maximum plaque burden within the reference segment was calculated as plaque/external elastic membrane × 100 (%).
All statistical analyses were performed using SPSS, version 10.0 (SPSS, Chicago, Illinois). All values are expressed as the mean ± SD (continuous variables) or as counts and percentages (categorical variables). Continuous variables were compared using the unpaired t test or nonparametric Mann-Whitney U test. Categorical variables were compared using chi-square statistics or Fisher’s exact test. In post hoc analysis, all IVUS parameters were compared among the 3 DES types. Bonferroni corrections were made for multiple comparisons of continuous variables. All p values were 2-sided, and p values after Bonferroni correction of <0.05 were considered statistically significant.
To predict edge restenosis within the corresponding reference segment, a receiver operating characteristic curve was used to identify the optimal cutoff value of the reference segment plaque burden that minimized the distance between the curve and upper corner, using MedCalc (MedCalc Software, Mariakerke, Belgium). The sensitivity and specificity were obtained. A p value <0.05 was considered statistically significant.
Results
The clinical characteristics of the 820 patients are summarized in Table 1 . The quantitative coronary angiographic data from the 987 lesions with 1,668 reference segments (681 proximal and 987 distal) are summarized in Table 2 . With a follow-up duration of 8.7 ± 2.6 months, angiographic edge restenosis and in-stent restenosis was observed in 45 (4.6%) and 60 (6.0%) lesions, respectively.
| Variable | Total (n = 820) | Edge Restenosis | p Value | |
|---|---|---|---|---|
| With (n = 42) | Without (n = 778) | |||
| Age (yrs) | 60 ± 9 | 58 ± 9 | 60 ± 9 | 0.163 |
| Men | 199 (24%) | 8 (19%) | 191 (25%) | 0.272 |
| Smoker | 447 (55%) | 20 (48%) | 427 (55%) | 0.223 |
| Hypertension ∗ | 474 (58%) | 26 (62%) | 448 (58%) | 0.350 |
| Hyperlipidemia † | 546 (67%) | 28 (67%) | 518 (67%) | 0.569 |
| Diabetes mellitus | 286 (35%) | 17 (41%) | 269 (35%) | 0.266 |
| Ejection fraction (%) | 59 ± 6 | 59 ± 9 | 59 ± 6 | 0.931 |
| Previous bypass surgery | 13 (2%) | 0 (0%) | 13 (2%) | 0.502 |
| Previous myocardial infarction | 29 (4%) | 1 (2%) | 28 (4%) | 0.556 |
| Previous stroke | 46 (6%) | 9 (10%) | 42 (5%) | 0.204 |
| Renal failure | 7 (1%) | 0 (0%) | 7 (1%) | 0.691 |
| Multivessel disease | 479 (58%) | 30 (71%) | 449 (58%) | 0.053 |
| Clinical presentation | 0.963 | |||
| Stable angina pectoris Unstable angina pectoris Acute myocardial infarction | 550 (67%) 183 (22%) 87 (11%) | 30 (71%) 7 (17%) 5 (12%) | 520 (67%) 176 (22%) 82 (11%) | |
∗ Systolic blood pressure >140 mm Hg or diastolic blood pressure >90 mm Hg or receiving antihypertensive treatment.
† Total cholesterol >200 mg/dl or receiving antilipidemic treatment.
| Variable | Total | E-ZES | R-ZES | EES |
|---|---|---|---|---|
| Lesion number | 987 | 236 | 246 | 505 |
| Proximal reference segments | 681 | 197 | 176 | 308 |
| Distal reference segments | 987 | 236 | 246 | 505 |
| Left anterior descending artery | 622 (63%) | 139 (59%) | 154 (63%) | 329 (65%) |
| Left circumflex artery | 119 (12%) | 29 (12%) | 35 (14%) | 55 (11%) |
| Right coronary artery | 246 (25%) | 68 (29%) | 57 (23%) | 121 (24%) |
| Preprocedure angiographic data | ||||
| Proximal reference lumen diameter (mm) | 3.7 ± 0.5 | 3.6 ± 0.4 | 3.7 ± 0.4 | 3.6 ± 0.5 |
| Distal reference lumen diameter (mm) | 2.7 ± 0.5 | 2.7 ± 0.5 | 2.7 ± 0.5 | 2.7 ± 0.5 |
| Minimum lumen diameter (mm) | 1.1 ± 0.6 | 1.0 ± 0.5 | 1.0 ± 0.5 | 1.1 ± 0.7 |
| Diameter stenosis (%) | 67.7 ± 14.5 | 67.9 ± 15.4 | 69.8 ± 14.3 | 66.5 ± 13.9 |
| Lesion length (mm) | 28.6 ± 16.0 | 27.5 ± 15.4 | 27.9 ± 15.2 | 29.5 ± 16.7 |
| Post-stenting angiographic data | ||||
| Proximal reference lumen diameter (mm) | 3.2 ± 0.5 | 3.2 ± 0.5 | 3.3 ± 0.6 | 3.2 ± 0.5 |
| Proximal reference diameter stenosis (%) | 10.0 ± 9.1 | 8.5 ± 8.1 | 9.5 ± 9.5 | 11.2 ± 9.3 |
| Distal reference lumen diameter (mm) | 2.5 ± 0.6 | 2.6 ± 0.6 | 2.5 ± 0.5 | 2.4 ± 0.5 |
| Distal reference diameter stenosis (%) | 14.7 ± 10.2 | 13.8 ± 9.3 | 14.5 ± 10.4 | 15.2 ± 10.4 |
| Total stent length (mm) | 36.1 ± 16.2 | 34.5 ± 14.3 | 36.4 ± 15.8 | 36.7 ± 17.1 |
| In-stent minimum lumen diameter (mm) | 2.8 ± 0.5 | 2.9 ± 0.5 | 2.9 ± 0.5 | 2.8 ± 0.5 |
| In-stent diameter stenosis (%) | 6.9 ± 7.8 | 7.9 ± 6.3 | 6.4 ± 7.9 | 6.7 ± 8.4 |
| Thrombolysis In Myocardial Infarction flow 3 | 987 (100%) | 236 (100%) | 246 (100%) | 505 (100%) |
| Follow-up angiographic data | ||||
| Proximal reference lumen diameter (mm) | 3.0 ± 0.6 | 3.0 ± 0.6 | 3.1 ± 0.6 | 3.0 ± 0.6 |
| Proximal reference diameter stenosis (%) | 15.8 ± 13.2 | 15.1 ± 13.3 | 14.9 ± 13.8 | 16.8 ± 12.9 |
| Distal reference lumen diameter (mm) | 2.4 ± 0.6 | 2.3 ± 0.6 | 2.6 ± 0.5 | 2.6 ± 0.6 |
| Distal reference diameter stenosis (%) | 17.2 ± 12.1 | 28.1 ± 16.7 | 14.9 ± 11.7 | 15.7 ± 15.1 |
| In-stent minimal lumen diameter (mm) | 2.5 ± 0.6 | 2.5 ± 0.6 | 2.4 ± 0.5 | 2.4 ± 0.6 |
| In-stent diameter stenosis (%) | 18.5 ± 15.7 | 16.7 ± 11.3 | 17.2 ± 10.8 | 17.5 ± 12.9 |
| 9-Mo angiographic edge restenosis | ||||
| Proximal edge restenosis | 24 (2.4%) | 5 (2.1%) | 7 (2.8%) | 12 (2.4%) |
| Distal edge restenosis | 19 (1.9%) | 4 (1.7%) | 3 (1.2%) | 12 (2.4%) |
| Both | 2 (0.2%) | 0 (0%) | 0 (0%) | 2 (0.4%) |
| 9-Mo angiographic in-stent restenosis | 60 (6.1%) | 26 (11.0%) | 11 (4.5%) | 23 (4.5%) |
| Marginal | 26 (43.3%) | 4 (15.4%) | 9 (81.8%) | 13 (56.5%) |
| Focal body | 17 (28.3%) | 9 (34.6%) | 2 (18.2%) | 6 (26.1%) |
| Diffuse in-stent | 8 (13.3%) | 8 (30.8%) | 0 (0%) | 0 (0%) |
| Proliferative | 7 (11.7%) | 5 (19.2%) | 0 (0%) | 2 (8.7%) |
| Total occlusion | 2 (3.3%) | 0 (0%) | 0 (0%) | 2 (8.7%) |
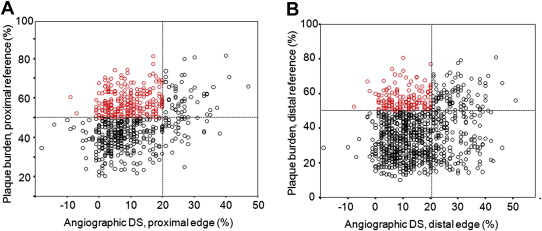
The post-stenting IVUS data are listed in Table 3 . Post-stenting angiographic DS showed only a weak correlation with maximum plaque burden at the proximal (r = 0.293, p <0.001) or distal (r = 0.155, p <0.001) reference segments ( Figure 1 ). Of 785 normal-looking proximal reference segments (post-stenting DS <20%), 290 (37%) had a maximum plaque burden >50%. In 724 normal-looking distal reference segments (post-stenting DS <20%), 153 (21%) also had a maximum plaque burden >50%.
| Variable | Total | E-ZES | R-ZES | EES |
|---|---|---|---|---|
| Proximal reference segments | 681 | 197 | 176 | 308 |
| Minimum lumen area (mm 2 ) | 9.0 ± 3.4 | 8.9 ± 3.6 | 9.2 ± 3.2 | 8.9 ± 3.5 |
| External elastic membrane area at minimum lumen area site (mm 2 ) | 17.4 ± 5.6 | 17.2 ± 5.5 | 17.5 ± 5.0 | 17.5 ± 5.9 |
| Maximum plaque burden (%) | 48.1 ± 11.5 | 47.9 ± 11.2 | 47.4 ± 11.5 | 48.7 ± 11.7 |
| Proximal edge dissection | 5 (0.7%) | 1 (0.5%) | 1 (0.6%) | 2 (1.0%) |
| Distal reference segments | 987 | 236 | 246 | 505 |
| Minimum lumen area (mm 2 ) | 5.7 ± 2.8 | 5.8 ± 2.6 | 5.6 ± 2.3 | 5.7 ± 3.0 |
| External elastic membrane area at minimum lumen area site (mm 2 ) | 9.8 ± 5.2 | 10.0 ± 5.3 | 9.4 ± 4.3 | 9.9 ± 5.5 |
| Maximum plaque burden (%) | 38.6 ± 14.6 | 38.7 ± 14.2 | 38.1 ± 14.5 | 38.6 ± 14.8 |
| Distal edge dissection | 14 (1.4%) | 5 (2.1%) | 0 (0%) | 9 (1.8%) |
| In-stent segments | 987 | 236 | 246 | 505 |
| Minimum stent area (mm 2 ) | 6.3 ± 2.2 | 6.3 ± 2.3 | 6.1 ± 1.9 | 6.3 ± 2.2 |
| External elastic membrane area at minimum stent area site (mm 2 ) | 12.3 ± 5.0 | 12.7 ± 5.2 | 12.0 ± 4.5 | 12.2 ± 5.1 |
The angiographic and IVUS findings between the reference segments with angiographic edge restenosis and those without edge restenosis are listed in Table 4 . In both proximal and distal reference segments, edge restenosis was associated with a smaller post-stenting IVUS reference segment MLA, a larger post-stenting IVUS reference segment plaque burden, and a greater reference segment angiographic DS. In addition, only a trend was seen for longer stent length (40.4 ± 19.0 mm vs 35.9 ± 16.0 mm, p = 0.070) in lesions with in-stent restenosis. However, edge restenosis was not related to the reference segment external elastic membrane area, edge dissection, or plaque rupture.
| Proximal Edges (n = 681) | Distal Edges (n = 987) | |||||
|---|---|---|---|---|---|---|
| With Edge Restenosis | Without Edge Restenosis | p Value | With Edge Restenosis | Without Edge Restenosis | p Value | |
| Lesions (n) | 26 | 655 | 21 | 966 | ||
| Post-stenting angiographic data | ||||||
| Minimum lumen diameter (mm) | 2.9 ± 0.5 | 3.3 ± 0.5 | <0.001 | 2.0 ± 0.5 | 2.5 ± 0.5 | <0.001 |
| Diameter stenosis (%) | 18.5 ± 11.0 | 9.7 ± 8.9 | <0.001 | 27.5 ± 12.7 | 14.4 ± 9.9 | <0.001 |
| 9-mo follow-up angiographic data | ||||||
| Minimal lumen diameter (mm) | 1.5 ± 0.4 | 3.1 ± 0.5 | <0.001 | 1.1 ± 0.6 | 2.4 ± 0.5 | <0.001 |
| Diameter stenosis (%) | 57.2 ± 9.8 | 14.2 ± 10.4 | <0.001 | 61.7 ± 18.9 | 16.3 ± 9.9 | <0.001 |
| Post-stenting intravascular ultrasound data | ||||||
| Minimum lumen area (mm 2 ) | 6.3 ± 2.4 | 9.0 ± 3.4 | <0.001 | 3.8 ± 2.2 | 5.7 ± 2.8 | 0.001 |
| External elastic membrane area at minimum lumen area site (mm 2 ) | 16.6 ± 4.5 | 17.4 ± 5.6 | 0.456 | 9.2 ± 4.6 | 9.8 ± 5.2 | 0.595 |
| Maximum plaque burden (%) | 61.7 ± 12.9 | 47.6 ± 11.1 | <0.001 | 58.7 ± 12.7 | 38.1 ± 14.3 | <0.001 |
| Edge dissection | 0 (0%) | 5 (0.8%) | 0.753 | 0 (0%) | 14 (1.4%) | 0.792 |
| Plaque rupture | 0 (0%) | 7 (1.1%) | 0.573 | 1 (4.8%) | 14 (1.4%) | 0.063 |
Stay updated, free articles. Join our Telegram channel

Full access? Get Clinical Tree


