The intraindividual variability and association of human collateral functional supply to different arterial regions is unknown. The primary study end point was collateral flow index (CFI) as obtained in the coronary artery (CA), renal artery (RA), left superficial femoral artery (SFA), and left subclavian artery (SCA) of the same individual. CFI is the ratio between simultaneously recorded mean arterial occlusive pressure divided by mean aortic pressure both subtracted by mean central venous pressure. In 100 patients admitted for diagnostic coronary angiography, CFI was assessed in 3 arterial regions (CA, RA, and SFA), 13 patients underwent CFI measurements in all 4 territories. By quantitative coronary angiography, 82 patients had a stenosis <50% in diameter in the CA who underwent CFI measurement. CFI in the CA, RA, left SFA, and left SCA region amounted to 0.110 ± 0.093, 0.119 ± 0.082, 0.512 ± 0.147, and 0.563 ± 0.155, respectively (p <0.0001). There was a direct and linear correlation between CA and SFA CFI: CFI_SFA = 0.47 + 0.47CFI_CA (r 2 = 0.05; p = 0.0259). In patients with CFI values in all 4 arterial regions, an inverse linear relation between left SFA and left SCA CFI was observed: CFI_SCA = 0.91−0.67CFI_SFA (r 2 = 0.36; p = 0.0305). In conclusion, intraindividual, preexistent collateral function is widely varying between different arterial supply areas. On average, collateral flow ranges from approximately 12% in comparison to flow during arterial patency in the coronary and renal circulation to over 50% in the left SFA and left SCA, that is, circle of Willi’s territory. CA and SFA CFIs are directly related to each other.
Of all vascular regions, the collateral circulation of the heart is the most extensively studied since the early studies by Fulton. Although interest in the cerebral collateral circulation is gaining momentum fast, its routine assessment is currently still occurring only by angiographic scoring. This is surprising given the potential insight into the circle of Willis’ function and the pial collateral circulation during interventional cervical or cerebral occlusive pressure measurements. Collateral pathways of the lower extremities have been described previously, typically in the presence of severe atherosclerotic involvement. The renal collateral circulation has hitherto been subjected to systematic research only in experimental studies, whereas data in humans are sparse and limited to angiographic assessment. The innate human collateral function in different vascular regions is of interest, because an ischemic event in one of them constitutes a risk for a subsequent event in a remote area. On a patient level, this relates to the intraindividual , as opposed to the interindividual distribution of the collateral network. Although the interindividual distribution of innate human collateral function is varying widely, the variability and association of the collateral function between different vascular regions in humans has not been investigated so far.
Methods
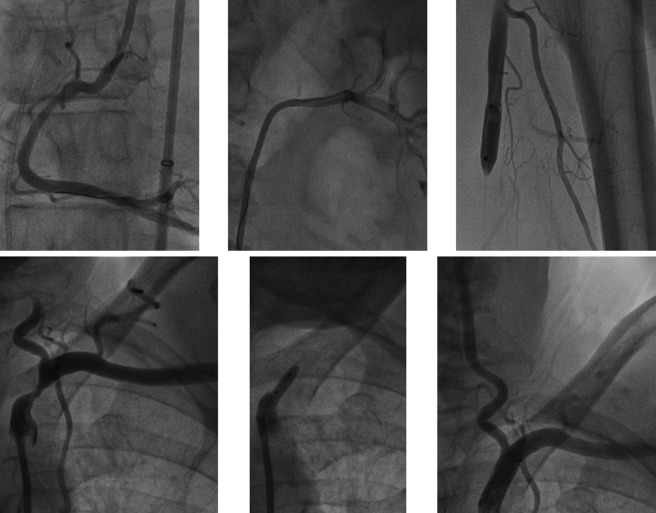
This was a prospective observational study in 100 patients who underwent coronary angiography for diagnostic purposes in the context of chest pain. The primary study end point was pressure-derived collateral flow index (CFI; see the following for calculation) as obtained from the same patient in 3 to 4 different systemic arterial regions ( Figure 1 ): coronary artery (CA), renal artery (RA), left superficial femoral artery (SFA), and in 13 patients, left subclavian artery (SCA). The secondary study end point was oxygen saturation as obtained in the ipsilateral renal vein at the end of a 6-minute RA balloon occlusion (see the following). Criteria for study inclusion were age >18 years, written informed consent to participate in the study, and 0- to 3-vessel chronic stable coronary artery disease. Exclusion criteria were acute coronary syndrome, previous myocardial infarction in the vascular region undergoing CFI measurement, more than double renal arterial supply, severe hepatic, or renal failure (creatinine clearance <15 ml/min/1.73 m 2 ). The study was approved by the ethics committee of the Kanton of Bern, Switzerland, and all patients gave written informed consent to participate.
Patients underwent left heart catheterization and coronary angiography for diagnostic purposes from the right femoral artery approach through a 65-cm long 8F introducer sheath. Biplane left ventriculography was performed followed by coronary angiography. CA stenoses were assessed quantitatively as percent diameter reduction using the guiding catheter for calibration. Aortic pressure (P ao ) was obtained through a 6F or 8F arterial guiding catheter. Central venous pressure (CVP) was measured through the right femoral vein.
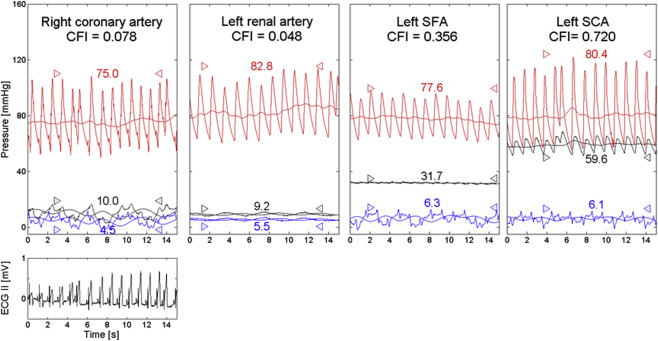
Arterial occlusive collateral flow relative to normal anterograde flow through the nonoccluded artery (CFI) in the different vascular regions was determined using arterial pressure measurements. A 0.014 inch pressure sensor angioplasty guidewire (Pressure Wire, St. Jude Medical, Eschborn, Germany) was calibrated, advanced through and just outside the guiding catheter, where equalization with the guide catheter pressure was performed and positioned in the distal part of the artery of interest. CFI was determined by simultaneous measurement of mean aortic pressure (P ao , mm Hg), the distal arterial pressure during balloon occlusion (P occl , mm Hg), and the CVP (mm Hg; Figure 2 ) as obtained during the last 30 seconds of the arterial balloon occlusions. Balloon occlusions lasted exactly 1 minute in the CA and left SCA, 6 minutes in the RA and 3 minutes in the left SFA. CFI was calculated as (P occl −CVP) divided by (P ao −CVP). The accuracy of pressure-derived coronary CFI measurements in comparison to elecrocardiographic signs of myocardial ischemia during occlusion and to absolute myocardial perfusion measurements has been documented previously.
Blood oxygen saturation in percent was obtained in the ipsilateral renal vein at the end of the 6-minute RA balloon occlusion.
Before the diagnostic examination, 2 puffs of oral isosorbidedinitrate were given. The CA undergoing CFI measurements was chosen on the basis of ease of access in case of a nonstenotic vessel or the presence of a stenotic lesion requiring percutaneous coronary intervention. A 6F coronary guiding catheter was used in all cases of left coronary CFI, whereas in the context of the subsequent peripheral CFI measurements, an 8F Judkins right coronary guiding catheter was used for right coronary CFI. Fractional flow reserve (FFR) was obtained before CFI. FFR was determined with the pressure guidewire positioned distally in the nonoccluded CA of interest using an intracoronary bolus of approximately 70 μg adenosine for hyperemia induction: FFR = distal coronary pressure divided by P ao . For coronary CFI measurement, an adequately sized monorail angioplasty balloon catheter (diameter ranging from 2.5 to 5 mm) was positioned in the proximal part of the vessel, whereas the pressure guidewire remained distally. During vessel occlusion, simultaneous P occl , P ao , and CVP were obtained for the calculation of CFI ( Figure 2 ). Simultaneously, an intracoronary electrocardiogram was recorded as taken from the guidewire. Right atrial pressure was taken as CVP through a modified 5F pigtail catheter ( Figure 1 ). After coronary CFI measurement, left SCA CFI was obtained using an 8F Judkins right CA guiding catheter and an appropriately sized over-the-wire balloon of 10 to 12 mm in diameter; right atrial pressure was taken as CVP. Subsequently, left or right RA CFI was measured through the 8F Judkins right coronary guiding catheter during ostial balloon occlusion (balloon size mostly 6 mm in diameter). In case of renal CFI measurement, simultaneous ipsilateral renal vein pressure taken through a deeply engaged, modified 5F pigtail catheter was used as CVP. At this site, oxygen saturation was determined from a blood sample of 1 ml as taken shortly before the end of the 6-minute ipsilateral RA occlusion. Left SFA CFI measurement was performed by crossover technique through the right femoral artery 8F introducer sheath using an over-the-wire 10 to 12 mm angioplasty balloon. CVP was taken at the right atrium.
Two study groups were established on the basis of the absence or presence of percent diameter CA stenosis < or ≥50% as determined quantitatively in the vessel undergoing CFI measurement. Between-group comparison of continuous demographic, clinical, angiographic, hemodynamic variables, CFI, and intracoronary. Electrocardiographic data were performed by an unpaired Student t test. A chi-square test was used for the comparison of categorical variables in the study groups. Intraindividual comparison in different vascular regions of CFI values was performed by factorial analysis of variance followed by Fisher’s post hoc test. Univariate linear regression analysis was performed for testing an intraindividual association of CFI in different vascular regions. Statistical significance was defined at a p level <0.05. Continuous variables are given as mean and SD.
Results
The complete set of the primary study end point was obtained in 100 patients for the coronary, RA and left SFA region. In 13 patients, the data set comprised CFI in the CA, left SCA, RA, and left SFA region. There were no statistically significant differences between the groups regarding age, rate of male gender, body mass index, occurrence of cardiovascular risk factors, and intake of cardiovascular drugs ( Table 1 ).
| Variable | Coronary Narrowings | P | |
|---|---|---|---|
| No (n=82) | Yes ∗ (n=18) | ||
| Age (years) | 70±12 | 75±13 | 0.15 |
| Men (%) | 62 (76) | 17 (94) | 0.08 |
| Body mass index (kg/m 2 ) | 29±5 | 27±4 | 0.18 |
| Current smoking | 11 (13%) | 5 (28%) | 0.26 |
| Dyslipidemia | 70 (85%) | 16 (89%) | 0.99 |
| Hypertension | 65 (79%) | 13 (72%) | 0.66 |
| Family history for CAD | 21 (26%) | 7 (39%) | 0.33 |
| Diabetes mellitus | 19 (23%) | 3 (17%) | 0.75 |
| Acetylsalicylic acid | 60 (73%) | 11 (61%) | 0.41 |
| Beta-blockers | 35 (43%) | 9 (50%) | 0.79 |
| Calcium antagonists | 15 (18%) | 3 (17%) | 0.99 |
| ACE-inhibitor / ARB | 45 (55%) | 12 (67%) | 0.55 |
| Diuretics | 22 (27%) | 4 (22%) | 0.89 |
| Nitrates | 5 (6%) | 1 (6%) | 0.99 |
| Statin | 52 (63%) | 11 (61%) | 0.97 |
∗ Defined as percent diameter stenosis ≥50% by quantitative coronary angiography.
The number of CAs with stenosis ≥50% in diameter was lower in the group without than with stenosis of the vessel undergoing CFI measurement ( Table 2 ). There was no difference between the groups in the CA or RA selected for CFI measurement ( Table 2 ). Heart rate, left ventricular ejection fraction, left ventricular end-diastolic pressure, mean systemic arterial, and mean CVP were similar between the groups ( Table 2 ).
| Variables | Coronary Narrowings | P | |
|---|---|---|---|
| No (n=82) | Yes ∗ (n=18) | ||
| Number of patients | 82 | 18 | |
| Number of coronary arteries diseased | 1.3±1.1 | 2.1±0.8 | 0.0049 |
| Coronary artery CFI | 0.40 | ||
| Left anterior descending artery | 32 (39%) | 4 (22%) | |
| Left circumflex coronary artery | 22 (27%) | 6 (33%) | |
| Right coronary artery | 28 (34%) | 8 (45%) | |
| Percent diameter stenosis | 25±13 | 67±16 | <0.0001 |
| Fractional flow reserve (mmHg/mmHg) | 0.88±0.12 | 0.71±0.21 | <0.0001 |
| Renal artery CFI | 0.99 | ||
| Left / right | 59 / 23 (72% / 28%) | 13 / 5 (72% / 28%) | |
| Heart rate (beats per minute) | 70±13 | 72±13 | 0.53 |
| Left ventricular ejection fraction (%) | 59±10 | 60±12 | 0.85 |
| Left ventricular end-diastolic pressure (mmHg) | 12±5 | 11±3 | 0.34 |
| Mean arterial pressure, P ao (mmHg) | 84±13 | 85±14 | 0.89 |
| Mean central venous pressure, CVP (mmHg) | 9±3 | 8±3 | 0.18 |
| Coronary artery CFI (mmHg/mmHg) | 0.101±0.069 | 0.137±0.082 | 0.0431 |
| Renal artery CFI (mmHg/mmHg) | 0.116±0.057 | 0.099±0.059 | 0.25 |
| Superficial femoral artery CFI (mmHg/mmHg) | 0.491±0.142 | 0.596±0.134 | 0.0049 |
| Left subclavian artery CFI (mmHg/mmHg) | 0.556±0.147 | 0.601±0.263 | 0.72 |
Stay updated, free articles. Join our Telegram channel

Full access? Get Clinical Tree


