In patients with ST-segment elevation myocardial infarction treated with fibrinolytics, electrocardiogram-derived measures of ST-segment recovery guide therapy decisions and predict infarct size. The comprehension of these relationships in patients undergoing mechanical reperfusion is limited. We studied 144 patients treated with primary percutaneous coronary intervention. We aimed to define the association between infarct size as determined by cardiac magnetic resonance imaging and different metrics of ST-segment recovery. Electrocardiograms were assessed at baseline and 90 minutes after primary percutaneous coronary intervention. Three methods for calculating and categorizing ST-segment recovery were used: (1) summed ST-segment deviation (STD) resolution analyzed in 3 categories (≥70%, ≥30% to <70%, and <30%); (2) single-lead STD resolution analyzed in the same 3 categories; (3) worst-lead residual STD analyzed in 3 categories (<1 mm, 1 to <2 mm, and ≥2 mm). Infarct size and ejection fraction were assessed at 4 months by cardiac magnetic resonance imaging. All 3 ST-segment recovery algorithms predicted the final infarct size and cardiac function. Worst-lead residual STD performed the same as, or better than, the more complex methods and identified large subgroups at either end of the risk spectrum (median infarct size from the lowest to highest risk category (percentage of left ventricle: 7.7% [interquartile range 10.8], 13.1% [interquartile range 13.6]; 24.6% [interquartile range 21.1]); with adjusted odds ratios for infarct size greater than the median (reference <1 mm): 1 to <2 mm, odds ratio 2.3 (95% confidence interval 0.8 to 5.9); ≥2 mm, odds ratio 6.3 (95% confidence interval 1.7 to 23.7; c-index 0.781). In conclusion, an electrocardiogram obtained early after primary percutaneous coronary intervention analyzed by a simple algorithm provided prognostic information on the final infarct size and cardiac function.
In the case of an acute coronary event, the electrocardiographic findings are a crucial tool for guiding therapy decisions and patient logistics to ensure optimal outcomes. In patients with ST-segment elevation myocardial infarction (STEMI) receiving pharmacologic reperfusion, the early resolution of ST-segment deviation (STD) predicts smaller infarct size and confers a lower risk of death and cardiovascular outcomes. Several exploratory post hoc studies have suggested that measures of ST-segment recovery remain predictive of clinical outcomes in patients undergoing mechanical reperfusion. This hypothesis was further substantiated in 2 recent, large-scale prospective trials. Few reports have directly linked ST-segment recovery to infarct size and cardiac function in patients undergoing primary percutaneous coronary intervention (pPCI). Also, it remains uncertain which of the different methods for quantifying ST-segment recovery conveys the strongest prognostic information. In the present study, using core laboratory analysis and protocol-specified pre- and postprocedural electrocardiograms (ECGs), we assessed the prognostic effect of ST-segment recovery on infarct size and left ventricular ejection fraction as determined by cardiac magnetic resonance (CMR) imaging in patients undergoing pPCI as a part of the Efficacy of FX06 in the Prevention of Myocardial Reperfusion Injury (FIRE) trial.
Methods
The FIRE trial ( clinicaltrials.gov identifier NCT00326976 ) randomized 234 patients with a first-time STEMI to placebo or FX06, a novel compound targeting reperfusion injury. Additional inclusion criteria were presentation within 6 hours of symptom onset, >2-mm ST-segment elevation in ≥3 electrocardiographic leads, and a single culprit lesion with Thrombolysis In Myocardial Infarction flow 0-1 in the infarct-related artery. The results from the FIRE study have been previously reported. Patients included in the present post hoc study were the 144 patients who underwent a CMR examination at 4 months after treatment and for whom both pre- and post-pPCI electrcardiograms were available and could be analyzed (no confounding electrocardiographic features). The analyses were protocol specific for all patients. The study was done in accordance with the Declaration of Helsinki. All patients provided written informed consent, and all local ethics committees approved the protocol.
A standard 12-lead ECG was recorded in all patients at randomization (baseline ECG). Additional ECGs were obtained as clinically feasible immediately after the intervention (0 minutes) and at 90 minutes after pPCI. The ECGs were analyzed at a core laboratory that was unaware of all patient data (Rigshospitalet, Copenhagen University Hospital, Copenhagen, Denmark). ST-segment deviation was measured manually at the J-point to the nearest 0.5 mm in all leads. The sum STD was calculated as follows: for anterior infarction, the sum of the ST-segment elevation in V 1 to V 6 , I, and aVL; for nonanterior infarction, the sum of ST-segment elevation in leads II, III, aVF, V 5 , and V 6 and ST-segment depression in leads V 1 to V 4 .
Three methods for calculating and categorizing ST-segment recovery were used: (1) sum STD resolution (percentage of resolution of sum STD from baseline to after pPCI) analyzed in 3 categories (≥70%, ≥30% to <70%, and <30%); (2) single-lead STD resolution (percentage of resolution comparing the lead with the most prominent ST-segment deviation at baseline and after PCI, irrespective of the electrocardiographic lead in which ST-segment deviation was measured at baseline) analyzed in 3 categories (≥70%, ≥30% to <70%, and <30%); and (3) worst-lead residual STD (the absolute magnitude of residual STD in the most affected lead on the post-PCI ECG, without reference to the baseline ECG) analyzed in 3 categories (<1 mm, 1 to <2 mm, and ≥2 mm).
The details concerning the procedure of the CMR examination were given in the main report from the FIRE trial. CMR imaging was performed at 5 to 7 days and 4 months. The CMR studies were analyzed at the central magnetic resonance core laboratory, University Hospital Basel (Basel, Switzerland), by a single experienced CMR reader who was unaware of the study groups. This was followed by a blinded review by a level III CMR expert. Intraobserver variability was assessed for the primary reader in a subset of 40 randomly chosen studies, and the intraclass correlation was 0.85 for the studies acquired on day 5. In brief, the CMR examination involved an electrocardiographic-triggered acquisition of short-axis slices of the left ventricle from the base to the apex using a steady-state free precession pulse sequence. The left ventricular end-systolic and end-diastolic volumes, ejection fraction, and myocardial mass were calculated in standard fashion. Subsequently, electrocardiographically triggered segmented inversion-recovery gradient echocardiographic images were acquired in the same slice orientations as for the functional assessment 20 minutes after infusion of contrast medium (gadolinium, 0.25 mmol/kg body weight). To acquire the late enhancement images, the inversion time was adjusted in each patient to null the signal of the normal myocardium. The late enhancement imaging was obtained in mid- to late diastole to minimize motion by adjusting the trigger delay (∼450 ms). The other imaging parameters were a slice thickness of 8 mm without gap, matrix of 192 to 256 × 192 to 256, and a flip angle of 20°. The entire left ventricle, encompassing all short-axis slices, from the base to apex was assessed for areas of signal enhancement. The infarct size was manually determined as all areas with signal enhancement.
The end points were the CMR-determined infarct size and left ventricular ejection fraction at 4 months. The categorical baseline and procedural variables are summarized as percentages. The continuous baseline variables and outcomes are presented as the mean ± SD or median with the interquartile range. Continuous associations between the measures of ST-segment recovery and outcomes were examined using Spearman’s rank correlation. Mann-Whitney U tests were used to compare the groups statistically. Adjusted associations between the measures of ST-segment recovery and infarct size were probed by the development of logistic regression models for the prediction of infarct size greater than the median. All regression models were adjusted for age, gender, randomization, and infarct location, in addition to the characteristics at randomization and others accumulated through the post-PCI assessment (i.e., diabetes, smoking history, hypertension, hypercholesterolemia, pain-to-balloon interval, and pre- and postprocedural TIMI flow), with p <0.20 in univariate analysis. Each ST-segment recovery measure was tested separately within the model and considered as both continuous variables and categorically using dummy coding. Adjusted odds ratios with 95% confidence intervals were calculated. Model performance was evaluated by the likelihood ratio test and ability to discriminate (area under the curve/c-index). All tests were 2-sided, with a 5% level of significance. The Statistical Package for Social Sciences, version 16.0 (SPSS, Chicago, Illinois), was used for all analyses.
Results
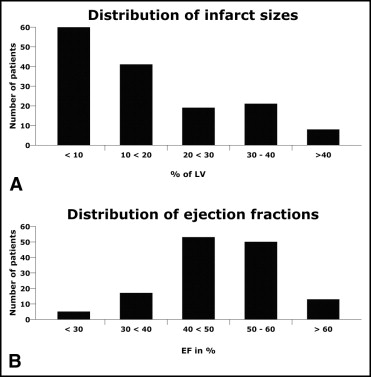
The key baseline characteristics and procedural variables of the patients eligible for the substudy are listed in Table 1 . The distribution of infarct size and left ventricular ejection fraction are summarized in Figure 1 . At 90 minutes after pPCI, the median sum STD resolution was 75% (interquartile range 37%), the median single-lead STD resolution was 68% (interquartile range 37%), and the median worst-lead residual STD was 1 mm (interquartile range 1.5). All 3 methods for calculating ST-segment recovery were significantly associated statistically with infarct size at both 0 and 90 minutes after pPCI ( Table 2 ). The worst-lead residual STD displayed the strongest correlation. The correlation with left ventricular ejection fraction was much weaker, and was only statistically significant for sum STD resolution (90 minutes) and worst-lead residual STD (0 and 90 minutes; Table 2 ).
| Variable | Substudy Population (n = 144) | Total FIRE Population (n = 227) |
|---|---|---|
| Age (years) | 58.1 ± 11.2 | 59.7 ± 11.3 |
| Women | 20% | 23% |
| Body mass index (kg/cm 2 ) | 27.3 ± 3.5 | 27.5 ± 4.0 |
| Regular smoker | 49% | 52% |
| Hypercholesterolemia ⁎ | 14% | 15% |
| Diabetes | 9% | 11% |
| Hypertension ⁎ | 36% | 39% |
| Systolic blood pressure (mm Hg) | 139.9 ± 23.4 | 137.5 ± 24.5 |
| Diastolic blood pressure (mm Hg) | 82.8 ± 14.8 | 81.8 ± 15.5 |
| Interval to primary percutaneous intervention (minutes) | 190 ± 84 | 195 ± 86.6 |
| Anterior wall infarct location | 47% | 47% |
| Thrombolysis In Myocardial Infarction flow | ||
| Before intervention | ||
| 0 | 84% | 85% |
| 1 | 16% | 15% |
| After intervention | ||
| 1 | 1% | 1% |
| 2 | 7% | 6% |
| 3 | 92% | 92% |
| Missing | 0% | 1% |
| Clopidogrel | 100% | 100% |
| β Blockers | 99% | 100% |
| Aspirin | 93% | 93% |
| Glycoprotein IIb/IIIa inhibitors | 53% | 54% |
| Agents acting on renin-angiotensin system | 92% | 93% |
| ST-Segment Recovery Measure | Infarct Size | Left Ventricular Ejection Fraction |
|---|---|---|
| Immediately after primary percutaneous coronary intervention | ||
| Sum ST-segment deviation resolution | −0.26 ⁎ | 0.16 |
| Single-lead sum ST-segment deviation resolution | −0.30 ⁎ | 0.15 |
| Worst-lead residual ST-segment deviation | 0.40 ⁎ | −0.21 † |
| 90 Minutes after primary percutaneous coronary intervention | ||
| Sum ST-segment deviation resolution | −0.35 ⁎ | 0.18 † |
| Single-lead sum ST-segment deviation resolution | −0.34 ⁎ | 0.13 |
| Worst-lead residual ST-segment deviation | 0.48 ⁎ | −0.21 † |
When divided into the 3 categories, as specified, all 3 methods for measuring ST-segment recovery provided differentiation of the infarct size and left ventricular ejection fraction. The worst-lead residual STD produced the widest range of risk separation by identifying the subgroups with the smallest and largest infarct size ( Table 3 ).
| Group | Infarct Size (% LV) | LVEF (%) |
|---|---|---|
| Worst-lead residual ST-segment deviation at 90 minutes | ||
| <1 mm (n = 44) | 7.7 (10.8) ⁎ | 50 (9) |
| ≥1 to <2 mm (n = 59) | 13.1 (13.6) † | 51 (10) † |
| ≥2 mm (n = 41) | 24.6 (21.1) | 44 (11) |
| Sum ST-segment deviation resolution at 90 minutes | ||
| ≥70% (n = 88) | 10.7 (15.7) | 50 (10) |
| ≥30% to <70% (n = 37) | 15.1 (24.0) | 48 (10) |
| <30% (n = 19) | 21.2 (33.2) | 45 (10) |
| Single-lead ST-segment deviation resolution at 90 minutes | ||
| ≥70% (n = 71) | 9.2 (16.7) | 50 (10) |
| ≥30% to <70% (n = 53) | 14.0 (17.0) ⁎ | 48 (10) |
| <30% (n = 20) | 20.0 (17.5) | 47 (11) |
⁎ p <0.05 compared to higher risk category;
After multivariate adjustment for the baseline and procedural variables, all 3 ST-segment recovery metrics were predictive of a final infarct size greater than the median (14% of left ventricle; Table 4 ), whether considered continuously or categorically. Continuous models did slightly better and, overall, the sum STD resolution and worst-lead residual STD were more predictive than single-lead STD resolution. All models, except for categorical consideration of single-lead STD resolution, significantly improved the global fit, as evaluated by the likelihood ratio test. The discriminatory power for all models was reasonable (c-index >0.77).


