Gender differences exist in outcomes after percutaneous coronary intervention and coronary artery bypass graft surgery but have yet to be fully explored after transcatheter aortic valve implantation. We aimed to investigate gender differences after transcatheter aortic valve implantation in the UK National Institute for Cardiovascular Outcomes Research registry. A retrospective analysis was performed of Medtronic CoreValve and Edwards SAPIEN implantation in 1,627 patients (756 women) from January 2007 to December 2010. Men had more risk factors: poor left ventricular systolic function (11.9% vs 5.5%, p <0.001), 3-vessel disease (19.4% vs 9.2%, p <0.001), previous myocardial infarction (29.5% vs 13.0%, p <0.001), peripheral vascular disease (32.4% vs 23.3%, p <0.001), and higher logistic EuroSCORE (21.8 ± 14.2% vs 21.0 ± 13.4%, p = 0.046). Thirty-day mortality was 6.3% (confidence interval 4.3% to 7.9%) in women and 7.4% (5.6% to 9.2%) in men and at 1 year, 21.9% (18.7% to 25.1%) and 22.4% (19.4% to 25.4%), respectively. There was no mortality difference: p = 0.331 by log-rank test; hazard ratio for women 0.91 (0.75 to 1.10). Procedural success (96.6% in women vs 96.4% in men, p = 0.889) and 30-day cerebrovascular event rates (3.8% vs 3.7%, p = 0.962) did not differ. Women had more major vascular complications (7.5% vs 4.2%, p = 0.004) and less moderate or severe postprocedural aortic regurgitation (7.5% vs 12.5%, p = 0.001). In conclusion, despite a higher risk profile in men, there was no gender-related mortality difference; however, women had more major vascular complications and less postprocedural moderate or severe aortic regurgitation.
Gender differences continue to exist in trials on percutaneous coronary intervention, coronary artery bypass graft surgery, and aortic valve surgery with women having a worse clinical outcome compared with men. This has been explained by a higher level of co-morbidities in women at the time of presentation, specifically older age, more diabetes, hypercholesterolemia, heart failure, and peripheral vascular disease. However, women continue to be under-represented in research trials and registries. Transcatheter aortic valve implantation (TAVI) differs from these procedures, in that it is applied in broadly equal numbers for men and women. The United Kingdom (UK) has a national multicenter collaborative database that makes it possible to evaluate gender differences ensuring that the data from every patient in the country are studied. In this study, we report the relation between gender and outcome, for all patients who underwent TAVI in the UK since the procedure’s inception.
Methods
This is a retrospective analysis of 1,627 patients enrolled in a UK multicenter registry from January 2007 to December 2010. TAVI was conducted through “transfemoral” (TF), transapical (TA), subclavian/axillary (SC), and transaortic access routes with implantation of the Medtronic CoreValve (Medtronic, Santa Rosa, California) and Edwards SAPIEN and SAPIEN XT (Edwards Lifesciences, Irvine, California) devices.
All patients who underwent TAVI in the UK were enrolled in a UK TAVI multicenter registry from January 2007 to December 2010. All patients had been selected for TAVI after a multidisciplinary team review by a dedicated Heart team at each institution, including interventional cardiologists, cardiothoracic surgeons, imaging cardiologists, and anesthetists. Data were prospectively collected on 1,627 consecutive patients and entered into a central database run by the Central Cardiac Audit Database that became part of the National Institute for Cardiovascular Outcomes Research in 2011 with the Data Management Group of the UK TAVI group acting as custodians of the data set.
Device selection was based on aortic annulus diameter. The aortic annulus diameter was measured using transthoracic echocardiography, transesophageal echocardiography, cardiac computerized tomography, invasive aortography, and cardiac magnetic resonance imaging in 29.9% (n = 487), 65.9% (n = 1,073), 1.8% (n = 30), 1.8% (n = 30), and 0.4% (n = 7) patients, respectively, based on routine practice at each center at the time of the procedure. During the study period, the following devices were available: Edwards SAPIEN and Edwards XT devices in 23, 26, and 29 mm and CoreValve device in 23, 26, and 29 mm. A TF first policy was applied in all centers, with alternative access routes considered only when disease, tortuosity, calcification, and/or small caliber vessels prohibited a TF approach.
TAVI was performed using conventional techniques as have been previously described. Patients were preloaded with 300 mg aspirin and 300 mg clopidogrel, and the majority of patients went on to receive 3 to 6 months of dual antiplatelet therapy in the form of 75 mg/day aspirin and 75 mg/day clopidogrel. Intravenous heparin was administered to achieve an activated clotting time of between 250 and 300 seconds. All procedures conducted through the transapical and transaortic routes were performed under general anesthesia, whereas devices implanted through the TF or the SC routes were done under general anesthesia or sedation with local anesthesia at the team’s discretion. The degree of postoperative aortic regurgitation (AR) was assessed using transesophageal echocardiography. Routine follow-up was obtained at 1 year.
The primary end points of this study were procedural success, all-cause mortality at 30 days, and the combined safety end point at 30 days. Procedural success was defined as stable device placement and adequate function (significant reduction in transaortic valve gradient ≤20 mm Hg) without severe AR grade ≥3, valve embolization, or need for a second valve. The combined safety end point was a composite of all-cause mortality, major stroke, life-threatening bleeding, stage 3 acute kidney injury, periprocedural myocardial infarction, major vascular complication, and repeat procedure for valve-related dysfunction.
All statistical analysis was performed using SPSS version 16.0 statistical software (SPSS Inc., Chicago, Illinois). Parametric tests or nonparametric tests were used to analyze continuous variables according to plausibility of normality and expressed as mean ± SD or median and interquartile range as appropriate. Categorical variables are expressed as counts and percentages. Survival was assessed by the standard Kaplan-Meier method. Stepwise logistic regression was used to assess potential predictors of dichotomous end points. Statistical significance was defined as p <0.05.
Results
TAVI was performed in 1,627 patients with the CoreValve Revalving System implanted in 814 (50.0%) patients and the Edwards SAPIEN THV and XT System implanted in 813 (50.0%) patients.
The baseline clinical demographics of the patients are presented in Table 1 . Of the 1,627 patients, 871 were men and 756 were women. Men had a higher rate of risk factors than women, with a higher prevalence of diabetes, previous myocardial infarction, previous percutaneous coronary intervention, previous coronary artery bypass graft surgery, peripheral vascular disease, poor left ventricular systolic function, 3-vessel coronary artery disease, left main coronary artery disease, and a higher logistic EuroSCORE.
| Variable | All Patients (n = 1,627) | Men (n = 871) | Women (n = 756) | p Value |
|---|---|---|---|---|
| Age (yrs) | 81.6 ± 7.3 | 80.8 ± 7.6 | 82.6 ± 6.8 | <0.001 |
| Weight (kg) | 72.5 ± 15.9 | 77.8 ± 14.2 | 63.4 ± 15.4 | <0.001 |
| Height (m) | 1.6 ± 0.1 | 1.7 ± 0.1 | 1.6 ± 0.1 | <0.001 |
| Body mass index (kg/m 2 ) | 26.8 ± 5.3 | 26.7 ± 4.7 | 26.8 ± 5.9 | 0.736 |
| Body surface area (m 2 ) | 1.8 ± 0.2 | 1.9 ± 0.2 | 1.7 ± 0.2 | <0.001 |
| Diabetes mellitus | 351 (21.6%) | 207 (23.9%) | 144 (19.2%) | 0.021 |
| Chronic kidney disease | 87 (5.3%) | 59 (3.7%) | 28 (6.8%) | 0.006 |
| Chronic obstructive pulmonary disease | 366 (22.5%) | 214 (20.8%) | 152 (25.1%) | 0.042 |
| Pulmonary hypertension | 190 (11.7%) | 89 (10.2%) | 101 (13.4%) | 0.130 |
| Previous myocardial infarction | 354 (21.8%) | 256 (29.5%) | 98 (13.0%) | <0.001 |
| Previous percutaneous coronary intervention | 238 (14.6%) | 157 (18.0%) | 81 (10.7%) | <0.001 |
| Previous coronary bypass | 452 (27.8%) | 356 (40.9%) | 96 (12.7%) | <0.001 |
| Previous stroke with full recovery | 92 (5.7%) | 52 (6.0%) | 40 (5.3%) | 0.539 |
| Previous stroke with neurologic deficit | 50 (3.1%) | 27 (3.1%) | 23 (3.0%) | 0.933 |
| Peripheral vascular disease | 436 (26.8%) | 267 (32.4%) | 169 (23.3%) | <0.001 |
| Angina Canadian Cardiovascular Society classes I and II | 313 (19.2%) | 177 (19.3%) | 136 (18.1%) | 0.231 |
| Angina Canadian Cardiovascular Society classes III and IV | 280 (17.2%) | 166 (17.3%) | 114 (15.1%) | 0.033 |
| New York Heart Association classes I and II | 1,268 (78.3%) | 683 (78.8%) | 585 (77.8%) | 0.631 |
| New York Heart Association classes III and IV | 316 (19.4%) | 165 (19.0%) | 151 (20.1%) | 0.595 |
| Poor left ventricular systolic function | 143 (8.8%) | 102 (11.9%) | 41 (5.5%) | <0.001 |
| Three-vessel coronary disease | 237 (14.6%) | 168 (19.4%) | 69 (9.2%) | <0.001 |
| Left main disease | 93 (5.7%) | 69 (8.0%) | 24 (3.2%) | <0.001 |
| Logistic EuroSCORE | 21.5 ± 13.8 | 21.8 ± 14.2 | 21.0 ± 13.4 | 0.046 |
| Peak aortic gradient (mm Hg) | 81 ± 26 | 77 ± 24 | 85 ± 28 | <0.001 |
| Aortic annulus diameter (mm) | 22.4 ± 2.2 | 23.2 ± 2.0 | 21.3 ± 1.9 | 0.354 |
| Aortic valve area (cm 2) | 0.65 ± 0.37 | 0.70 ± 0.46 | 0.60 ± 0.21 | 0.086 |
| Aortic valve index (cm 2 /m 2 ) | 0.36 ± 0.18 | 0.37 ± 0.21 | 0.36 ± 0.13 | 0.471 |
However, there were 3 characteristics in which the male patients had potentially favorable status. The men were younger and had lower rates of chronic kidney disease and chronic obstructive pulmonary disease.
The men were taller and, therefore, had a greater body surface area. There was no difference in body mass index between the 2 groups. Women had a higher peak aortic gradient and a smaller aortic valve area. However, there was no difference between the groups in the aortic valve area when corrected for body surface area (aortic valve index) or the aortic annulus diameter.
The procedural characteristics are presented in Table 2 . Equivalent numbers of men and women had implantation of the Edwards and the CoreValve devices. The SC route was used more commonly in men than in women, although the corresponding values for the other routes did not individually show any statistically significant differences between sexes.
| Variable | All Patients (n = 1,627) | Men (n = 871) | Women (n = 756) | p Value |
|---|---|---|---|---|
| Edwards SAPIEN THV and XT | 813 (50.0%) | 421 (48.3%) | 392 (51.9%) | 0.157 |
| Medtronic CoreValve | 814 (50.0%) | 450 (51.7%) | 364 (48.1%) | 0.157 |
| Transfemoral access | 1,097 (67.4%) | 580 (67.2%) | 517 (69.8%) | 0.271 |
| Transapical access | 411 (25.3%) | 218 (25.2%) | 193 (26.0%) | 0.709 |
| Subclavian/transaxillary access | 96 (5.9%) | 65 (7.5%) | 31 (4.2%) | 0.005 |
| Transaortic access | 23 (1.4%) | 8 (1.0%) | 15 (2.0%) | 0.069 |
| Transfemoral access: Surgical closure | 387 (35.3%) | 192 (33.1%) | 195 (37.7%) | 0.110 |
| Transfemoral access: device closure | 700 (63.8%) | 382 (65.9%) | 318 (61.5%) | 0.134 |
| Transfemoral access: manual compression | 10 (0.9%) | 6 (1.5%) | 4 (0.8%) | 0.650 |
Clinical outcomes are listed in Table 3 . In the whole group, procedural success was achieved in 96.4% with no gender difference. There was no difference in the incidence of stroke, conduction abnormalities leading to permanent pacemaker implantation, major organ failure, sepsis, or acute kidney injury requiring renal replacement therapy. All-cause mortality rates at 30 days were the same in men and women, despite their different risk profiles.
| Variables | All Patients (n = 1,627) | Men (n = 871) | Women (n = 756) | p Value |
|---|---|---|---|---|
| Hospital stay, d | 10.7 ± 33.4 | 9.8 ± 39.5 | 11.8 ± 24.4 | 0.219 |
| Procedural success | 1,568 (96.4%) | 838 (96.4%) | 730 (96.6%) | 0.889 |
| Procedural success without major vascular complication | 1,486 (91.3%) | 806 (92.8%) | 680 (89.9%) | 0.044 |
| Valve embolization | 15 (0.9%) | 6 (0.7%) | 9 (1.2%) | 0.288 |
| “Valve in valve” | 39 (2.4%) | 26 (3.0%) | 13 (1.7%) | 0.097 |
| AR grades 3 and 4 | 163 (10.0%) | 107 (12.5%) | 56 (7.5%) | 0.001 |
| Major apical access complication | 6 (0.4%) | 3 (0.3%) | 3 (0.4%) | 0.859 |
| Major femoral vascular complication | 92 (5.7%) | 36 (4.2%) | 56 (7.4%) | 0.004 |
| Major bleeding | 374 (23.0%) | 191 (21.9%) | 183 (24.2%) | 0.388 |
| Need for conversion to aortic surgery | 14 (0.9%) | 9 (1.0%) | 5 (0.7%) | 0.419 |
| Need for permanent pacemaker | 253 (15.6%) | 132 (15.3%) | 121 (16.2%) | 0.606 |
| Stroke and transient ischemic attack with residual deficit | 60 (3.7%) | 32 (3.7%) | 28 (3.8%) | 0.962 |
| Major organ failure or sepsis | 30 (1.8%) | 16 (1.9%) | 14 (1.9%) | 0.974 |
| Acute renal failure requiring ultrafiltration | 75 (4.6%) | 41 (4.7%) | 34 (4.5%) | 0.840 |
| All-cause mortality | 103 (6.3%) | 59 (6.8%) | 44 (5.9%) | 0.446 |
| Combined safety end point | 310 (19.1%) | 160 (18.6%) | 150 (20.2%) | 0.408 |
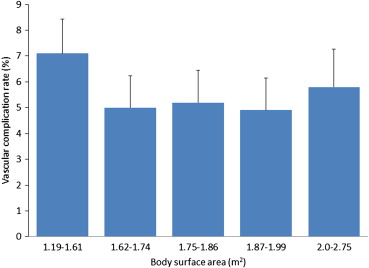
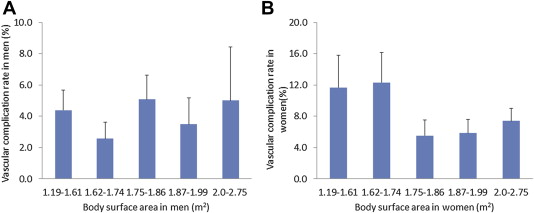
However, women had a higher rate of vascular complications but no difference in major bleeding rate. On stepwise logistic regression analysis, vascular complications were associated with female gender (odds ratio [OR] 2.23, confidence interval [CI] 1.23 to 4.04, p = 0.009) but not with height, weight, body surface area or body mass index ( Figures 1 and 2 ), peripheral vascular disease, or body surface area (p = 0.232 and p = 0.950, respectively).
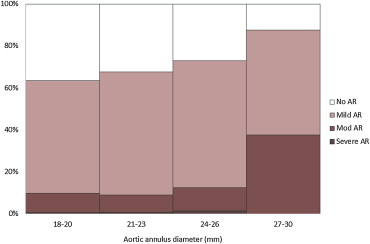
The men had a higher rate of moderate or severe AR than women after the procedure. The rates of moderate or severe AR are shown in Figures 3–5 in relation to annulus diameter. Rates of moderate or severe AR rose from 9.8% for annulus diameter of 18 to 20 mm to 37.5% for annulus diameter of 27 to 30 mm. On multivariate analysis, the severity of postprocedural AR was not related to gender (p = 0.101). However, the degree of AR was strongly related to aortic annulus diameter ( t = 4.0, p <0.0001) as shown in Figures 4 and 5 . Additionally, there were higher rates of postprocedural AR of moderate grade after implantation of the CoreValve device when compared with the Edwards device (12.1% vs 6.7%, p <0.001), although there was no statistically significant difference in the rate of severe AR between the 2 devices, p = 0.244 ( Figure 5 ).