It is unknown whether inflammatory/hemostatic biomarkers are associated with coronary artery calcium (CAC) progression. Our purpose was to evaluate the associations of baseline levels of C-reactive protein, fibrinogen, plasminogen activator inhibitor-1 (PAI-1), tissue plasminogen activator antigen, and circulating factor VII with CAC progression in healthy midlife women. Inflammatory/hemostatic biomarkers were measured at baseline. CAC was quantified by computed tomography scans at baseline and after 2.3 ± 0.5 years of follow-up. Significant CAC progression was defined as present if (1) follow-up CAC Agatston score was >0 if baseline CAC score = 0; (2) annualized change in CAC score was ≥10 if baseline CAC score >0 to <100; and (3) annualized percent change in CAC score was ≥10% if baseline CAC score ≥100. Extent of CAC progression was defined as [log(CAC (follow-up) +25) − log(CAC (baseline) +25)]/year. Logistic and linear regression models were used as appropriate, and the final models were adjusted for baseline CAC score, age, study site, race/ethnicity, menopausal status, sociodemographics, traditional cardiovascular disease (CVD) risk factors, family history of CVD, and CVD medication use. The study included 252 women (baseline age 51.2 ± 2.6 years; 67.5% white; 56.4% premenopausal or early perimenopausal). In final models, only log(PAI-1) was associated with presence of CAC progression (odds ratio 1.91, 95% CI 1.24 to 2.93; per 1 log unit increase in PAI-1; p = 0.003). In addition, higher log(PAI-1) was marginally associated with greater extent of CAC progression (p = 0.06). In conclusion, PAI-1 is associated with the presence of CAC progression in middle-aged women. Targeting PAI-1 may decrease atherogenesis beyond conventional CVD risk factors.
Nearly half of middle-aged women afflicted with coronary heart disease (CHD) have 0 or only 1 traditional risk factor. Coronary artery calcium (CAC) progression, or serial measurement of CAC scores, assesses temporal changes in subclinical atherosclerosis and has been demonstrated to correlate with CHD events. Biomarkers of inflammation and hemostasis have been linked to atherosclerosis but have not been widely integrated into current CHD prevention algorithms due to lack of substantial evidence that they improve risk assessment. In women, additional studies considering menopausal status and race/ethnicity are needed. The goal of this study was to assess associations between baseline levels of 5 biomarkers of inflammation and hemostasis with CAC progression in apparently healthy women of black and white race/ethnicity transitioning through menopause who were free of known cardiovascular disease (CVD). Biomarkers included C-reactive protein (CRP), fibrinogen, plasminogen activator inhibitor-1 (PAI-1), tissue plasminogen activator antigen (tPA-ag), and circulating factor VII (factor VIIc).
Methods
The Study of Women’s Health Across the Nation (SWAN) is a multicenter, multiracial/ethnic prospective cohort study in the United States that was designed to examine the menopausal transition. Seven clinical sites recruited women who were white and one additional predetermined race/ethnicity (blacks in Boston, Chicago, Detroit, Pittsburgh; Chinese in Oakland; Hispanic in New Jersey; Japanese in Los Angeles). Eligibility criteria for the SWAN parent study included age 42 to 52 years, an intact uterus, menstruating within the previous 3 months, not using reproductive hormones, and not pregnant or lactating. Those with previous hysterectomy or bilateral oophorectomy were excluded. Study protocols were approved by the institutional review board at each site, and participants provided written informed consent.
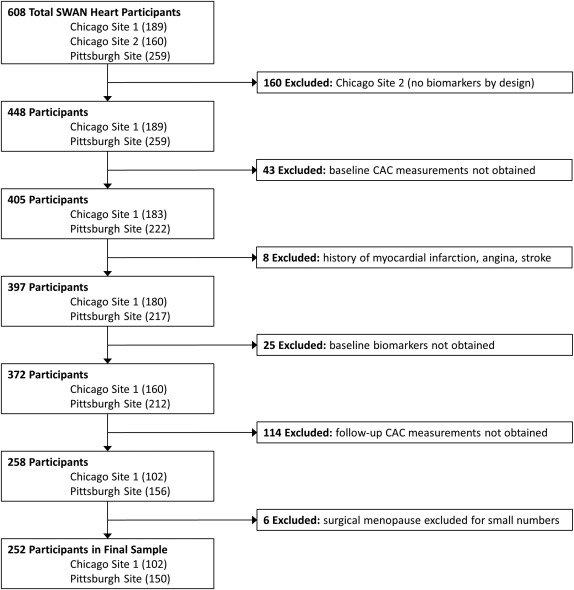
The SWAN Heart Ancillary Study was designed to evaluate subclinical atherosclerosis during the menopausal transition. It was performed at the Pittsburgh and Chicago sites and enrolled 608 self-identified white and black women. This present study used data from both baseline and follow-up visits of the SWAN Heart Study. The baseline SWAN Heart visit occurred during SWAN parent study annual visits 4 through 7, whereas the follow-up SWAN Heart visits occurred during SWAN parent study annual visits 6 through 9. The Pittsburgh site had 1 recruiting location and the Chicago site had 2 recruiting locations. Only the Pittsburgh and one of the Chicago locations, by design, obtained inflammatory/hemostatic biomarkers and consisted of 448 women who were considered to be eligible for the present study. Women were excluded from the current analyses if they did not have baseline CAC measurements (n = 43); reported myocardial infarction, angina, or stroke at either the baseline or follow-up SWAN Heart visits (n = 8); did not have baseline levels of CRP, fibrinogen, PAI-1, tPA-ag, and factor VIIc (n = 25); or did not have follow-up CAC measurements (n = 114). Women with surgical menopause were excluded due to small numbers (n = 6). Thus, the final sample size for those with both baseline and follow-up CAC measurements and baseline inflammatory/hemostatic biomarkers was 252 participants ( Figure 1 ).
Women in the final sample, compared with the 196 excluded women, were older (51.7 ± 2.9 vs 50.6 ± 2.5 years; p = 0.0002), had higher systolic blood pressure (121.4 ± 17.5 vs 115.1 ± 16.0 mm Hg; p = 0.0002), had lower low-density lipoprotein cholesterol (117.2 ± 32.5 vs 125.1 ± 33.3 mg/dl; p = 0.01), and were less likely to have a family history of CVD (58.7% vs 75.0%; p = 0.0003). They were similar with respect to race/ethnicity, body mass index (BMI), high-density lipoprotein cholesterol, triglycerides, diabetes, and smoking.
A computed tomography scanner (C-150 Ultrafast CT Scanner; GE Imatron, San Francisco, California) was used for CAC quantification. Thirty to 40 contiguous 3-mm thick transverse images were obtained from the level of the aortic root to the apex of the heart. Images were obtained during a maximal breath hold, using electrocardiographic triggering so each 100 ms exposure was obtained during the same phase of the cardiac cycle (60%) of the RR interval. All scan data were saved to an optical disk for central scoring, using a Digital Imaging and Communications in Medicine workstation and software by AcuImage, Inc (South San Francisco, California). This software program implements the Agatston scoring method. CAC was defined as a hyperattenuating lesion >130 Hounsfield units with an area of ≥3 pixels. The Agatston unit (U) score was calculated by multiplying the lesion area (mm 2 ) by a density factor (between 1 and 4). The total calcium score was the sum of the individual scores for the 4 major epicardial coronary arteries. Under the supervision of a cardiologist, a technologist scored the scans. This technique was demonstrated at the Pittsburgh site to have an intraclass correlation of 0.99.
Phlebotomy was performed in the morning after an overnight fast within 2 to 5 days of a spontaneous menstrual cycle. If a timed sample could not be obtained because of irregular or cessation of menstrual cycles, a random fasting sample was taken within 90 days of the annual visit. CRP, fibrinogen, PAI-1, tPA-ag, and factor VIIc were all measured in plasma. CRP was measured using ultrasensitive rate immunonephelometry (Dade Behring, Marburg, Germany). The sensitivity of the assay was 0.03 mg/dl, and the interassay coefficient of variations (CVs) at CRP concentrations of 0.05 and 2.2 mg/dl were 10% to 12% and 5% to 7%, respectively. Fibrinogen and factor VIIc were measured in frozen citrated plasma using a clot-based turbidometric detection system (MLA ELECTRA 1400C; Medical Laboratory Automation Inc., Mt. Vernon, New York). Fibrinogen monthly interassay CVs were 2.3% to 3.5% and 2.6% to 3.6% at mean concentrations of 250 and 140 mg/dl, respectively, and factor VIIc monthly interassay CVs were 7.8%, 5%, and 4% for mean activities of 8%, 45%, and 99%, respectively. PAI-1 was measured using a solid phased monoclonal antibody and a second enzyme-labeled goat antiserum for detection (IMUBIND plasma PAI-1 enzyme-linked immunosorbent assay; American Diagnostica, Greenwich, Connecticut). PAI-1 monthly interassay CVs were 5% to 9% and 4% to 9% at mean concentrations of 7 and 22.5 ng/dl, respectively. A double antibody in an enzyme-linked immunosorbent assay (American Diagnostica) measured tPA-ag, with a human single chain tPA-ag as a standard calibrated against an international standard (National Institute for Biological Standards and Control, Hertfordshire, United Kingdom). Monthly interassay CVs were 4.7% to 8.7% and 3.8% to 7.8% at mean concentrations of 5.6 and 11 ng/dl, respectively. Total serum cholesterol, high-density lipoprotein cholesterol, low-density lipoprotein cholesterol, triglycerides, insulin, and glucose were determined from a fasting blood sample with standard methods described previously. The Homeostasis Model Assessment insulin resistance index was calculated using the following equation: [insulin × glucose]/22.5. Glucose in mg/dL was converted to millimoles per liter by multiplying by 0.0555. The Homeostasis Model Assessment represents a computer model of the glucose-insulin feedback system during a fasting state, specifically regarding the functions of the tissues and organs related to glucose regulation.
Blood pressure was measured twice and the average was used. Smoking was coded into current versus past or never smoker. BMI was derived from in-clinic measures of weight and height and was calculated by mass (kg)/height (m) 2 . Income was recorded into 3 categories: <$50,000; $50,000 to <$100,000, and ≥$100,000. Education was recorded as high school graduate or less, some college or college graduate, and graduate degree. CVD medication use (blood pressure medication use and cholesterol medication use), and a family history of CVD were self-reported. Diabetes was defined as the use of any medication for diabetes or a fasting blood glucose of >125 mg/dl.
Menopausal status, obtained annually from reported bleeding patterns in the year preceding the visit, was categorized as (1) premenopausal (bleeding in previous 3 months with no past year change in cycle predictability); (2) early perimenopausal (bleeding the previous 3 months with decrease in cycle predictability in the past year); (3) late perimenopausal (<12 to >3 months of amenorrhea); (4) natural postmenopausal (≥12 months of amenorrhea); (5) surgical postmenopausal (for those who had undergone hysterectomy with/without oophorectomy); and (6) indeterminate status (for women premenopausal/perimenopausal who reported taking hormones in the past year because of the impact of hormone use, even if discontinued, on bleeding patterns). For the current analyses, premenopausal and early perimenopausal women were combined into 1 group, as were late perimenopausal and postmenopausal women. In addition, those who were indeterminate status and postmenopausal women who were on hormone therapy were collapsed into a single category as hormone therapy users.
Data were summarized by CAC progression presence using frequencies, mean with SD, and median with first quartile (Q1) and third quartile (Q3) as appropriate. Differences between groups were assessed by the Wilcoxon–Mann–Whitney test for continuous variables and the chi-square or Fisher’s exact tests for categorical variables. All inflammatory/hemostatic markers had skewed distributions and were therefore log transformed.
CAC progression was evaluated as (1) a categorical outcome for the presence of CAC progression and (2) a continuous outcome for extent of CAC progression. For the presence of CAC progression analyses, a dichotomous variable of significant progression was created. Significant CAC progression was defined as present when (1) CAC score was >0 at follow-up if baseline CAC = 0; (2) annualized change in CAC score was ≥10 if baseline CAC score >0 to <100; and (3) annualized percent change in CAC score was ≥10% if baseline CAC score ≥100. This definition has been previously used in a study of subjects at low risk.
The distribution of the changes in CAC score per year using the original scale was significantly skewed. Therefore, extent of CAC progression per year was calculated as follows :
[ log ( CAC ( follow – up ) + 25 ) − log ( CAC ( baseline ) + 25 ) ] / time ( years ) between first and second scans
Stay updated, free articles. Join our Telegram channel

Full access? Get Clinical Tree


