Young patients with acute myocardial infarction (MI) have a more favorable prognosis than older patients with MI. However, there are limited data comparing the prognosis of young patients with MI with young population controls. Comparison with an age-matched background population could unmask residual mortality risk in young patients with MI that would otherwise not be apparent when merely comparing the mortality risk of young and older patients with MI. We studied 15,151 patients with AMI from 2000 to 2005, of which 601 patients were ≤40 years (young MI). The relative survival ratio (RSR) was calculated as the ratio of the observed survival of patients with MI divided by the expected survival, estimated from the background population (n = 3,771,700) matched for age, gender, and follow-up year. An RSR of <1.0 or >1.0 indicates poorer or better survival, respectively, than the background population. The 12-year all-cause and cardiovascular mortality of young versus older patients was 12.8% versus 50.7% (p <0.001) and 9.2% versus 34.5% (p <0.001), respectively. The adjusted hazard ratio (95% confidence interval) for all-cause and cardiovascular mortality comparing young with older patients was 0.20 (0.16 to 0.27) and 0.27 (0.20 to 0.36), respectively. The RSR (95% confidence interval) of young and older patients was, respectively, 0.969 (0.950 to 0.980) and 0.804 (0.797 to 0.811) at 1 year, 0.942 (0.918 to 0.960) and 0.716 (0.707 to 0.726) at 5 years, and 0.908 (0.878 to 0.938) and 0.638 (0.620 to 0.654) at 9 years. In conclusion, despite a fivefold lower long-term mortality than older patients with MI, young patients with MI remain at significantly greater risk of long-term mortality than an age-matched background population.
Acute myocardial infarction (MI) is a leading cause of mortality worldwide. Among subjects <40 years, previous studies have reported its incidence to be from 2% to 10%. Studies investigating the clinical profiles of young patients with MI have identified smoking as the most prevalent age-specific risk factor. Other common risk factors include obesity (body mass index >30 kg/m 2 ), dyslipidemia, and family history of premature coronary artery disease (CAD). Young patients with MI generally have favorable short-term mortality outcomes compared with older patients with MI. However, owing to the low incidence of MI in this age group, many of these studies reported on few patients only. Previous studies on the long-term prognosis of young patients with MI are mostly limited to cohorts in the 1970 and 1980s, before the widespread implementation of reperfusion therapy. In addition, these studies only compared the prognosis of young patients with MI against older patients with MI, but so far, there are no data on the outcome of young patients with MI in relation to an age-matched cohort in the general population. Comparison with an age-matched general population could unmask residual mortality risk in young patients with MI that would otherwise not be apparent when merely comparing outcomes against the older patients with MI. Therefore, we not only investigated the long-term mortality of patients ≤40 and >40 years hospitalized for MI, we also compared their long-term mortality with a background population matched by age, gender, ethnicity, and calendar year. We hypothesized that, unlike older patients with MI, the mortality risk of young patients with AMI would approach that of an age-matched background population over long-term follow-up.
Methods
This study was conducted according to the Declaration of Helsinki and approved by the institutional review boards of all 6 publicly funded hospitals in Singapore. All patients consecutively hospitalized for MI at the 6 hospitals are captured in this unselected registry that includes 96.0% of patients with MI in Singapore. The public health care system in Singapore provides health care access to all Singapore citizens and permanent residents through 3 interdependent government-led financing programs, thereby minimizing treatment disparities. All data collection, site monitoring, and case adjudication were performed by trained staff and supervisors of the Singapore Cardiac Databank.
We analyzed 15,151 patients admitted for MI under the publicly funded hospitals from January 2000 to December 2005 with follow-up of vital status through to February 2012. Trained investigators adjudicated all potential cases of MI. Patients with MI were identified using admission and discharge criteria in agreement with the International Classification of Diseases , Ninth Revision , codes 410.00 to 414.19, or post-mortem reports. Electrocardiograms were interpreted centrally at the Singapore Cardiac Databank. All clinical chemistry laboratories in Singapore submit a quarterly listing of patients with elevated cardiac troponin, creatine phosphokinase-MB (CK-MB), and creatinine phosphokinase results to the Singapore Cardiac Databank. With the introduction of the universal definition of MI in 2000, we reviewed the troponin and CK-MB results of all patients in our study population. A total of 87.31% of patients had troponin or CK-MB levels more than the ninety-ninth percentile of each hospital laboratory’s reference population, and a diagnosis of MI was made in these patients if there was accompanying ischemia. The remaining 12.29% did not have sufficient cardiac biomarker data to make a diagnosis based on the universal definition. The patients were diagnosed based on the original World Health Organization-MONItoring trends and determinants of CArdiovascular disease (WHO-MONICA) criteria. Sensitivity analyses in which we removed the 12.29% of cases did not change the directionality of our results. Patients <21 years, nonresidents, and those who died within 24 hours of admission were excluded from the current analysis. Complete information was available for 89.8% of data elements recorded at the end of the study period.
Vital status after discharge was evaluated through record linkage with the National Registry of Births and Deaths to determine overall mortality. It is a statutory requirement that death must be registered within 24 hours of its occurrence in the whole country. The primary outcome analyzed was all-cause mortality from the time of hospital admission to the date of death or, for those alive, censored at March 1, 2012. Coronary deaths were ascertained based on International Classification of Diseases , Ninth Revision , codes 410 to 414. Patients with no mortality data in the National Registry of Disease Offices death registry were considered to be alive at this date. Previous studies have documented the validity of this approach.
All statistical analyses were performed using STATA. A p value <0.05 is considered statistically significant. For discrete variables, the data are presented as percentages. For continuous variables, mean ± SD and median were used. Differences in baseline characteristics were compared using the chi-square or Fisher’s exact test (for discrete variables) and unpaired t test (for continuous variables).
The hazard ratio summarizing the differences between the 2 age groups was estimated by Cox regression. To analyze if the risk of death was constant during the observation period, noncause specific models were constructed by adjusting the hazard ratio for competitive risk factors. Each analysis considered 1 specific confounder, which provided information on how the specific confounder attenuated the said age difference. The confounders that were considered for adjustment included gender, ethnicity, hypertension, diabetes, smoking status, family history of premature CAD, obesity (body mass index >30 kg/m 2 ), Global Registry of Acute Coronary Events (GRACE) score, reperfusion therapy, and medications.
The relative survival ratio (RSR) was calculated to compare the survival in our MI cohort with the survival of subjects in the general population matched for age, gender, ethnicity, and calendar year (reference population). The RSR is the ratio of the observed survival rate in a group of patients, during a specified interval (follow-up period), to the expected survival rate estimated from a matched reference population. Expected survival rates were estimated using national life tables of community-dwelling subjects in Singapore from 2000 to 2008; these life tables were obtained from the Singapore National Registry of Disease Offices. We estimated the RSR for both the ≤40 and >40 age groups at 30-day, 1 year, 3 years, 5 years, and 9 years using the Ederer II method, which calculates the expected survival rates for patients under observation at each point of follow-up, such that matched individuals are considered to be at risk until the corresponding MI patient dies or is censored.
We further estimated the relative excess risk (RER) using Poisson regression as follows: RER = (R 1 − R 0 )/(R 2 − R 0 ), where R 1 is the observed mortality of patients ≤40 years after exposure to MI, R 2 is the observed mortality of patients >40 years after exposure to MI, and R 0 is the mortality risk of an “unexposed” reference population. RSR estimates do not fully account for the background risk inherent in the general population, often leading to inflated risk estimates, even after adjustment for co-variables in a multivariable model. RER attempts to subtract this background risk inherent in the general population, such that only excess risk because of MI exposure is considered in each age group. We were only able to estimate the RER to 3 years of follow-up because the smaller size of the ≤40 age group led to unstable excess risk estimates beyond that. Both RSR and RER methods have been widely validated in the oncology literature on survival after exposure to cancer.
Results
From the study population of 15,151 patients hospitalized for MI, 601 (4.0%) were ≤40 years, whereas 14,550 were >40 years ( Table 1 ). Female was the minority gender in both the ≤40 and >40 age group, although the proportion of women was significantly lower in the ≤40 group. Among the ≤40-year-old patients with MI, the ethnic composition was as follows: 53.7% Chinese, 25.0% Malays, and 21.3% Indian, whereas that in the >40 group was 67.2%, 19.6%, and 13.2% for Chinese, Malay, and Indian, respectively. The proportion of Malay and Indian patients was significantly higher among young patients with MI compared with older patients. In terms of co-morbidities, patients with MI aged ≤40 years had a lower prevalence of diabetes (15.8% vs 39.2%, p <0.001) and hypertension (36.1% vs 59.6%, p <0.001) compared with the older patients. Current smoking was the most prevalent risk factor among the ≤40 group (78.4%), compared with 52.7% among the >40 group, p <0.001. The ≤40 group had a 2.7-fold greater likelihood of having a family history of premature coronary artery disease compared with the >40 group, p <0.001. Obesity, defined as having a body mass index of >30, was more common among the ≤40 group (16.7% vs 10.7%, p = 0.022). On admission, 54.9% of ≤40 group presented with ST elevation on the electrocardiogram, whereas in the >40 group, this was 46.5%. The >40 group also has a higher mean serum creatinine. Expectedly, the median Global Registry of Acute Coronary Events (GRACE) score was higher in the >40 group than in the ≤40 group: 143 (119, 172) versus 98 (81,111), p <0.001. With respect to treatment differences, the ≤40 group was more likely to receive inhospital treatment with antiplatelet therapy, β blockers, and lipid-lowering agents ( Table 1 ). The ≤40 group was also more likely to receive reperfusion therapy with fibrinolytics or primary percutaneous coronary intervention, whereas older patients were more likely to undergo coronary artery bypass grafting.
| Variables | Age at AMI (years) ≤40 (n = 601) | Age at AMI >40 (n = 14550) | P-value (where applicable) |
|---|---|---|---|
| Median Age in years (Interquatile Range) | 37 (35, 39) | 64 (54, 73) | – |
| Women | 6.8% | 28.6% | <0.001 |
| Ethnicity | <0.001 | ||
| Chinese | 53.7% | 67.2% | |
| Malay | 25.0% | 19.6% | |
| Indian | 21.3% | 13.2% | |
| Diabetes Mellitus | 15.8% | 39.2% | <0.001 |
| Hypertension | 36.1% | 59.6% | <0.001 |
| Hyperlipidemia | 45.1% | 49.5% | 0.058 |
| Body Mass Index > 30 kg/m 2 | 16.7% | 10.7% | 0.022 |
| Current smoking | 78.4% | 52.7% | <0.001 |
| Family history of premature coronary artery disease | 33.6% | 12.3% | <0.001 |
| Renal failure | 2.4% | 6.4% | <0.001 |
| Peripheral vascular disease | 0.2% | 2.6% | <0.001 |
| Prior AMI | 4.7% | 11.4% | <0.001 |
| Prior Percutaneous Coronary Intervention | 3.8% | 4.6% | 0.360 |
| Prior Coronary Artery Bypass Graft | 0.7% | 2.9% | 0.001 |
| Prior Cerebrovascular Disease | 0.3% | 9.6% | <0.001 |
| Clinical Presentation features | |||
| Heart rate, (Beats/min, mean ± SD) | 80 ± 17 | 83 ± 23 | <0.001 |
| Systolic BP, (mmHg, mean ± SD) | 127 ± 21 | 134 ± 28 | <0.001 |
| ECG features | |||
| ST elevation | 54.9% | 46.5% | <0.001 |
| ST depression | 24.7% | 31.8% | <0.001 |
| Biomarkers on Admission: | |||
| Positive | 87% | 87.3% | 0.83 |
| Serum Creatinine, (mg/dL, mean ± SD) | 100 ± 111 | 124 ± 116 | <0.001 |
| GRACE Score: | |||
| Median value (Interquatile Range) | 98 (81, 111) | 143 (119, 172) | <0.001 |
| Low Risk | 85.3% | 22.3% | – |
| Intermediate Risk | 10.7% | 32.1% | – |
| High Risk | 4.1% | 45.6% | – |
| Medical Therapy: | |||
| Aspirin, % | 92.8% | 87.0% | <0.001 |
| Thienopyridine | 67.4% | 52.0% | <0.001 |
| β-Blockers | 85.2% | 71.0% | <0.001 |
| ACE Inhibitors | 63.2% | 62.2% | 0.599 |
| GP IIb/IIIa Inhibitors | 10.5% | 6.7% | <0.001 |
| Lipid Lowering Agents | 81.2% | 73.6% | <0.001 |
| Reperfusion Therapy: | |||
| Primary Percutaneous Coronary Intervention | 39.5% | 23.0% | <0.001 |
| Elective Percutaneous Coronary Intervention | 15.9% | 10.1% | <0.001 |
| Rescue Percutaneous Coronary Intervention | 16.9% | 9.5% | <0.001 |
| Coronary Artery Bypass Graft | 1.2% | 2.5% | 0.044 |
| Fibrinolysis | 28.5% | 19.6% | <0.001 |
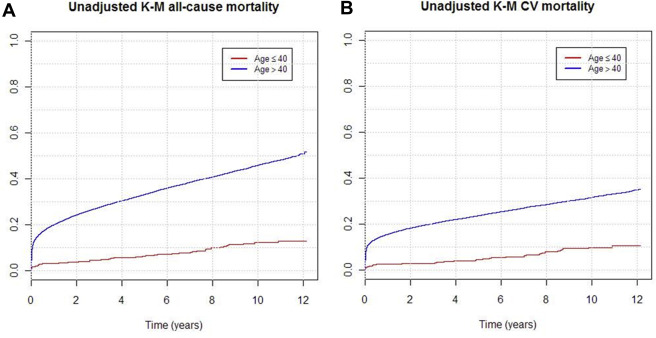
Patients were followed up for a median duration of 7.31 years (2.43, 9.65), during which 7,454 patients died ( Table 2 ). Unadjusted all-cause mortality at 12 years follow-up was higher in the >40 age group at 50.7%, compared with 12.8% in the ≤40 age group ( Figure 1 ). The long-term CV-specific mortality was also higher in the >40 group (34.5% vs 9.2%; Figure 1 ). In a multivariate model adjusted for baseline characteristics, GRACE score and treatment differences, the adjusted hazard ratio for 12-year mortality comparing the ≤40 with the >40 age group was 0.20 for all-cause mortality (95% confidence interval 0.16 to 0.27) and 0.27 for CV cause-specific mortality (95% confidence interval 0.20 to 0.36) ( Table 3 ).
| Age (years) at AMI ≤40 (n = 601) | Age (years) at AMI, >40 (n = 14550) | All age groups (n = 15151) | P-Value | |
|---|---|---|---|---|
| Median Duration of Follow-up (Years, 25th, 75th percentile) | 8.75 (7.08, 10.58) | 7.23 (2.16, 9.59) | 7.31 (2.43, 9.65) | <0.001 |
| Mortality Rate | ||||
| 30-day mortality | ||||
| All-cause | 1.8% | 12.0% | 11.6% | – |
| CV | 1.5% | 10.4% | 10.0% | – |
| 1-Year Mortality | ||||
| All-cause | 3.2% | 19.9% | 19.3% | – |
| CV | 2.3% | 15.5% | 15.0% | – |
| 5-Year Mortality | ||||
| All-cause | 6.2% | 33.1% | 32.0% | – |
| CV | 4.2% | 23.5% | 22.7% | – |
| 10-Year Mortality | ||||
| All-cause | 12.1% | 45.8% | 32.0% | – |
| CV | 8.5% | 31.3% | 30.4% | – |
| 12-Year Mortality | ||||
| All-cause | 12.8% | 50.7% | 49.2% | – |
| CV | 9.2% | 34.5% | 33.7% | – |
| Mortality stratified by AMI category | ||||
| STEMI | 8.9% | 37.7% | 36.3% | <0.001 |
| NSTEMI | 13.0% | 49.2% | 48.0% | <0.001 |
| Variables | Age (years) at AMI, ≤40 | Age (years) at AMI, >40 | P-value |
|---|---|---|---|
| Unadjusted HR (95% CI) | |||
| Overall Mortality | 0.19 (0.15, 0.25) | 1.00 | <0.001 |
| Cause specific CV Mortality | 0.24 (0.18, 0.32) | 1.00 | <0.001 |
| HR adjusted for sex (95% CI) | |||
| Overall Mortality | 0.23 (0.18, 0.29) | 1.00 | <0.001 |
| Cause specific CV Mortality | 0.28 (0.21, 0.37) | 1.00 | <0.001 |
| HR adjusted for ethnicity (95% CI) | |||
| Overall Mortality | 0.19 (0.15, 0.25) | 1.00 | <0.001 |
| Cause specific CV Mortality | 0.24 (0.18, 0.32) | 1.00 | <0.001 |
| HR adjusted for Diabetes & Hypertension (95% CI) | |||
| Overall Mortality | 0.23 (0.18, 0.30) | 1.00 | <0.001 |
| Cause specific CV Mortality | 0.29 (0.22, 0.39) | 1.00 | <0.001 |
| HR adjusted for smoking (95% CI) | |||
| Overall Mortality | 0.22 (0.17, 0.28) | 1.00 | <0.001 |
| Cause specific CV Mortality | 0.28 (0.21, 0.37) | 1.00 | <0.001 |
| HR adjusted for family history of premature coronary artery disease (95% CI) | |||
| Overall Mortality | 0.22 (0.16, 0.28) | 1.00 | <0.001 |
| Cause specific CV Mortality | 0.27 (0.20, 0.37) | 1.00 | <0.001 |
| HR adjusted for obesity BMI > 30kg/m 2 (95% CI) | |||
| Overall Mortality | 0.19 (0.10, 0.35) | 1.00 | <0.001 |
| Cause specific CV Mortality | 0.25 (0.12, 0.49) | 1.00 | <0.001 |
| HR adjusted for GRACE score (95% CI) | |||
| Overall Mortality | 0.54 (0.41, 0.70) | 1.00 | <0.001 |
| Cause specific CV Mortality | 0.66 (0.48, 0.89) | 1.00 | 0.006 |
| Fully Adjusted HR ∗ (95% CI) | |||
| Overall Mortality | 0.20 (0.16, 0.27) | 1.00 | <0.001 |
| Cause specific CV Mortality | 0.27 (0.20, 0.36) | 1.00 | <0.001 |
Stay updated, free articles. Join our Telegram channel

Full access? Get Clinical Tree


