FIGURE 13.1. PVR waveforms. A,Normal waveform shows a sharp systolic upstroke, a narrow peak, and a downstroke that bows toward the baseline with a prominent dicrotic notch. B,With mild arterial obstruction, the downstroke of the waveform bows away from the baseline with loss of the dicrotic notch. C,With moderate arterial obstruction, the amplitude of the waveform is diminished, the upstroke is delayed, and the peak is rounded. D,In severe disease, the amplitude of the waveform is even more diminished and the upstroke is more delayed in comparison to moderate disease.
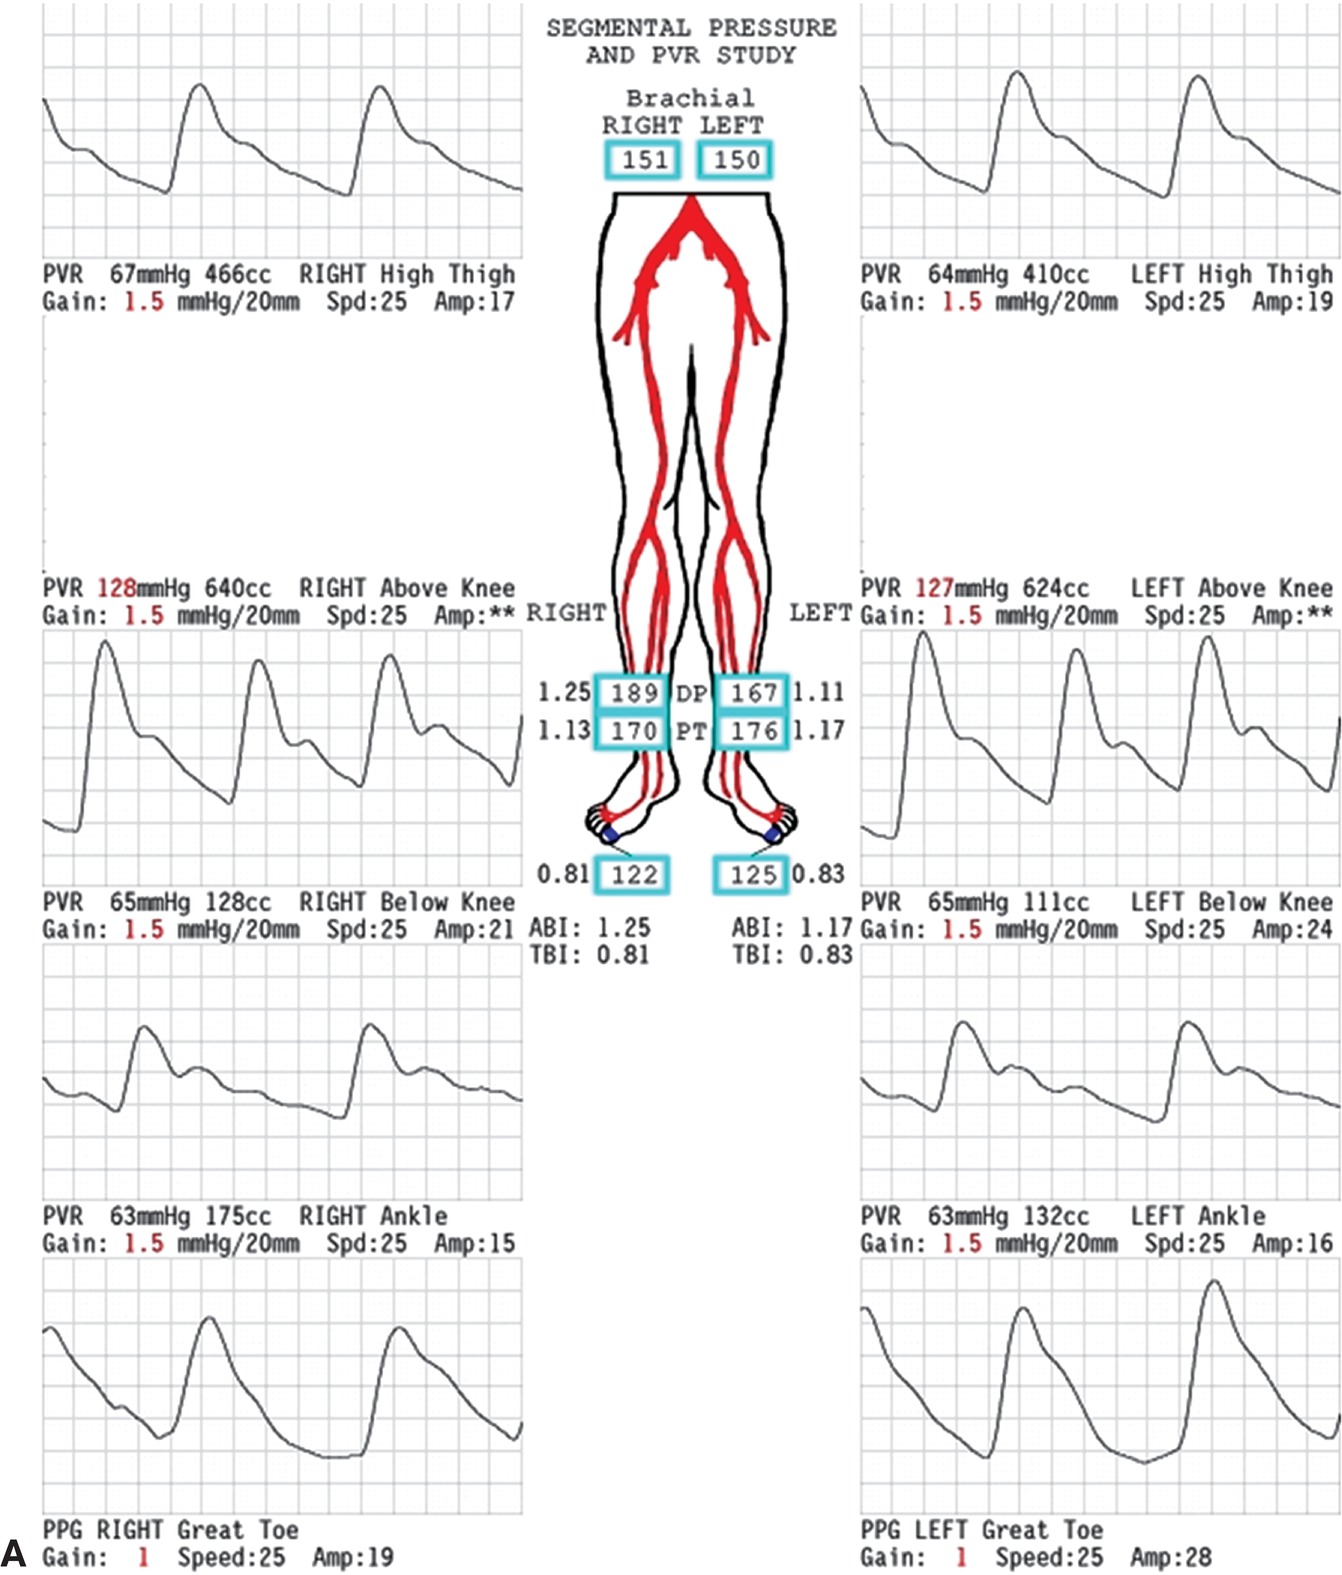
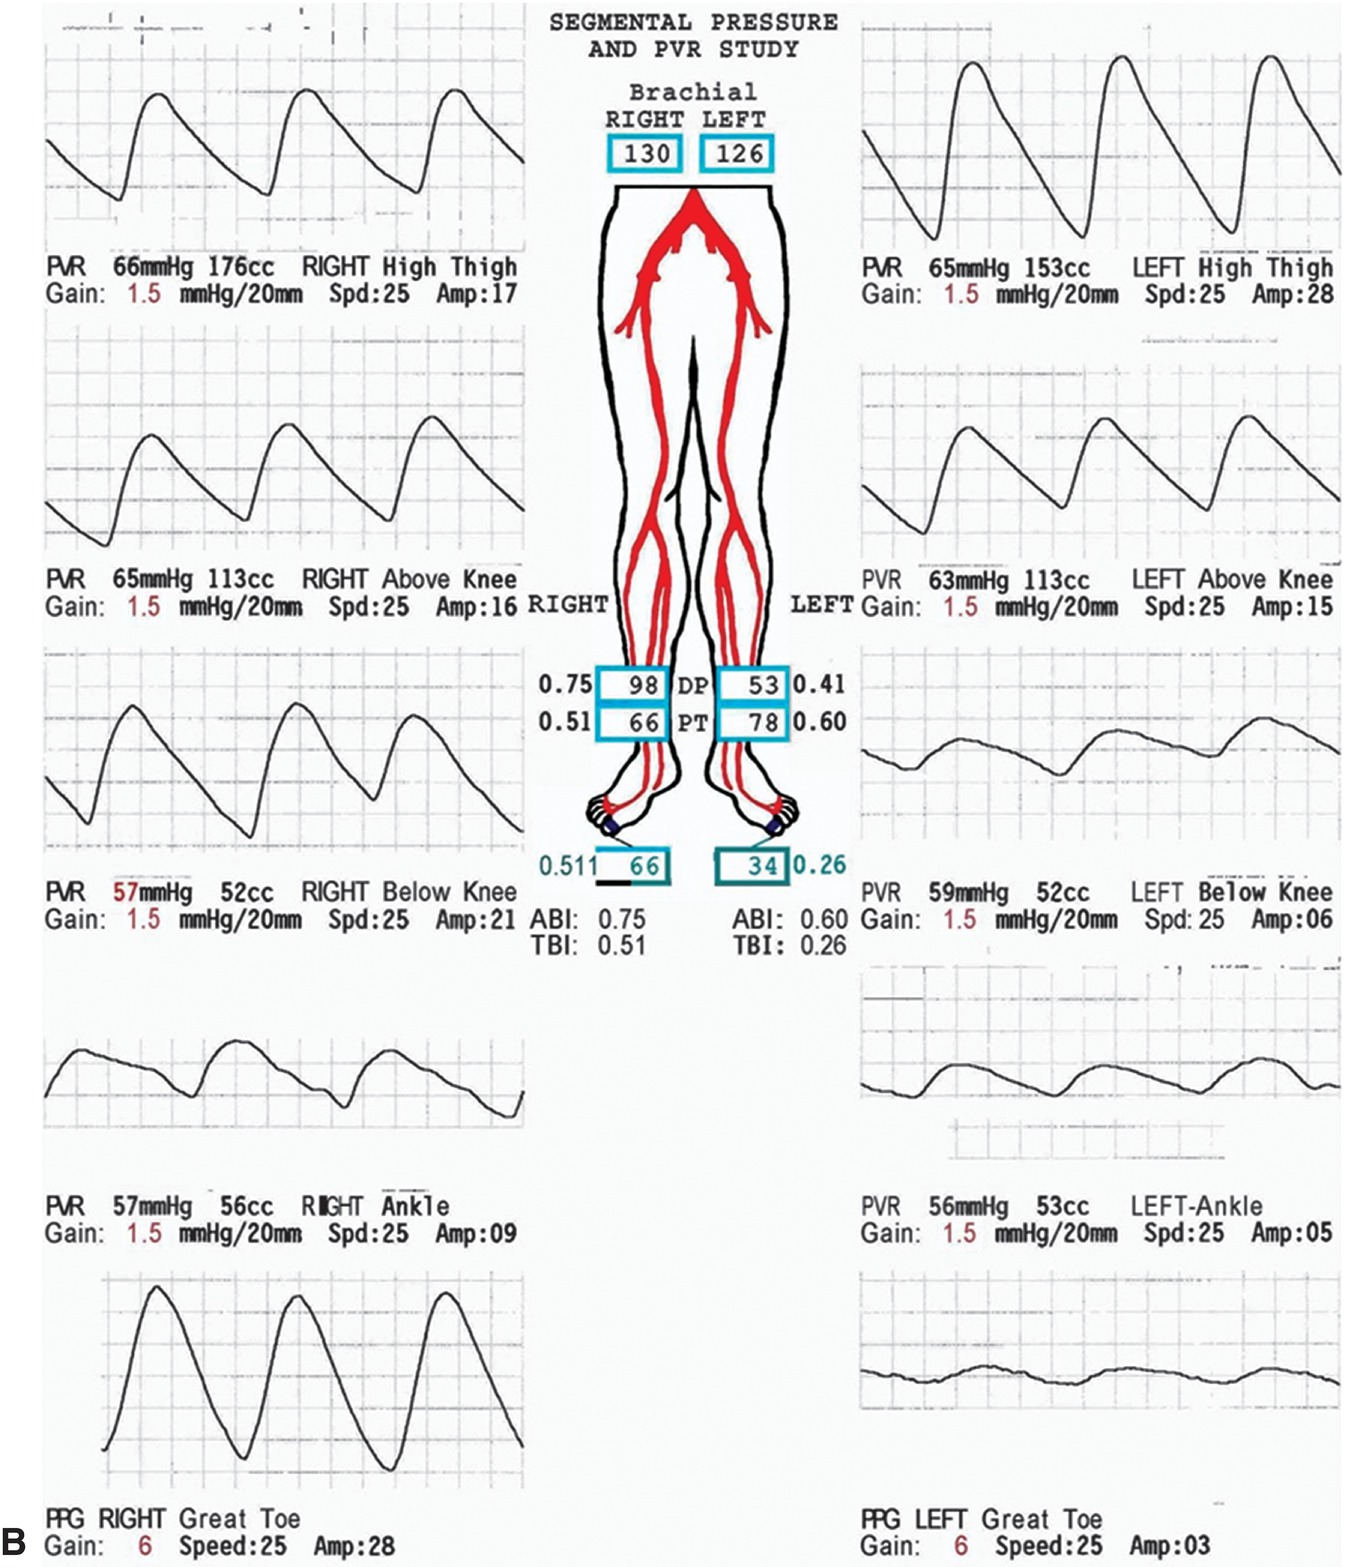
FIGURE 13.2. A, Normal lower extremity segmental PVR examination. The pulse volume waveforms at all levels display the normal features shown in Figure 13.1 and described in the text. In addition to the four standard levels (high thigh, above knee, below knee, and ankle), PPG waveforms from the great toes are also shown. The ankle-brachial index (ABI) and toe-brachial index (TBI) are normal bilaterally. B, Abnormal lower extremity segmental PVR examination. The pulse volume waveforms are abnormal at the right ankle and left below knee, ankle, and toe levels. The right toe pulse volume waveform is borderline. The ABI and TBI are abnormal bilaterally. These findings indicate bilateral disease with more severe involvement on the left.
Digit Waveforms and Pressure Measurements
One of the best current applications for plethysmography is in the evaluation of digit blood flow. Air plethysmography, strain-gauge plethysmography, and PPG can all be adapted for this purpose; however, PPG is probably the most widely used technique (Fig. 13.3). It should be noted that the PPG does not record a true volume change and therefore it is not, strictly speaking, a plethysmograph. It consists of an infrared light–emitting diode and a photosensor that detects the light reflected from the tissue. Because red light is attenuated in proportion to the blood content of tissue, the pulse waveform produced by the photosensor has the same features as the true plethysmographic methods. This technique is easily used in combination with pneumatic cuffs to measure digit systolic pressures, as discussed in Chapter 14 for the upper extremity. Digit pressures, as well as comparisons between digit pressures and brachial pressures, are utilized in clinical practice. The toe-to-brachial artery systolic pressure ratio (toe-brachial index or TBI) in normal subjects is greater than 0.70. An absolute digit pressure of less than 50 mm Hg indicates critical ischemia.
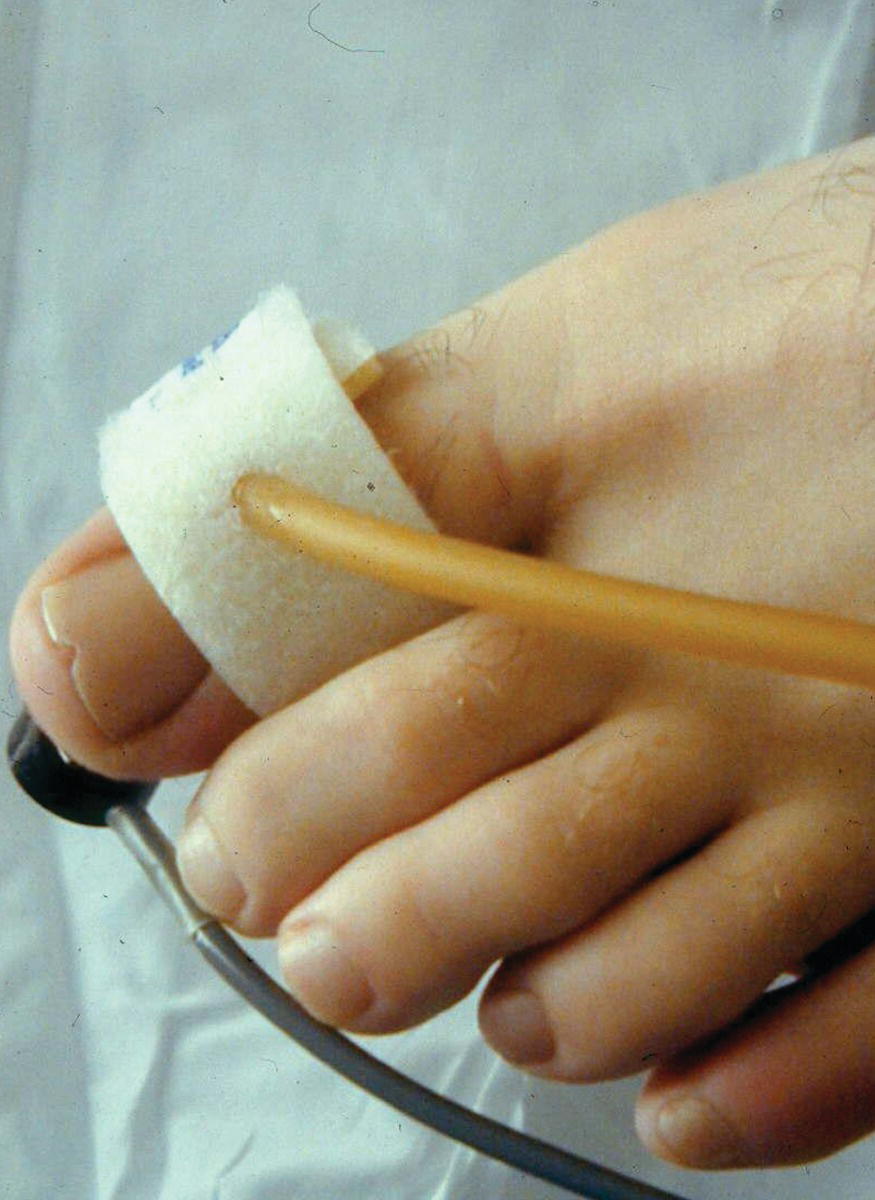
FIGURE 13.3. PPG photosensor and digit cuff attached to the great toe to measure digit pressure.
PPG-derived digit pressures are particularly useful in patients with highly calcified, noncompressible tibial arteries at the ankle. Digital arteries are less subject to calcification, and in the setting of calcified ankle arteries, toe pressures are a better indicator of the degree of distal ischemia than measurement of ankle pressures. The presence of normal digit PPG waveforms in patients with calcified proximal arteries indicates minimal restriction to blood flow despite the calcific arterial disease. Conversely, an obstructive digit waveform in the presence of normal ankle arterial pulses is frequently an indicator of pedal artery occlusive disease, a situation encountered in many patients with diabetes and those with atheroembolism or connective tissue disorders.
DOPPLER ULTRASOUND
Ankle-Brachial Index
A simple continuous-wave Doppler flow detector can be used along with a set of pneumatic cuffs to measure systolic blood pressures in the lower limb. The site of pressure measurement is determined by cuff placement, and any arterial Doppler signal distal to the cuff can be used. The ratio of ankle systolic pressure to brachial systolic pressure is a very useful measure of overall lower extremity perfusion. This test is performed with the patient supine and after resting for a few minutes to make sure that limb blood flow is at baseline levels. A pneumatic cuff is placed just above the ankle, and the continuous-wave Doppler probe is positioned over the posterior tibial or dorsalis pedis artery distal to the cuff to monitor the flow signal. The cuff is then inflated to suprasystolic levels until the Doppler signal disappears and slowly deflated; the pressure in the cuff when the Doppler signal returns is recorded as the systolic pressure. This sequence is repeated with the other artery at that ankle, and the values compared with the highest brachial artery systolic pressure, also obtained with the Doppler. For clinical purposes, the higher ipsilateral dorsalis pedis or posterior tibial artery pressure is divided by the higher brachial artery systolic pressure, yielding the ankle-brachial index (ABI) for that lower extremity. The use of a ratio makes the test relatively independent of day-to-day variations in systemic arterial blood pressure and facilitates serial follow-up and comparisons between patients. As discussed in Chapter 5, a normal ABI is in the range of 1.0 to 1.2, with progressively lower values corresponding to worsening arterial occlusive disease (Table 13.1).6 A decreased ABI also correlates with an increased risk of cardiovascular death, with the risk increasing as the ABI falls, as discussed in Chapter 26.
TABLE 13.1 Correlation between ABI and Clinical Severity of Arterial Ischemiaa
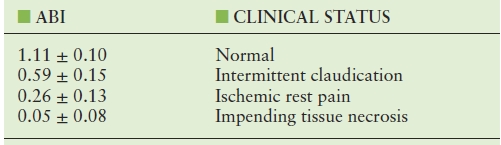
aValues are group means from Yao JST. Hemodynamic studies in peripheral arterial disease. Br J Surg 1970;57:761–766.
ABI, ankle-brachial index.
The measurement of ABI has several limitations. The brachial systolic pressure used in the calculation is assumed to represent the normal systemic pressure. Although relatively uncommon, significant bilateral subclavian or axillary artery occlusive disease will result in a falsely low systemic pressure measurement and a falsely elevated ABI. Calcified tibial arteries, which occur most commonly in patients with diabetes or renal failure, may be inadequately or incompletely compressed by the pneumatic cuff. This results in measurement of a falsely elevated ankle pressure and an artificially increased ABI. For this reason, an ABI of 1.4 or greater should be considered abnormal. Such patients have arterial disease and are also at increased risk of cardiovascular death. When the ABI appears to be falsely elevated, qualitative analysis of Doppler-derived analog or plethysmographic waveforms or measurement of digit systolic pressures is a more appropriate indicator of the arterial status of that lower extremity. Other problems with the ABI include confusion with venous signals when the ankle arterial pressure is very low or unmeasurable. A tibial artery can occlude without a change in ABI if the remaining tibial vessels remain patent; high-grade stenosis may also progress to occlusion without a significant change in ABI. Finally, the variability inherent in the measurement should be known. In general, two ABI measurements that are within a range of ±0.15 are not considered to be significantly different.7 An updated set of guidelines for interpretation of the ABI is shown in Table 13.2.8
TABLE 13.2 Modified Definitions of Normal and Abnormal ABI Values

Based on the 2011 ACCF/AHA Focused Update of the Guideline for the Management of Patients With Peripheral Artery Disease. (From Rooke TW, Hirsch AT, Misra S, et al. 2011 ACCF/AHA Focused Update of the Guideline for the Management of Patients With Peripheral Artery Disease (Updating the 2005 Guideline): A Report of the American College of Cardiology Foundation/American Heart Association Task Force on Practice Guidelines. Circulation 2011;124:2020–2045.)
Stay updated, free articles. Join our Telegram channel

Full access? Get Clinical Tree


