Contemporary data on clinical outcomes after utilization of atherectomy in lower extremity endovascular revascularization are sparse. The study cohort was derived from Healthcare Cost and Utilization Project nationwide inpatient sample database from the year 2012. Peripheral endovascular interventions including atherectomy were identified using appropriate International Classification of Diseases, Ninth Revision, Clinical Modification diagnostic and procedural codes. The subjects were divided and compared in 2 groups: atherectomy versus no atherectomy. Two-level hierarchical multivariate mixed models were created. The coprimary outcomes were in-hospital mortality and amputation; secondary outcome was a composite of in-hospital mortality and periprocedural complications. Hospitalization costs were also assessed. Atherectomy utilization (odds ratio, 95% CI, p value) was independently predictive of lower in-hospital mortality (0.46, 0.28 to 0.75, 0.002) and lower amputation rates (0.83, 0.71 to 0.97, 0.020). Atherectomy use was also predictive of significantly lower secondary composite outcome of in-hospital mortality and complications (0.79, 0.69 to 0.90, 0.001). In the propensity-matched cohort, atherectomy utilization was again associated with a lower rate of amputation (11.18% vs 12.92%, p = 0.029), in-hospital mortality (0.71% vs 1.53%, p 0.001), and any complication (13.24% vs 16.09%, p 0.001). However, atherectomy use was also associated with higher costs ($24,790 ± 397 vs $22635 ± 251, p <0.001). Atherectomy use in conjunction with angioplasty (with or without stenting) was associated with improved in-hospital outcomes in terms of lower amputation rates, mortality, and postprocedural complications.
Peripheral arterial disease (PAD) accounts for significant morbidity and mortality and subsequent financial implications. Nearly 20% of the patients undergoing a revascularization procedure for PAD need a repeat procedure or amputation within 2 years, whereas 1/3 of these patients undergo amputation of contralateral leg in the next 2 years. The endovascular approach for revascularization of lower extremity PAD is associated with high rates of restenosis and need for recurrent procedures especially in the infrainguinal vessels. Attempts to improve clinical outcomes of endovascular procedures have included the development of various stents and drug eluting balloons (DEBs). Atherectomy also serves as an important adjunct in peripheral revascularization especially in heavily calcified lesions. The Tissue Removal by Ultrasound Evaluation study showed an 11.8% reduction in plaque volume with atherectomy primarily involving the fibrous and fibrofatty plaque with resultant luminal volume expansion without concomitant vessel expansion. Previous studies evaluating the clinical efficacy of various atherectomy devices have had inherent limitations including single arm designs, small sample sizes, restrictive patient populations and lack of clinical end points, and so forth. The primary objective of our study was to evaluate postprocedural outcomes in terms of in-hospital mortality, amputation, complications, and hospitalization costs after utilization of atherectomy in lower extremity peripheral revascularization.
Methods
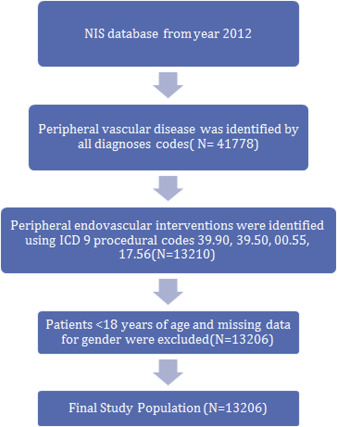
The study cohort was derived from the Nationwide Inpatient Sample (NIS) database from the year 2012, a subset of the Healthcare Cost and Utilization Project sponsored by the Agency for Healthcare Research and Quality. The NIS is the largest publicly available all-payer inpatient care database in the United States, including data on approximately 7 to 8 million discharges per year and is a stratified 20% sample of discharges from US community hospitals, excluding rehabilitation and long-term acute care hospitals. The details regarding the NIS data have been previously published. Annual data quality assessments of the NIS are performed, which guarantee the internal validity of the database. Ascertainment of all diagnoses and procedures was made using the International Classification of Diseases, Ninth Revision, Clinical Modification (ICD-9-CM) codes. Peripheral vascular disease was identified by all diagnoses codes mentioned in Supplementary Table 1 as primary diagnosis codes. Patients aged <18 years were excluded and peripheral endovascular interventions were identified using ICD-9 procedural codes 39.90, 39.50, 00.55, 17.56 ( Figure 1 ; Supplementary Table 1 ). Peripheral atherectomy was identified using the ICD-9 code 17.56 (percutaneous atherectomy of other noncoronary vessels) introduced in October 2011.
The subjects were divided into 2 groups on the basis of whether they underwent peripheral atherectomy or not. The coprimary outcomes were in-hospital mortality and amputation; secondary outcome was a composite of in-hospital mortality and periprocedural complications. Preventable procedural complications were identified by patient safety indicators (PSIs), version 4.4, March 2012. These indicators are based on ICD-9-CM codes and medicare severity diagnosis–related groups, and each PSI has specific inclusion and exclusion criteria. Amputation and other procedure–related complications, which included postprocedure hemorrhage requiring blood transfusion, other iatrogenic respiratory complications (which included ventilator–associated pneumonia, postprocedure aspiration pneumonia, and other respiratory complications not elsewhere classified), postprocedural stroke, or transient ischemic attack, and other vascular complications were identified using ICD-9-CM codes (listed in Supplementary Table 2 ) in any secondary diagnosis field. Vascular complications were defined as PSI code for accidental puncture or ICD-9-CM codes for injury to blood vessels, creation of arteriovenous fistula, vascular complications requiring surgery, vascular device/graft/implant complications, and other vascular complications not elsewhere classified. “Any complications” were defined as occurrence of one or more postprocedural complications listed in Supplementary Table 2 . NIS variables were used to identify patients demographic characteristics including age, gender, and race ( Table 1 ). We defined severity of co-morbid conditions using Deyo’s modification of Charlson co-morbidity index (CCI; Supplementary Table 3 ). The Healthcare Cost and Utilization Project NIS contains data on total charges that hospitals billed for services. These data were merged with the cost to-charge ratio files to get actual cost per hospital visit.
| Variable | Atherectomy | Overall | p-value | |
|---|---|---|---|---|
| NO | YES | |||
| Overall (unweighted) | 10138 (76.77) | 3068(23.23) | 13206 | |
| Overall (weighted) | 50690(76.77) | 15340 (23.23) | 66030 | |
| Overall | ||||
| Age (Years) | <0.001 | |||
| 18-34 | 0.31% | 0.16% | 0.27% | |
| 35-49 | 5.44% | 3.59% | 5.01% | |
| 50-64 | 30.92% | 26.27% | 29.84% | |
| 65-79 | 41.85% | 44.75% | 42.53% | |
| >=80 | 21.47% | 25.23% | 22.35% | |
| Gender | 0.656 | |||
| Male | 56.23% | 56.03% | 56.19% | |
| Female | 43.77% | 43.97% | 43.81% | |
| Race | <0.001 | |||
| White | 66.82% | 60.95% | 65.46% | |
| Non-white | 27.9% | 35.07% | 29.57% | |
| Missing | 5.28% | 3.98% | 4.98% | |
| Charlson/ Deyo comorbidity index | <0.001 | |||
| 0 | 23.86% | 20.24% | 23.02% | |
| 1 | 27.81% | 28.94% | 28.07% | |
| >=2 | 48.33% | 50.81% | 48.91% | |
| Comorbidities | ||||
| Obesity ∗ | 8.63% | 9.78% | 8.9% | <0.001 |
| Hypertension (by History) | 78.11% | 79.14% | 78.35% | 0.007 |
| Diabetes Mellitus | 44.17% | 53.75% | 46.4% | <0.001 |
| Heart failure (By History) | 1.84% | 1.27% | 1.71% | <0.001 |
| History of chronic pulmonary disease | 23.48% | 20.89% | 22.88% | <0.001 |
| Renal failure | 26.02% | 27.57% | 26.38% | <0.001 |
| Neurological disorder or paralysis | 6.93% | 6.88% | 6.92% | 0.808 |
| Anemia or coagulopathy | 22.64% | 25.68% | 23.35% | <0.001 |
| Hematological or oncological malignancy | 1.95% | 2.09% | 1.98% | 0.301 |
| Weight loss | 4.54% | 3.59% | 4.32% | <0.001 |
| Rheumatoid arthritis or other collagen vascular disease | 2.98% | 2.9% | 2.96% | 0.618 |
| Depression, psychosis or substance abuse | 12.72% | 10.5% | 12.21% | <0.001 |
| Fluid and electrolyte disorders | 16.01% | 14.05% | 15.55% | <.0001 |
| Pulmonary circulation disorders | 0.37% | 0.07% | 0.3% | <0.001 |
| Valvular disease | 0.48% | 0.29% | 0.44% | 0.002 |
| Acute Myocardial Infarction | 1.87% | 1.11% | 1.70% | <0.001 |
| Median household income category for patient’s zip code (percentile) | 0.026 | |||
| 1. 0-25th | 33.91% | 33.9% | 33.91% | |
| 2. 26-50th | 24.97% | 24.54% | 24.87% | |
| 3. 51-75th | 22.02% | 21.87% | 21.98% | |
| 4. 76-100th | 16.89% | 17.76% | 17.09% | |
| Primary Payer | <0.001 | |||
| Medicare / Medicaid | 78.44% | 82.53% | 79.39% | |
| Private including HMO | 16.15% | 13.66% | 15.57% | |
| Self pay/no charge/other | 5.14% | 3.72% | 4.81% | |
| Hospital characteristics | ||||
| Hospital bed size | <0.001 | |||
| Small | 11.39% | 10.95% | 11.29% | |
| Medium | 24.46% | 31.68% | 26.14% | |
| Large | 64.14% | 57.37% | 22.57% | |
| Location/Teaching status of Hospital | <0.001 | |||
| Rural | 6.34% | 5.52% | 6.08% | |
| Urban nonteaching | 35.92% | 39.8% | 36.82% | |
| Urban teaching | 57.73% | 54.99% | 57.1% | |
| Hospital Region | <0.001 | |||
| Northeast | 19.02% | 15.48% | 18.2% | |
| Midwest or North Central | 20.07% | 27.54% | 21.81% | |
| South | 35.02% | 34.68% | 34.94% | |
| West | 11.82% | 11.11% | 11.65% | |
| Admission types | <0.001 | |||
| Non elective | 49.41% | 43.81% | 48.11% | |
| Elective admission | 50% | 54.14% | 50.96% | |
| Admission day | <0.001 | |||
| Weekdays | 91.53% | 93.42% | 91.97% | |
| Weekend | 8.47% | 6.58% | 8.03% | |
| Disposition | <0.001 | |||
| Home | 77.54% | 80.78% | 78.3% | |
| Facility | 22.1% | 18.92% | 21.36% | |
| Death | 1.4% | 0.78% | 1.26% | <0.001 |
| Amputation | 13.42% | 11.51% | 12.98% | <0.001 |
| Above-knee amputation | 1.74% | 1.24% | 1.62% | <0.001 |
| Below-knee amputation | 3.05% | 2.61% | 2.95% | 0.005 |
| Minor amputation | 9.58% | 8.31% | 9.28% | <0.001 |
| Cost | 23408±185 | 25196± 359 | 23817±165 | <0.001 |
Stata 11.0 (StataCorp, College Station, Texas) and SAS 9.4 (SAS Institute Inc., Cary, North Carolina) were used for analyses. Weighted values of patient-level observations were generated to produce nationally representative estimates. Differences between categorical variables were tested using the chi-square test, and differences between continuous variables were tested using the Student t test. Hierarchical mixed effects logistic regression models were used for categoricaldependent variables like primary and secondary outcomes and hierarchical mixed effects linear regression models were used for continuous dependent variables like the cost of care. p Value <0.05 was considered significant. In all multivariate models, we included hospital level variables such as location/teaching status of hospital, hospital region, hospital bed size and patient level variables such as age, gender, Deyo modification of CCI, admission over the weekend, primary payer (with Medicare/Medicaid considered as referent), admission type (elective admission as referent), and intervention type (no atherectomy group as referent).
To control for imbalances in baseline characteristics between the 2 study (atherectomy use and no atherectomy use) groups that might influence treatment outcome, we used propensity scoring method to establish matched cohorts. A propensity score, which was assigned to each hospitalization, was based on multivariate logistic regression model that examined the impact of 10 variables (patient demographics, co-morbidities, and hospital characteristics) on the likelihood of treatment assignment. Patients with similar propensity score in 2 treatment groups were matched using a 1 to 2 scheme without replacement using greedy methods.
Furthermore, we investigated the institutional variation in atherectomy utilization by creating 3 separate hierarchical logistic regression models: model 1: unconditional model with only hospital ID intercept; model 2: model 1 + patient level variables including age, gender, Charlson score, admission day, admission type, primary payer; model 3: model 2 + hospital level variables such as hospital region, location/teaching status, and bed size. For each model, between-hospital variance was calculated along with C statistic to account for model discrimination. Interclass correlation coefficient was calculated to determine the proportion of variance attributable to between-hospital variance. The median odds ratio was also calculated to quantify the extent to which the variation in utilization of atherectomy was secondary to clustering of patients within hospitals. All supplementary material will be available online only.
Results
Table 1 lists the baseline characteristics of the 2 study cohorts (atherectomy vs no atherectomy group). Atherectomy group had 56.03% men, 60.95% were whites, and 50.81% of the patients had a CCI score of ≥2 compared with no atherectomy group with 56.23% men (p = 0.656), 66.82% whites (p <0.001), and CCI score of ≥2 in 48.33% (p <0.001). Medicare/Medicaid was the primary payer (82.53% vs 78.44%, p <0.001). A majority of procedures were done in large (57.37% vs 64.14%, p <0.001) and urban teaching (54.99% vs 57.73%, p <0.001) hospitals. The overall rate of periprocedural complications ( Table 2 ) was 15.59%. Atherectomy use was associated with a lower rate of complications (13.2%) compared with the cohort without atherectomy use (16.31%; p <0.001). The overall rate of vascular complications was 10.9% (9.45% in atherectomy group vs 11.33% in no atherectomy group, p <0.001). The rate of amputation was lower in the atherectomy group (11.51%) compared with the group without atherectomy (13.42%; p <0.001).
| Variable | Atherectomy | Overall | P-value | |
|---|---|---|---|---|
| NO | YES | |||
| Overall (weighted) | 10138(76.77) | 3068(23.23) | 13206 | |
| Overall (unweighted) | 50690(76.77) | 15340(23.23) | 66030 | |
| Any complications | 16.31% | 13.2% | 15.59% | <.001 |
| Any Vascular complication | 11.33% | 9.45% | 10.9% | <.001 |
| Compartment syndrome | 0.64% | 0.39% | 0.58% | 0.001 |
| Rupture of artery | 0.04% | 0.03% | 0.04% | 0.701 |
| Arteriovenous fistula | 0.15% | 0.2% | 0.16% | 0.194 |
| Atheroembolism of lower extremity | 0.31% | 0.13% | 0.27% | <0.001 |
| Injury to blood vessels of lower extremity | 0.04% | 0.13% | 0.06% | <.001 |
| Vascular complications requiring surgery | 3.45% | 2.28% | 3.18% | <.001 |
| Post-op hemorrhage requiring transfusion | 1.51% | 1.83% | 1.58% | 0.006 |
| Vascular device, implant, and graft complications | 4.91% | 4.14% | 4.73% | <.001 |
| Other nonspecific peripheral vascular complications | 1.42% | 1.27% | 1.39% | 0.166 |
| Accidental puncture | 0.75% | 0.62% | 0.72% | 0.094 |
| Iatrogenic cardiac complications | 0.77% | 0.49% | 0.7% | <0.001 |
| Respiratory complications (Post-op respiratory failure) | 2.97% | 2.38% | 2.83% | <.001 |
| Postoperative-Stroke/TIA | 0.15% | 0.2% | 0.16% | 0.194 |
| Renal and metabolic complications | 0.39% | 0.36% | 0.39% | 0.528 |
| Postoperative PE | 0.24% | 0.1% | 0.2% | 0.001 |
| Postoperative DVT | 1.12% | 0.65% | 1.01% | <.001 |
| Postoperative infectious complications | 2.15% | 1.63% | 2.03% | <.001 |
Table 3 lists the baseline characteristics in a propensity-matched cohort. Patient demographics, co–morbidities (CCI score), and hospital characteristics were similar among 2 groups. Atherectomy utilization was associated with a lower rate of amputation (11.18% vs 12.92%, p = 0.029), in-hospital mortality (0.71% vs 1.53%, p 0.001), any complication (13.24% vs 16.09%, p 0.001), and any vascular complication (9.51% vs 10.98%, p 0.049). Atherectomy use was however associated with higher costs ($24,790 ± 397 vs $22635 ± 251, p <0.001).
| Variable | Atherectomy | P-value | |
|---|---|---|---|
| NO 5046 | YES 2523 | ||
| Age (years) | 70±0.16 | 70±0.23 | 0.991 |
| Female | 44.0% | 44.3% | 0.806 |
| Charlson/Deyo comorbidity index | 0.957 | ||
| 0 | 21.2% | 21.0% | |
| 1 | 28.3% | 28.5% | |
| >=2 | 50.5% | 50.5% | |
| Primary Payer | 0.985 | ||
| Medicare / Medicaid | 82.3% | 82.2% | |
| Private including HMO | 13.9% | 13.9% | |
| Self pay/no charge/other | 3.8% | 3.9% | |
| Admission types | 0.960 | ||
| Elective admission | 44.8% | 44.8% | |
| Non-elective admission | 55.2% | 55.2% | |
| Admission day | 0.946 | ||
| Weekdays | 93.7% | 93.8% | |
| Weekend | 6.3% | 6.2% | |
| Median household income category for patient’s zip code (percentile) | 0.968 | ||
| 1. 0-25th | 36.1% | 35.8% | |
| 2. 26-50th | 25.3% | 25.1% | |
| 3. 51-75th | 21.0% | 21.4% | |
| 4. 76-100th | 17.5% | 17.7% | |
| Hospital Region | 0.631 | ||
| Northeast | 18.5% | 18.2% | |
| Midwest or North Central | 27.0% | 28.5% | |
| South | 41.3% | 40.5% | |
| West | 13.1% | 12.8% | |
| Hospital Teaching status | 0.737 | ||
| Rural | 4.8% | 5.1% | |
| Urban non teaching | 36.8% | 36.2% | |
| Urban teaching | 58.4% | 58.8% | |
| Hospital bed size | 0.941 | ||
| Small | 10.4% | 10.7% | |
| Medium | 29.8% | 29.7% | |
| Large | 59.8% | 59.7% | |
| c-index | 0.59% | ||
| Outcomes | |||
| Death | 1.53% | 0.71% | 0.003 |
| Above-knee amputation | 1.74% | 1.39% | 0.247 |
| Below-knee amputation | 2.93% | 2.46% | 0.235 |
| Minor amputation | 9.16% | 8.01% | 0.095 |
| Overall amputation | 12.92% | 11.18% | 0.029 |
| Any complication | 16.09% | 13.24% | 0.001 |
| Any vascular complication | 10.98% | 9.51% | 0.049 |
| Any complication/in hospital mortality | 16.45% | 13.36% | <0.001 |
| Cost of care | 22635±251 | 24790±397 | <0.001 |
Stay updated, free articles. Join our Telegram channel

Full access? Get Clinical Tree


