Bleeding, a common complication of acute myocardial infarction (AMI) treatment, is associated with worse outcomes. A contemporary model for major bleeding associated with AMI treatment can stratify patients at elevated risk for bleeding and is needed to risk-adjust AMI practice and outcomes. Using the Acute Coronary Treatment and Intervention Outcomes Network Registry–Get With the Guidelines (ACTION Registry–GWTG) database, an in-hospital major bleeding risk model was developed in a population of patients with ST-segment elevation myocardial infarction and non–ST-segment elevation myocardial infarction. The model used only baseline variables and was developed (n = 72,313) and validated (n = 17,960) in patients with AMI (at 251 United States centers from January 2007 to December 2008). The 12 most statistically and clinically significant variables were incorporated into the final regression model. The calibration plots are shown, and the model discrimination is demonstrated in derivation and validation cohorts, as well as across key subgroups. The rate of major bleeding in the overall population was 10.8%. The 12 factors associated with major bleeding in the model were heart rate, baseline hemoglobin, female gender, baseline serum creatinine, age, electrocardiographic changes, heart failure or shock, diabetes, peripheral artery disease, body weight, systolic blood pressure, and home warfarin use. The risk model discriminated well in the derivation (C-statistic = 0.73) and validation (C-statistic = 0.71) cohorts. A risk score for major bleeding corresponded well with observed bleeding: very low risk (3.9%), low risk (7.3%), moderate risk (16.1%), high risk (29.0%), and very high risk (39.8%). In conclusion, the ACTION Registry–GWTG in-hospital major bleeding model stratifies risk for major bleeding using variables at presentation and enables risk-adjusted bleeding outcomes for quality improvement initiatives and clinical decision making.
Using the Acute Coronary Treatment and Intervention Outcomes Network Registry–Get With the Guidelines (ACTION Registry–GWTG) database, we developed and validated an in-hospital major bleeding risk model that assesses bleeding risk in the acute myocardial infarction (AMI) population. In developing this model, our objectives were to (1) provide a clinically useful tool for risk stratification, (2) describe the ACTION Registry–GWTG risk adjustment model for quality improvement feedback, and (3) use data from this registry for future research in bleeding outcomes.
Methods
The ACTION Registry–GWTG is an ongoing National Cardiovascular Data Registry program for patients with ST-segment elevation myocardial infarction (STEMI) and those with non-STEMI (NSTEMI) admitted to participating hospitals across the United States. The registry is an initiative of the American College of Cardiology Foundation and the American Heart Association, with partnering support from the Society of Chest Pain Centers, the Society of Hospital Medicine, and the American College of Emergency Physicians. The Action Registry–GWTG is sponsored by Bristol-Myers Squibb (New York, New York)/Sanofi Pharmaceuticals (St. Louis, Missouri).
Inclusion and exclusion criteria, data collection, and variables have been described previously. The individual institutional review board of each reporting hospital approved participation in the ACTION Registry–GWTG.
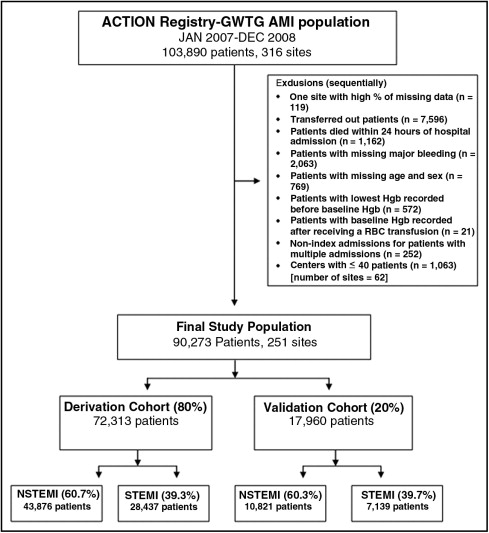
All patients admitted with AMI and reported to the ACTION Registry–GWTG from January 1, 2007, to December 31, 2008, were included in the initial study population ( Figure 1 ). Sequentially, we excluded centers with high percentages of missing data; patients who were transferred out of the reporting hospitals because in-hospital outcomes could not be collected; patients who died within the first 24 hours of hospital admission (because these patients did not have the opportunity to develop major bleeding); and patients with missing data related to major bleeding, age, and gender. Also excluded were patients with the lowest hemoglobin (Hgb) values recorded before the baseline value, patients with baseline Hgb values recorded only after transfusions, nonindex admissions for patients with multiple admissions, and patients from centers with no more than 40 patients with AMI during the study period (because of the possibility that a low caseload might not provide representative data for evaluation). The remaining study population was divided by simple random sampling into a derivation cohort (80% of the total) for model development and a validation cohort (20% of the total) for model validation.
Major bleeding was defined as an absolute Hgb decrease of ≥4 g/dl (baseline to nadir), intracranial hemorrhage, documented or suspected retroperitoneal bleed, any red cell blood transfusion with baseline Hgb ≥9 g/dl, or any red cell transfusion with Hgb <9 g/dl and a suspected bleeding event. Given that most patients who undergo coronary artery bypass grafting receive blood transfusions related to the surgery, bleeding events were considered only if they occurred before coronary artery bypass grafting. Creatinine clearance was calculated using the Cockcroft-Gault formula. Signs of heart failure on admission were indicated by unusual dyspnea with light exertion, recurrent dyspnea occurring in the supine position, fluid retention, rales, jugular venous distension, pulmonary edema on physical examination, or pulmonary edema on chest x-ray presumed to be due to cardiac dysfunction. Previous peripheral artery disease was defined as claudication (either with exertion or at rest), amputation for arterial vascular insufficiency, vascular reconstruction, bypass surgery or percutaneous intervention to the extremities, documented aortic aneurysm with or without repair, and positive noninvasive test results (ultrasound, magnetic resonance, computed tomography, or angiographic imaging) demonstrating >50% diameter stenosis in any peripheral artery. Cardiogenic shock on presentation was defined as an episode of hypotension due to heart failure, lasting >30 minutes, with a systolic blood pressure of <90 mm Hg and/or a cardiac index <2.2 L/min/m 2 and/or the need for inotropic or vasopressive agents or mechanical support to maintain blood pressure and cardiac index above those levels. ST-segment changes included ST depressions or transient ST elevations. Patients with only T-wave inversions on the presenting electrocardiogram were combined with patients who had no electrocardiographic changes; therefore, these 2 groups were combined and included as a derived variable termed “no ST-segment changes” for the multivariate analysis.
The percentage of missing data was <0.7% for all covariates in the model. We handled missing variables in the following ways. For systolic blood pressure and heart rate on admission, missing values were imputed to the STEMI- or NSTEMI-specific median of the nonmissing values. For weight, baseline Hgb and baseline serum creatinine, missing values were similarly set to the gender- and STEMI- or NSTEMI-specific median of the nonmissing values. For categorical variables, missing values were imputed to the most frequent group. The impact of these imputations is an anticonservative estimation of the standard errors of the covariates being estimated.
Potential covariates were selected on the basis of their previous associations with bleeding events and/or clinical importance ( Appendix ). The risk factors considered were limited to those patient factors known at the time of initial hospital presentation. Continuous variables are presented as median (25th and 75th percentiles), and categorical variables are presented as frequencies. Furthermore, continuous variables (age, weight, baseline Hgb, baseline serum creatinine, baseline estimated creatinine clearance, heart rate, and systolic blood pressure on presentation) were tested for nonlinearity by evaluating their associations with major bleeding.
When applicable, plots for each continuous variable versus rates for in-hospital major bleeding were examined to create dichotomous cut points. Cut-off points were considered where the relation between the variable and in-hospital major bleeding became flat or nonlinear; these were finalized once they were determined to be clinically appropriate. Weight ≥105 kg was set to 105 kg, and weight ≤45 kg was set to 45 kg, because curves were relatively flat beyond this range. Similarly, baseline serum creatinine cut-off points of ≤0.8 and ≥6.0 mg/dl (for patients not on dialysis) were used, because the slope became flat after these points. The baseline serum creatinine was set to 6.0 mg/dl for patients currently on dialysis. For heart rate, values ≥150 beats/min were set to 150 beats/min, and values ≤60 beats/min were set to 60 beats/min. There was a U-shaped relation with unadjusted major bleeding and systolic blood pressure; therefore, we analyzed it as a categorical variable, with systolic blood pressure ≤130, 130 to 160, and ≥160 mm Hg.
We explored the univariate relations between all potential covariates and in-hospital major bleeding. We then performed a model including all the potential covariates. Last, we selected 12 covariates for the final regression model (i.e., the ACTION Registry–GWTG in-hospital major bleeding model) on the basis of the strength of statistical significance (i.e., the largest adjusted chi-square values) and clinical importance. Baseline creatinine and creatinine clearance were examined separately. Because of the ease of using a directly measured variable over a calculated one, we chose to use baseline creatinine instead of creatinine clearance.
The logistic generalized estimating equations method with exchangeable working correlation matrix was used to account for within-hospital clustering because patients at the same hospital were more likely to have similar responses, relative to patients at other hospitals (i.e., within-center correlation for responses). This method produced estimates similar to those from logistic regression, but variances were adjusted for the correlation of outcomes within a hospital. The discriminative performance of all the models was evaluated with C-statistics. The accuracy of calibration was assessed by plotting the predicted versus observed in-hospital major bleeding, according to population deciles of predicted risk.
The ACTION Registry–GWTG in-hospital bleeding risk score was created by assigning weighted integers to each variable (on the basis of each variable’s coefficient) in the final in-hospital major bleeding model. The final risk score was calculated by adding up the individual weighted values. Using this as a continuous variable, the predicted probability of in-hospital major bleeding was plotted against the bleeding risk score. To compare rates of observed in-hospital major bleeding, the bleeding risk score was divided into quintiles: very low risk (≤20), low risk (21 to 30), moderate risk (31 to 40), high risk (41 to 50), and very high risk (>50). The in-hospital major bleeding model and the bleeding risk score were then tested in the validation cohort and in the following clinically relevant patient subgroups in the derivation and validation cohorts: male, female, those aged ≥75 years of age, those aged <75 years of age, patients with diabetes, those without diabetics, STEMI, and NSTEMI. Last, we explored the impact of missing data imputation by carrying out a complete case analysis. The results of the complete case analysis were similar to the main analysis, and therefore, only the main results were reported.
All comparisons were 2 tailed, and p values <0.05 were considered statistically significant. The analyses were performed using SAS version 9.2 (SAS Institute Inc., Cary, North Carolina).
Results
A total of 103,890 patients with AMI were admitted to 316 participating hospitals. After exclusions, the final population consisted of 90,273 patients enrolled across 251 United States centers ( Figure 1 ). Derivation (80% [n = 72,313]) and validation (20% [n = 17,960]) cohorts were then randomly created. In-hospital major bleeding occurred in 10.8% in the derivation and validation cohorts. Major bleeding occurred in 10.2% of patients with NSTEMI and 11.8% of those with STEMI in the derivation cohort. Baseline characteristics and in-hospital major bleeding were similar between the derivation and validation cohorts ( Table 1 ).
| Variable | Derivation Cohort (n = 72,313) | Validation Cohort (n = 17,960) |
|---|---|---|
| Age (years) | 64.0 (54.0, 76.0) | 64.0 (54.0, 76.0) |
| Weight (kg) | 83.2 (70.9, 97.5) | 83.0 (71.0, 97.0) |
| Female gender | 35.3% | 35.3% |
| White race | 84.5% | 84.3% |
| Black race | 8.5% | 8.3% |
| Hypertension | 68.9% | 68.5% |
| Diabetes mellitus | 29.6% | 28.8% |
| Previous stroke | 7.8% | 7.6% |
| Peripheral arterial disease | 9.5% | 9.3% |
| Dyslipidemia | 55.0% | 55.3% |
| Previous percutaneous coronary intervention | 22.1% | 22.7% |
| Previous coronary bypass | 14.2% | 14.3% |
| Currently on dialysis | 2.0% | 1.9% |
| Signs and symptoms at presentation | ||
| Cardiogenic shock | 2.6% | 2.7% |
| Signs of heart failure | 15.2% | 15.4% |
| Heart rate (beats/min) | 80 (68.0, 96.0) | 80 (68.0, 96.0) |
| Systolic blood pressure (mm Hg) | 142 (121, 162) | 142 (121, 161) |
| Baseline serum creatinine (mg/dl) (patients not on dialysis) | 1.1 (0.9, 1.3) | 1.1 (0.9, 1.3) |
| Baseline Hgb (g/dl) | 13.9 (12.5, 15.0) | 13.8 (12.5, 15.0) |
| Electrocardiographic features at presentation | ||
| STEMI | 39.3% | 39.7% |
| ST-segment depression or transient ST-segment elevation | 17.8% | 17.4% |
| Home medications | ||
| Aspirin | 42.7% | 43.4% |
| Clopidogrel | 13.7% | 13.6% |
| β blockers | 37.3% | 36.9% |
| Warfarin | 5.3% | 5.2% |
| Angiotensin-converting enzyme inhibitors | 27.0% | 27.0% |
| In-hospital clinical events | ||
| Mortality | 3.7% | 3.7% |
| Major bleeding | 10.8% | 10.7% |
Patients who developed major bleeding were older, weighed less, had higher baseline heart rates, lower systolic blood pressures, increased baseline serum creatinine, and lower Hgb than those who did not have major bleeding.
With multivariate analysis, we determined the factors associated with major bleeding. The factor with the strongest association was heart rate on admission, followed by baseline Hgb <12 g/dl, female gender, baseline serum creatinine, age, electrocardiographic changes, heart failure and/or shock on admission, diabetes mellitus, previous peripheral artery disease, weight, systolic blood pressure on admission, and home warfarin use ( Table 2 ).
| Variable | Chi-Square | Odds Ratio (95% Confidence Interval) |
|---|---|---|
| Heart rate on admission (per 10 beats/min increase) | 379.4 | 1.11 (1.10–1.12) |
| Baseline Hgb <12 mg/dl (vs ≥12 g/dl) | 298.8 | 2.29 (2.08–2.52) |
| Female gender | 120.1 | 1.37 (1.29–1.45) |
| Baseline serum creatinine (per 1 mg/dl increase) | 118.3 | 1.17 (1.14–1.20) |
| Age (per 5-year increase) | 85.5 | 1.04 (1.03–1.05) |
| Electrocardiographic changes | 80.9 | |
| ST-segment changes (vs no ST-segment changes) | 1.25 (1.17–1.34) | |
| ST-segment elevation (vs no ST-segment changes) | 1.76 (1.65–1.88) | |
| Heart failure or/and shock on admission | 60.7 | |
| Signs of heart failure without shock (vs none) | 1.19 (1.11–1.29) | |
| Signs of heart failure with shock (vs none) | 3.87 (3.36–4.45) | |
| Diabetes mellitus | 53.8 | 1.21 (1.15–1.28) |
| Previous peripheral artery disease | 35.2 | 1.27 (1.17–1.37) |
| Weight (per 5-kg decrease) | 26.8 | 1.02 (1.01–1.03) |
| Systolic blood pressure on admission | 20.3 | |
| ≤130 mm Hg (vs 130–160 mm Hg) | 1.15 (1.09–1.21) | |
| ≥160 mm Hg (vs 130–160 mm Hg) | 1.09 (1.03–1.16) | |
| Home warfarin use | 11.0 | 1.18 (1.07–1.30) |
| C-statistic | 0.73 |
The ACTION Registry–GWTG bleeding model showed good calibration between observed and predicted rates of bleeding ( Figure 2 ). The model also showed good discrimination between patients who did and did not have major bleeding events in the derivation (C-statistic = 0.73) as well as the validation (C-statistic = 0.71) cohorts. In addition, the model had good discrimination across subgroups of gender, age, diabetes, and AMI type (STEMI and NSTEMI; Table 3 ).
| Patient Subgroup | Derivation Cohort | Validation Cohort |
|---|---|---|
| Male | 0.73 | 0.73 |
| Female | 0.68 | 0.67 |
| Age ≥75 years | 0.68 | 0.66 |
| Age <75 years | 0.74 | 0.72 |
| Diabetes | 0.73 | 0.72 |
| No diabetes | 0.71 | 0.70 |
| STEMI | 0.72 | 0.70 |
| NSTEMI | 0.73 | 0.72 |
A risk score was derived from the model for use in categorizing patients. The score was developed by assigning weighted values to the variables in the regression model ( Table 4 ). Figure 3 demonstrates the relation between bleeding risk score and the predicted probabilities of in-hospital major bleeding in the derivation cohort. The steepest portion of the sigmoid relation between bleeding risk score and the probability of in-hospital major bleeding occurred at a range of 30 to 70. Most patients in the derivation cohort had bleeding risk scores of 21 to 40, with the distribution as follows: ≤20, n = 12,168 (16.8%), 21 to 30, n = 35,057 (48.5%); 31 to 40, n = 19,769 (27.3%); 41 to 50, n = 4,575 (6.3%); and >50, n = 744 (1.0%). The observed rates of in-hospital major bleeding increased steadily across increasing risk score categories in the derivation and validation cohorts ( Figure 4 ). The ACTION Registry–GWTG risk score showed adequate discrimination among patients with various degrees of in-hospital major bleeding risk in the derivation (C-statistic = 0.69) and validation (C-statistic = 0.68) data sets.


