Contemporary large-scale data, regarding in-hospital outcomes depending on the types of stent used for percutaneous coronary intervention (PCI) is lacking. We queried the Healthcare Cost and Utilization Project’s Nationwide Inpatient Sample from 2006 to 2011 using the International Classification of Diseases , Ninth Revision , Clinical Modification procedure code 36.06 (bare-metal coronary artery stent, BMS) or 36.07 (drug-eluting coronary artery stent, DES) for PCI. All analyses were performed using the designated weighting specified to the Nationwide Inpatient Sample database to minimize bias. Primary outcome was in-hospital mortality. Wald’s chi-square test was used for categorical variables. We built a hierarchical 2 level model adjusted for multiple confounding factors, with hospital identification incorporated as random effects in the model and propensity match analyses were used to adjust confounding variables. A total of 665,804 procedures were analyzed, which were representative of 3,277,884 procedures in the United States. Use of bare-metal stents (BMS) was associated with greater occurrence of in-hospital mortality compared with that of drug-eluting stents (DES; 1.4% vs 0.5%, p <0.001). The association stayed significant after adjustment of various possible confounding factors (odds ratio for DES versus BMS 0.59 [0.54 to 0.64, p <0.001]) and also in propensity matched cohorts (1.2% vs 0.7%, p <0.001). The results continued to be similar in the following high-risk subgroups: diabetes (0.57 [0.50 to 0.64, <0.001]), acute myocardial infarction and/or shock (0.53 [0.49 to 0.57, <0.001]), age >80 (0.66 [0.58 to 0.74, <0.001]), and multivessel PCI (0.55 [0.46 to 0.66, <0.001]). In conclusion, DES use was associated with lesser in-hospital mortality compared with BMS. This outcome benefit was seen across subgroups in various subgroups including elderly, diabetics, and acute myocardial infarction as well as multivessel interventions.
Although drug-eluting stents (DES) have been purported for their effectiveness in reducing in-stent restenosis and long-term target vessel revascularization rates, their impact on cardiovascular mortality beyond the use of bare-metal stents (BMS) has been debatable. Additionally, some authors have suggested higher stent thrombosis rates with some DES especially over long term questioning their usefulness over BMS. Most of the randomized control trials (RCTs) have been limited by their inclusion of patients with stable coronary artery disease (CAD) and further by limited sample sizes affecting their ability to draw meaningful conclusions regarding mortality differences between various stent subtypes. Indeed, recent meta-analyses of these RCTs with greater sample sizes have indicated significant mortality benefit of DES. Nonetheless, data regarding the postprocedural outcomes and benefits of using DES over BMS in real-world clinical practice are sparse. The major objective of our study was to study the difference in postprocedural mortality after percutaneous coronary intervention (PCI) between DES and BMS in a broad range of patient population from the largest publicly available inpatient database in the United States.
Methods
The study cohort was derived from the Nationwide Inpatient Sample (NIS) database, a subset of the Healthcare Cost and Utilization Project sponsored by the Agency for Healthcare Research and Quality, from 2006 to 2011. The NIS is the largest publicly available all-payer inpatient care database in the United States, including data on approximately 7 to 8 million discharges per year, and it is a stratified sample designed to approximate a 20% sample of US community (nonfederal, short term, general, and specialty) hospitals. National estimates are produced using sampling weights provided by the sponsor. The details regarding the NIS data have been previously published. Annual data quality assessments of the NIS are performed, which guarantee the internal validity of the database. The NIS database results have been shown to correlate well with other hospitalization discharge databases in the United States and have also been used to explain trends in other acute medical and surgical conditions.
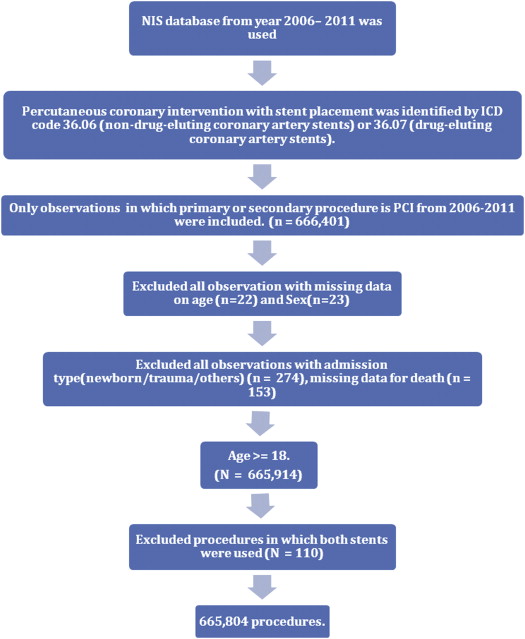
We queried the NIS database using the International Classification of Diseases , Ninth Revision , Clinical Modification (ICD-9-CM) procedure code of 36.06 (bare metal coronary artery stent) or 36.07 (drug eluting coronary artery stent) for PCI if present in primary or secondary procedure field. After excluding patients with age <18 years; trauma admissions or observations with missing data for age, gender, or death; and procedures where both stents types were used, the final study sample size included 665,804 procedures (representative of 3,277,884 procedures in the United States; Figure 1 ).
In-hospital mortality was defined if a patient died during hospitalization. Preventable procedural complications were identified by patient safety indicators (PSIs), which have been established by the Agency for Healthcare Research and Quality to monitor preventable adverse events during hospitalization. These indicators are based on ICD-9-CM codes and Medicare severity diagnosis-related groups and each PSI has specific inclusion and exclusion criteria PSI individual measure technical specifications, Version 4.4, March 2012 (Agency for Healthcare Research and Quality (US)) was used to identify and define preventable complications. Other procedure related complications, which included postprocedure hemorrhage requiring blood transfusion, iatrogenic cardiac complications (including postprocedural myocardial infarction (MI) and postprocedural need for revascularization), pericardial complications, requiring open heart surgery, other iatrogenic respiratory complications (which included ventilator associated pneumonia, postprocedure aspiration pneumonia, and other respiratory complications not elsewhere classified), postprocedural stroke or transient ischemic attack, and other vascular complications were identified using ICD-9-CM codes (listed in Supplementary Table 1 ) in any secondary diagnosis field. Vascular complications were defined as PSI code for accidental puncture or ICD-9-CM codes for injury to blood vessels, creation of arteriovenous fistula, injury to retroperitoneum, vascular complications requiring surgery, and other vascular complications not elsewhere classified. “Any complications” was defined as occurrence of ≥1 postprocedure complications listed in Supplementary Table 1 . Similar method has been used before. The ICD-9-CM codes were used to identify each of these diagnoses and procedures.
NIS variables were used to identify patients’ demographic characteristics including age, gender, and race ( Table 1 ). We defined severity of co-morbid conditions using Deyo’s modification of Charlson co-morbidity index (CCI). This index contains 17 co-morbid conditions with differential weights. The score ranges from 0 to 33, with greater scores corresponding to greater burden of co-morbid diseases ( Supplementary Table 2 ). Facilities were considered to be teaching hospitals if they had an American Medical Association approved residency program, were a member of the Council of Teaching Hospitals, or had a fulltime equivalent interns and residents to patients’ ratio of 0.25 or greater. Annual hospital volume was determined on a year-to-year basis using the unique hospital identification number to calculate the total number of procedures performed by a particular institution in a given year.
| Baseline | ||||
|---|---|---|---|---|
| Variable | BMS | DES | OVERALL | P value |
| Total no. of PCI (unweighted NO.) | 154421(23.19) | 511383(76.81) | 665804 | |
| Total no. of PCI (weighted no.) | 760594( 23.20) | 2517290(76.80) | 3277884 | |
| Age(Years) | 64.9±0.03 | 64.1±0.02 | 64.3±0.01 | <0.001 |
| Male | 67.0% | 65.9% | 66.2% | <0.001 |
| Female | 33.0% | 34.1% | 33.8% | <0.001 |
| Race ∗ | <0.001 | |||
| White | 63.0% | 62.7% | 62.8% | |
| Non-white | 15.7% | 15.1% | 15.3% | |
| Missing | 21.3% | 22.1% | 22.0% | |
| Charlson/deyo comorbidity index † | <0.001 | |||
| 0 | 16.0% | 24.1% | 22.2% | |
| 1 | 39.6% | 39.7% | 39.7% | |
| >=2 | 44.4% | 36.2% | 38.1% | |
| Obesity | 12.0% | 12.0% | 12.0% | 0.8 |
| Hypertension | 68.9% | 71.3% | 70.8% | <0.001 |
| Diabetes Mellitus | 30.5% | 33.5% | 32.8% | <0.001 |
| Heart failure | 0.6% | 0.3% | 0.4% | <0.001 |
| Chronic pulmonary disease | 17.3% | 14.4% | 15.1% | <0.001 |
| Peripheral vascular disease | 11.0% | 10.1% | 10.3% | <0.001 |
| Renal failure | 10.9% | 8.7% | 9.2% | <0.001 |
| Neurological disorder or paralysis | 3.5% | 2.5% | 2.7% | <0.001 |
| Anemia or coagulopathy | 12.0% | 7.8% | 8.8% | <0.001 |
| Hematological or oncological malignancy | 2.7% | 1.0% | 1.4% | <0.001 |
| Rheumatoid arthritis or other collagen vascular Disease | 1.9 % | 1.7 % | 1.7 % | <0.001 |
| Depression, psychosis or substance abuse | 11.3% | 8.1% | 8.9% | <0.001 |
| Median household income category for patient’s zip code ‡ (Percentile) | <0.001 | |||
| 1. 0-25th | 28.8% | 25.8% | 26.5% | |
| 2. 26-50th | 27.8% | 27.3% | 27.4% | |
| 3. 51-75th | 24.5% | 25.0% | 24.9% | |
| 4. 76-100th | 18.8% | 22.0% | 21.2% | |
| Primary Payer | <0.001 | |||
| Medicare / Medicaid | 58.3% | 54.8% | 55.6% | |
| Private including HMO | 29.8% | 38.0% | 36.1% | |
| Self pay/no charge/other | 11.9% | 7.2% | 8.3% | |
| Hospital bed size | <0.001 | |||
| Small | 8.6% | 7.7% | 7.9% | |
| Medium | 20.4% | 19.9% | 20.0% | |
| Large | 71.0% | 72.5% | 72.1% | |
| Hospital Location | <0.001 | |||
| Rural | 6.0% | 5.7% | 5.8% | |
| Urban | 94.0% | 94.3% | 94.2% | |
| Hospital Region | <0.001 | |||
| Northeast | 17.9% | 21.6% | 20.8% | |
| Midwest or North Central | 29.5% | 26.4% | 27.1% | |
| South | 42.3% | 41.9% | 42.0% | |
| West | 10.2% | 10.1% | 10.% | |
| Hospital Teaching status | <0.001 | |||
| Non-teaching | 44.1% | 42.5% | 42.9% | |
| Teaching | 55.9% | 57.5% | 57.1% | |
| Admission types | <0.001 | |||
| Emergent/Urgent | 76.1% | 69.1% | 70.7% | |
| Elective admission | 23.9% | 30.9% | 29.3% | |
| Admission day | <0.001 | |||
| Weekdays | 82.3% | 86.2% | 85.3% | |
| Weekend | 17.7% | 13.8% | 14.7% | |
| Length of stay (Days) | 3.15±0.01 | 2.54±0.01 | 2.68±0.01 | <0.001 |
| Total charges($) | 16823 ± 27 | 18050 ± 14 | 17768 ± 12 | <0.001 |
| Disposition | <0.001 | |||
| Home | 94.6% | 97.4% | 96.8% | |
| Facility/others | 5.4% | 2.6% | 3.2% | |
| Death | 1.4% | 0.5% | 0.7% | |
| Procedures | ||||
| Fraction Flow Reserve | 0.3% | 0.4% | 0.4% | <0.001 |
| Intravascular Ultrasound | 4.4% | 5.5% | 5.2% | <0.001 |
| Intra Aortic Balloon Pump | 0.5% | 0.2% | 0.3% | <0.001 |
| Co-Diagnosis | ||||
| Acute Myocardial Infarction | 53.1% | 37.0% | 40.7% | <0.001 |
| Shock | 2.2% | 0.8% | 1.1% | <0.001 |
| Unstable (Shock+Ventilator) | 2.2% | 0.8% | 1.1% | <0.001 |
∗ Race was missing in 22.0% of the study population.
† Charlson/Deyo comorbidity index was calculated as per Deyo classification.1 Comorbidities were identified by ICD-9-CM code Mentioned in any of the diagnostic fields.
‡ This represents a quartile classification of the estimated median household income of residents in the patient’s zip code. These Values are derived from zip code-demographic data obtained from Claritas. The quartiles are identified by values of 1 to 4, indicating the poorest to wealthiest populations. Because these estimates are updated annually, the value ranges vary by year ( http://www.hcup-us.ahrq.gov/db/vars/zipinc_qrtl/nisnote.jsp ).
The Healthcare Cost and Utilization Project NIS contains data on total charges for each hospital in the databases, which represent the amount that hospitals are billed for services. To calculate the estimated cost of hospitalizations, the NIS data were merged with cost-to-charge ratios available from Healthcare Cost and Utilization Project. Using the merged data elements from the cost-to-charge ratio files and the total charges reported in the NIS database, we converted the hospital’s total charge data to cost estimates by simply multiplying total charges with the appropriate cost-to-charge ratio. These costs are in essence standardized and can be measured across hospitals and are used in remainder of report. Adjusted cost for each year was calculated in terms of the 2010 cost, after adjusting for inflation according to the latest consumer price index data released by the US government on January 16, 2013.
Stata IC 11.0 (StataCorp, College Station, Texas) and SAS 9.2 (SAS Institute Inc, Cary, North Carolina) were used for analyses. Weighted values of patient level observations were generated to produce a nationally representative estimate of the entire US population of hospitalized patients. Differences between categorical variables were tested using the chi-square test and differences between continuous variables were tested using the Student t test. A p value <0.05 was considered significant.
Hierarchical models or multilevel models are designed to analyze data with nested observations. The NIS data set is inherently hierarchical, namely, the data have group-specific (i.e., hospital) attributes and within each group (i.e., hospital) there are patients who contribute patient-specific attributes to the data. Hierarchical models take into consideration the effect of nesting (e.g., patient-level effects nested within hospital-level effects). Hence, it is superior to simple regression modeling for the available data set. Hierarchical mixed-effects logistic regression models were used for categorical dependent variables such as in-hospital mortality and procedural complications, and hierarchical mixed-effects linear regression models were used for continuous dependent variables such as cost of hospitalization and length of stay (LOS). Two-level hierarchical models (with patient-level factors nested within hospital-level factors) were created with the unique hospital identification number incorporated as random effects within the model. In all multivariate models, we included hospital-level variables such as hospital region (Northeast, South, and Midwest with West as referent); teaching versus nonteaching hospital; hospital procedure volume; and patient-level variables such as age, gender, acute MI, shock, Deyo modification of Charlson co-morbidity index, occurrence of procedural complications, admission over the weekend, primary payer (with Medicare and/or Medicaid considered as referent), and in addition to type of stents used. All interactions were thoroughly tested. Multicollinearity, defined as a perfect linear relation or very high correlation between 2 or more predictor (independent) variables was assessed using variance inflation factor, with variance inflation factor >20 suggestive of multicollinearity.
We used propensity-scoring method to establish matched cohorts to control for imbalances of patients’ and institutional characteristics between the 2 different stent groups that might influence treatment outcome. A propensity score, which was assigned to each hospitalization, was based on multivariate logistic regression model that examined the impact of 10 variables (patient demographics, co-morbidities, and hospital characteristics; Table 2 ) on the likelihood of treatment assignment. Patients with similar propensity score in the 2 treatment groups were matched using a 1 to 1 scheme without replacement using greedy algorithm.
| Baseline table(Propensity Score Match Cohort) | |||
|---|---|---|---|
| Demographic variable | BMS | DES | P-Value |
| Total no. of PCI(unweighted no.) | 67344 | 67344 | |
| Age (Years) | 65.1±0.05 | 65.4±0.05 | <0.01 |
| Gender | 0.04 | ||
| Male | 67.3% | 67.8% | |
| Female | 32.7% | 32.2% | |
| Diabetes Mellitus | 29.9% | 30.2% | 0.24 |
| Myocardial Infarction or Shock | 46.9% | 47.1% | 0.52 |
| Charlson/deyo comorbidity index | 0.91 | ||
| 0 | 19.3% | 19.3% | |
| 1 | 40.1% | 40.0% | |
| >=2 | 40.6% | 40.7% | |
| Primary Payer | <0.01 | ||
| Medicare / Medicaid | 58.2% | 59.0% | |
| Private including HMO | 30.7% | 30.7% | |
| Self pay/no charge/other | 11.1% | 10.3% | |
| Hospital characteristics | |||
| Hospital Teaching status | 0.5 | ||
| Non-teaching | 46.0% | 45.9% | |
| Teaching | 54.0% | 54.1% | |
| Admission types | 0.27 | ||
| Emergent/Urgent | 72.5% | 72.7% | |
| Elective admission | 27.5% | 27.3% | |
| Operator Volume | 0.87 | ||
| 1st quartile(1-14) | 29.8% | 29.8% | |
| 2nd quartile(15-40) | 27.2% | 27.4% | |
| 3rd quartile(41-94) | 23.7% | 23.6% | |
| 4th quartile(95-718) | 19.3% | 19.2% | |
| Hospital Volume | 0.67 | ||
| 1st quartile(1-350) | 21.8% | 21.9% | |
| 2nd quartile(351-635) | 24.7% | 24.4% | |
| 3rd quartile(636-1128) | 26.7% | 26.7% | |
| 4th quartile(1129-3608) | 26.9% | 26.9% | |
| Outcomes | |||
| Death | 1.2% | 0.6% | <0.001 |
| Any complication | 6.6% | 5.4% | <0.001 |
| Length of Stay (Days) | 2.91 ± 0.01 | 2.72±0.01 | <0.001 |
| Cost of Hospitalization($) | 15692±34 | 18153±36 | <0.001 |
Results
Table 1 lists baseline characteristics of the study population. A total of 665,804 procedures were analyzed, which were representative of 3,277,884 procedures in the United States. The mean age was 64.9 ± 0.05 years (BMS) and 64.1 ± 0.02 years (DES). Men constituted 66.2% of the overall population with 62.8 being whites. Hypertension was the most common co-morbidity present in 70.8 of the patients, whereas diabetes was present in 32.8. Furthermore, 40.7 of the patients who underwent PCI had a diagnosis of MI. A total of 57% of stents were placed in teaching hospitals and the rest in nonteaching hospitals. Approximately 70.7 of the procedures were emergent. Medicare and/or Medicaid (58.3% for BMS and 54.8% for DES) was the primary payer.
In univariate analysis, the overall postprocedural mortality ( Table 1 ) was 0.49% in the cohort receiving DES and 1.43% for BMS. The results continued to be similar in the following subgroups: diabetes (1.4% vs 0.5%, p <0.001), acute myocardial infarction (AMI) and/or shock (2.5% vs 1.1%, p <0.001), age >80 (3.4% vs 1.5%, p <0.001), and multivessel PCI (1.8% vs 0.5%, p <0.001; Figure 2 ). Among relevant complications ( Table 3 ), vascular complications were significantly lesser with use of DES (1.7% for DES vs 2.1% for BMS; p value <0.001), whereas significant hemorrhage (hemorrhage required transfusion) occurred in only 0.4% of the patients receiving DES versus 0.7% with the use of BMS (p value <0.001).
| Complications | BMS | DES | p value |
|---|---|---|---|
| Any complications | 6.9 | 4.6 | <0.001 |
| Death + Any complications | 7.6 | 4.9 | <0.001 |
| Death + Vascular + Stroke + Cardiac + Requirement of Open heart surgery | 5.3 | 3.5 | <0.001 |
| Death + Vascular + Stroke + Cardiac + Requirement of Open heart surgery + Renal + DVT + Infectious | 6.3 | 4.2 | <0.001 |
| Vascular complications | 2.1 | 1.7 | <0.001 |
| 1)Postop-hemorrhage requiring transfusion | 0.7 | 0.4 | <0.001 |
| 2)Vascular injury | 1.5 | 1.3 | <0.001 |
| Cardiac complications | 1.8 | 1.3 | <0.001 |
| Iatrogenic cardiac complications | 1.7 | 0.1 | <0.001 |
| Respiratory complications (Post-op resp failure) | 2.0 | 1.0 | <0.001 |
| 1)Acute renal failure requiring dialysis | 0.3 | 0.2 | <0.001 |
| 2)Acute severe metabolic derangement | 0.5 | 0.3 | <0.001 |
| Postoperative DVT/PE | 0.6 | 0.4 | <0.001 |
Stay updated, free articles. Join our Telegram channel

Full access? Get Clinical Tree


