Epicardial adipose tissue (EAT) is considered to play a role in the pathogenesis of coronary atherosclerosis. However, whether total EAT volume or location-specific EAT thickness may be a better predictor of obstructive coronary artery disease (CAD) is inconclusive. We investigated whether the total volume or location-specific thickness of EAT measured on computed tomography (CT) could be a useful marker of CAD on top of clinical risk factors and Agatston score. Two hundred eight consecutive subjects with clinical suspicion of CAD receiving coronary arterial calcium (CAC)–scoring CT and CT coronary angiography were retrospectively divided into 2 groups: an obstructive CAD group (n = 97) and a nonobstructive CAD group (n = 111). Total EAT volume and EAT thicknesses at different locations were measured on CAC-scoring CT. Left atrioventricular groove (AVG) EAT thickness was the sole EAT measurement that showed association with increasing number of vessels exhibiting ≥50% stenosis (p for trend <0.001). Logistic regression showed that left AVG EAT thickness was the most important EAT predictor of obstructive CAD (odds ratio 1.16, 95% confidence interval 1.04 to 1.29, p = 0.006; optimal threshold ≥15 mm, odds ratio 4.62, 95% confidence interval 2.24 to 9.56, p <0.001). Adding left AVG EAT thickness on top of clinical risk factors plus Agatston score improved prediction of obstructive CAD (area under the curve from 0.848 to 0.912, p = 0.002). In conclusion, excessive left AVG EAT adiposity is an important risk factor for obstructive CAD, independent of clinical risk factors and Agatston score. However, further trials are needed in investigation of combined assessment of location-specific EAT thickness and Agatston score on CAC scan as to whether this biomarker could improve CAD risk stratification in the general population.
Epicardial adipose tissue (EAT) is a layer of adipose tissue within the pericardial sac, which covers 80% of the heart surface. It shares the same embryological origin with abdominal visceral fat and appears to be implicated in the pathogenesis of cardiometabolic disease. The uneven regional distribution of EAT around the heart is mostly located in the pericoronary atrioventricular groove (AVG) and interventricular groove (IVG). There is increasing attention on the regional EAT thickness rather than total EAT volume as a biomarker for cardiometabolic risk. Whether total EAT volume or location-specific EAT thickness may be a better predictor of obstructive coronary artery disease (CAD) is still inconclusive. In addition, whether measurement of EAT can improve the risk stratification of CAD after adjusting for clinical risk factors and Agatston score has not been well addressed. In this study, we included subjects receiving coronary artery calcium (CAC)–scoring computed tomography (CT) and computed tomography coronary angiography (CTCA) for suspicion of CAD. We analyzed the EAT measurements and Agatston score on the CAC-scoring CT and evaluated coronary artery stenosis by CTCA. We aimed to investigate the association of a variety of EAT measurements and obstructive CAD on CAC-scoring CT.
Methods
The study was approved by our Institutional Review Board, and the requirement for informed consent was waived. From January 2007 to June 2010, 219 consecutive subjects receiving CAC-scoring CT and CTCA in 1 session for clinical suspicion of CAD were listed on the intuitional Radiological Information System. We applied exclusion criteria of (1) poor image quality of CTCA (5 subjects), (2) previous cardiac surgery (2 subjects), and (3) incomplete clinical risk factors (4 subjects). Finally, 208 subjects (208 of 219, 94.9%) were included in this study. Subjects were divided into 2 groups: the obstructive CAD (O-CAD) group (n = 97) having at least 1 vessel with ≥50% stenosis in any of 3 major coronary arteries on CTCA and the nonobstructive CAD (NO-CAD) group (n = 111) being those who did not fit into the O-CAD group. Power analysis using published data indicated that this sample size was adequate to detect significant differences in the total EAT volume between subjects with and without CAD (power >0.9).
Clinical information including age, male gender, body mass index (BMI), hypertension, diabetes mellitus, smoking habits, statin use, and waist circumstance were recorded by nursing staff. High-density lipoprotein cholesterol, low-density lipoprotein cholesterol, and triglyceride levels were measured within 3 months before or after CT scan. All study subjects underwent an electrocardiographic-gated CT scan to assess CAC. Beta-adrenergic antagonist (metoprolol 50 to 100 mg; AstraZeneca, Hertfordshire, England) was orally administered 60 minutes before a scan if the patient’s heart rate was ≥70 beats/min. CT scan was performed on a 64-detector raw CT scanner (Aquilion 64; Toshiba Medical Systems, Tokyo, Japan) with the following parameters: 64 × 0.5 mm collimation, rotation time 350 ms, pitch factor 0.2 to 0.3, tube voltage 120 kV, and tube current 400 mA. A standard Agatston score was obtained using semiautomatic software (Vitrea 2; Vital Images, Minnetonka, Michigan) by a CT technologist (CSC, 6 years of experience in cardiac CT) and verified by a thoracic radiologist (YCW, 5 years of experience in cardiovascular radiology). Agatston scores were further categorized into 4 ranks (0, 1 to 100, 101 to 400, and >400) for CAD risk stratification. CTCA was performed right after the CAC-scoring CT. The contrast agent Iopromide (Ultravist, Bayer Schering Pharma, Berlin, Germany) was injected intravenously at a rate of 3.5 to 5.0 ml/s depending on body weight with a power injector (Stellant D, Medrad, Indianola, Pennsylvania). Sublingual nitroglycerin (5 mg) was administered for all patients 5 minutes before scanning. Images were acquired with an effective tube current of 500 to 800 mA using prospective electrocardiographically controlled tube current modulation to reduce radiation dose. Coronary arterial lesions were assessed among the 3 major coronary arteries by CTCA in American Heart Association 16-segment model, including right coronary artery, left main coronary–left anterior descending coronary artery, and left circumflex coronary artery (LC). CAD was defined as obstructive coronary stenosis if there was at least 1 lesion with ≥50% luminal diameter stenosis. The CTCAs were evaluated using a dedicated workstation (Vitrea 2; Vital Images, Minnetonka, Minnesota). Each coronary artery lesion was evaluated for the severity of stenosis using multiplanar reconstruction and curved-planar reconstruction. Coronary lesion assessment was performed by 2 experienced thoracic radiologists (YCW and YLH, with 5 and 9 years of experience in cardiovascular radiology, respectively) using the Society of Cardiovascular Computed Tomography (SCCT) guidelines for the interpretation of the stenosis severity of the entire coronary artery. Although discrepant results occurred, repeated readings with final reach of consensus by the 2 readers were performed. Substantial evidence, including our previous reports, has supported the diagnostic accuracy of CTCA in the evaluation of coronary artery stenosis. The number of coronary arteries narrowed ≥50% was assessed among 3 major coronary arteries including right coronary artery, left main coronary–left anterior descending coronary artery, and LC.
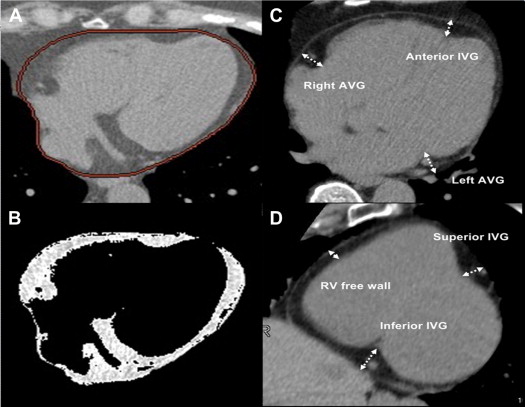
The total volume of EAT and various measurements of regional thickness of EAT on CAC-scoring CT were measured by a CT technologist (CSC) and confirmed by a thoracic radiologist (YLH) who were both blinded to the result of CTCA, according to a previously described method as shown in Figure 1 . EAT was defined as the adipose tissue between the surface of myocardium and the epicardium. Total EAT volume was measured in axial images starting from left main pulmonary artery level to the apex of left ventricle. Total EAT volume was calculated by Volume Analysis software of Advantage Workstation AW 4.0 (GE healthcare, Milwaukee, Wisconsin) with attenuation ranging from −50 to −200 HU. Multiplanar reconstructions were obtained in the left ventricular short axis at the basal portion of left ventricle. On the parasternal short-axis plane, regional EAT thickness was measured in 3 segments at superior IVG, inferior IVG, and right ventricular free wall. On the horizontal long-axis plane, it was measured in 3 segments at left AVG, right AVG, and anterior IVG. Measurement of EAT thickness was determined as the distance from myocardium in the orthogonal direction to visceral epicardium. On the basis of a random sample of 30 subjects from the 208 subjects evaluated by the 2 investigators (CSC. and FZW, with 4 years experience in cardiovascular radiology), intraobserver and interobserver reproducibility for all EAT measurements were calculated and found to be highly reliable (intraclass correlation coefficient >0.90 for all measurements).

All statistical analyses were performed using SPSS 17.0 for Windows (SPSS Inc., Chicago, Illinois) except that G*Power 3.1 was used to perform a priori power analyses. Continuous variables are presented as mean ± SD or median (interquartile range). Categorical variables are summarized as frequencies and percentages and compared using chi-square test. Differences in continuous variables between the 2 groups were compared by independent Student’s t test. Comparisons between groups stratified by the number of coronary arteries narrowed were determined by 1-way analysis of variance and a linear regression model. The statistical significance for all tests was set at p <0.05 and corrected when necessary for multiple testing using Bonferroni correction. Correlations between total EAT volume, BMI, waist circumference, and various EAT thicknesses were measured by Pearson’s correlation coefficient test. Multivariate logistic regression was used to determine predictors of CAD adjusted for clinical risk factors (including age, male gender, diabetes mellitus, hypertension, smoking habit, BMI, waist circumstance, high-density lipoprotein cholesterol, low-density lipoprotein cholesterol, and triglyceride) and Agatston score. Correlations between various EAT measurements and CAD in specific vessels were expressed as correlation coefficients using point-biserial r coefficients. The performance of clinical risk factors (except for statin use) and additional combination of Agatston score and left AVG EAT thickness to predict CAD was assessed by receiver operating characteristic curve.
Results
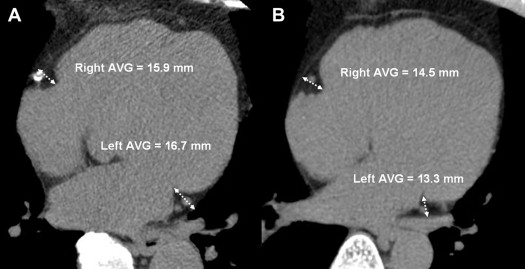
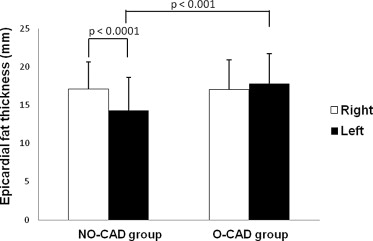
The clinical characteristics of the subjects are listed in Table 1 . The age, male gender, waist circumference, high-density lipoprotein cholesterol, statin use, diabetes mellitus, smoking habits, hypertension, and Agatston score were significantly greater in the O-CAD group than in the NO-CAD group, except for BMI, low-density lipoprotein cholesterol, and triglycerides. A variety of CT measurements of EAT are listed in Table 2 . There were no significant differences in the total EAT volume between the 2 groups. Left AVG EAT in the O-CAD group (17.8 ± 3.9 mm) was thicker than that in the NO-CAD group (14.3 ± 4.3 mm; p <0.001 with Bonferroni correction), as shown in the representative case in Figure 2 ; no difference of all other EAT thickness was noted between the 2 groups. In the NO-CAD group, the right AVG EAT was significantly thicker than the left AVG EAT (17.1 ± 3.5 mm vs 14.3 ± 4.3 mm, p <0.0001). In the O-CAD group, there was no significant difference between the right and left AVG EAT thicknesses (17.0 ± 3.9 mm vs 17.8 ± 3.9 mm, p = 0.252) ( Figure 3 ).
| Variables | Obstructive CAD | p | |
|---|---|---|---|
| No (n = 111) | Yes (n = 97) | ||
| Age (yrs) | 53.5 ± 7.8 | 56.6 ± 10.1 | 0.010 |
| Men | 74 (67%) | 91 (94%) | <0.001 |
| Waist circumference (cm) | 87.9 ± 9.5 | 90.5 ± 8.1 | 0.040 |
| Boby mass index (kg/m 2 ) | 24.8 ± 3.5 | 25.0 ± 3.2 | 0.610 |
| Triglycerides (mg/dl) | 127 (97, 188) | 139 (98, 201) | 0.693 |
| High-density lipoprotein cholesterol (mg/dl) | 46.3 ± 18.9 | 39.3 ± 9.8 | <0.001 |
| Low-density lipoprotein cholesterol (mg/dl) | 117.89 ± 33.3 | 110.86 ± 29.33 | 0.144 |
| Statin use | 17 (15%) | 29 (29%) | 0.013 |
| Diabetes mellitus | 14 (13%) | 33 (34%) | <0.001 |
| Current smokers | 36 (32%) | 58 (60%) | <0.001 |
| Hypertension | 33 (30%) | 51 (53%) | <0.001 |
| Number of coronary arteries narrowed ≥50% | 0 | 1.9 ± 0.8 | <0.001 |
| Agatston score | 0 (0, 6.7) | 157.1 (34.5, 658) | <0.001 |
| Variable | Obstructive CAD | Corrected p Value ∗ | |
|---|---|---|---|
| No | Yes | ||
| Total EAT volume (ml) | 117.6 ± 44.3 | 125.6 ± 47.1 | 1.000 |
| Right AVG EAT thickness (mm) | 17.1 ± 3.5 | 17.0 ± 3.9 | 1.000 |
| Left AVG EAT thickness (mm) | 14.3 ± 4.3 | 17.8 ± 3.9 | <0.001 |
| Anterior IVG EAT thickness (mm) | 7.5 ± 2.4 | 9.1 ± 3.2 | 1.000 |
| RV free-wall EAT thickness (mm) | 5.9 ± 2.3 | 5.8 ± 2.3 | 1.000 |
| Superior IVG EAT thickness (mm) | 9.1 ± 2.6 | 9.0 ± 2.5 | 1.000 |
| Inferior IVG EAT thickness (mm) | 4.3 ± 1.9 | 4.2 ± 1.6 | 1.000 |


Of all the EAT measurements, the total EAT volume had the most significant correlation with BMI (r = 0.487, p <0.001) and waist circumference (r = 0.526, p <0.001). Among the correlations between total EAT volume and each regional EAT thickness, we found the superior IVG EAT thickness had the best correlation (r = 0.646), followed by the right ventricular free-wall EAT thickness (r = 0.492), the inferior IVG EAT thickness (r = 0.418), and the right AVG EAT thickness (r = 0.347) summarized in Supplementary Table 1 (all p <0.01). Various CT measurements of EAT according to the number of coronary arteries narrowed ≥50% are summarized in Table 3 . Left AVG EAT thickness significantly increased as the number of coronary arteries narrowed increased, whereas all other thicknesses did not.
| Variable | Number of Coronary Arteries Narrowed ≥50% | p for Trend ∗ | p for ANOVA ∗ | |||
|---|---|---|---|---|---|---|
| 0 (n = 110) | 1 (n = 30) | 2 (n = 37) | 3 (n = 28) | |||
| Total EAT volume (ml) | 117.6 ± 44.3 | 122.4 ± 37.6 | 126.6 ± 50.1 | 127.8 ± 53.3 | 1.000 | 1.000 |
| Right AVG EAT thickness (mm) | 17.0 ± 3.9 | 17.6 ± 3.5 | 17.4 ± 4.0 | 16.3 ± 2.8 | 1.000 | 1.000 |
| Left AVG EAT thickness (mm) | 14.3 ± 4.3 | 17.1 ± 3.6 † | 17.4 ± 4.0 ‡ | 19.0 ± 4.1 § | <0.001 | <0.001 |
| Anterior IVG EAT thickness (mm) | 9.1 ± 14.8 | 7.1 ± 2.1 | 7.5 ± 2.3 | 7.8 ± 2.9 | 1.000 | 1.000 |
| RV free-wall EAT thickness (mm) | 5.8 ± 2.3 | 5.9 ± 2.3 | 5.7 ± 2.0 | 6.3 ± 2.8 | 1.000 | 1.000 |
| Superior IVG EAT thickness (mm) | 9.0 ± 2.5 | 8.7 ± 2.6 | 9.4 ± 2.8 | 9.2 ± 2.4 | 1.000 | 1.000 |
| Inferior IVG EAT thickness (mm) | 4.2 ± 1.6 | 4.2 ± 1.9 | 4.3 ± 1.8 | 4.5 ± 2.0 | 1.000 | 1.000 |
∗ Bonferroni’s correction for multiple testing.
† p Value = 0.001 (number of coronary arteries narrowed 0 vs 1).
‡ p Value <0.0001 (number of coronary arteries narrowed 2 vs 0).
§ p Value <0.0001 (number of coronary arteries narrowed 3 vs 0).
There was a significant positive correlation between left AVG EAT thickness and presence of obstructive CAD in the left main coronary–left anterior descending coronary artery (r = 0.372), right coronary artery (r = 0.338), and LC (r = 0.244; all p <0.001), as listed in Table 4 . Therefore, there appeared to be no topographical preference of left AVG EAT thickness to CAD at LC. All other EAT thicknesses showed no correlation with obstructive CAD in any coronary artery.


