A blood-based gene expression test can diagnose obstructive coronary artery disease (CAD). The test is sensitive to inflammatory and immune processes associated with atherosclerosis. Acute exercise engages short-term inflammatory pathways, and exercise stress testing may affect results of gene expression testing during the same diagnostic workup. The objective of this study was to evaluate the effect of exercise on diagnostic gene expression testing. Ten patients with obstructive CAD (≥50% stenosis) and 10 with no/minimal CAD (≤20% stenosis) were identified by angiography. Blood samples for gene expression were obtained at baseline, peak exercise, 30 to 60 minutes after testing, and 24 to 36 hours after testing. Core-lab gene expression analysis yielded raw gene expression scores (GES) for each time point. Linear models were used to estimate changes in GES, adjusting for CAD status and other covariates. GES increased during peak exercise across both genders, with no significant differences as a function of CAD status. The overall adjusted mean GES increase at peak exercise was 0.29 (95% confidence interval 0.22 to 0.36; p <0.001). GES after exercise were not significantly different from baseline. The change in gene expression levels during peak exercise may reflect a transient inflammatory response to acute exercise that may be independent of patient gender or CAD status. In conclusion, CAD GES increase at peak exercise testing and rapidly return to baseline. Such may reflect a transient inflammatory response to acute exercise independent of gender or extent of CAD.
A noninvasive, blood-based gene expression test has been developed and validated for clinical use in evaluating the presence and extent of obstructive CAD in symptomatic patients. Exercise stress testing is frequently used in clinical settings as a diagnostic procedure, but its effect on diagnostic gene expression testing has not been evaluated. Although regular exercise has anti-inflammatory effects that can reduce cardiovascular risk over time, acute exercise has the paradoxical effect of triggering proinflammatory processes and oxidative stress. If exercise stress testing precedes the blood draw for gene expression testing during the same diagnostic workup, the gene expression results could be affected by the proinflammatory effects of acute exercise. The impact of stress testing on gene expression may depend on how much time elapses before the blood draw, and it may also depend on patient-specific variables, such as gender and degree of atherosclerosis. This study provides an initial assessment of the effects of exercise stress testing on diagnostic gene expression. Gene expression scores were measured at baseline, peak exercise, and 2 time intervals after stress testing to evaluate the magnitude and time course of changes in gene expression. The study explores the contributions of CAD status and other clinical variables to changes in gene expression, and it provides an exploratory analysis of the specific genes and processes affected by acute exercise.
Methods
This was a single-center, prospective pilot study. Patients who had clinically indicated invasive coronary angiography within 1 year of the study were identified and, after a discussion of risk, offered the opportunity to participate in a clinical trial. Consenting subjects were divided into 2 study groups. Each group had 5 men and 5 women, and the groups were divided by the presence of obstructive (≥50% stenosis in at least 1 coronary artery) versus no/minimally obstructive CAD (≤20% stenosis in any coronary artery). Percent stenosis was determined by standard visual inspection of coronary angiographic images by the clinical angiographer.
Patients 45 to 75 years who were able to perform exercise stress testing to >85% of maximal predicted heart rate were eligible. Patients were ineligible for the study if they (a) had severe CAD for which exercise testing would be unsafe; (b) had current myocardial infarction or high-risk acute coronary syndromes, New York Heart Association class III to IV heart failure, severe regurgitant or stenotic valvular lesions, severe left ventricular systolic dysfunction with left ventricular ejection fraction <35%, active systemic infection, protocol-specified rheumatologic or autoimmune conditions, diabetes mellitus, and white blood cell count >11,000/μl; (c) were recipients of an organ transplant; or (d) were taking immunosuppressive therapies or chemotherapy or had major surgery or blood transfusions within the previous 2 months.
Testing involved a 2-day process. On day 1, patients underwent exercise stress testing with a modified Bruce protocol, and blood samples for gene expression testing were taken at 3 time points: baseline (before exercise), peak exercise during stress testing (defined by 85% of maximal predicted heart rate), and recovery (within 30 to 60 minutes after completion of the stress test). Electrocardiogram (ECG), systolic and diastolic blood pressures, and heart rate were obtained at each time points. The presence or absence of ischemic electrocardigraphic response to exercise was determined according to the standard stress testing criteria. On day 2, a final blood sample was taken for repeat gene expression testing and ECG, blood pressure, and heart rate measurements.
For each blood sample, 2.5 cm 3 of blood was drawn into PAXgene Blood RNA tubes and shipped to the Clinical Laboratory Improvements Amendments–certified laboratory #05D1083624 (CardioDx Inc., Redwood City, California) for gene expression testing during which RNA was extracted, reverse transcribed, and quantified by real-time polymerase chain reaction. Gene expression testing was quantified using the Corus CAD (CardioDx, Inc.). Using an algorithm that combines gender-specific gene expression components and age functions, the assay results were converted into a raw score (the primary metric used in the end point analyses of this study). For clinical reporting purposes, the raw score is converted into a transformed gene expression score (GES) on a scale of 1 to 40, as previously described. Higher GES are associated with higher likelihood of obstructive CAD (defined as ≥50% coronary artery stenosis per previous clinical validation studies). Changes in GES relative to baseline were measured at peak exercise, during recovery, and the day after the exercise test. Exercise treadmill testing was conducted in the Division of Cardiovascular Diseases at Mayo Clinic in Jacksonville, Florida. All subjects in the final study sample consented to participate in the trial in accordance with the Mayo Clinic Institutional Review Board policy.
Descriptive statistics were generated for baseline demographics, clinical characteristics, and clinical test measures. Calculations using linear models, with the inclusion of CAD status as a potential cofounder, were used to estimate effects of the association between exercise and mean change in GES. Separate models were performed for each time point of testing (peak exercise, recovery, and delayed). Additional models evaluated GES changes at peak exercise as a function of CAD status and an additional covariate: baseline blood pressure, baseline heart rate, rate pressure product, and exercise capacity. A linear model was used to evaluate the association between changes in gene expression and the degree of electrocardigraphic ischemia. Linear models were also used to test the association between peak exercise and changes in expression of individual genes. All statistical analyses were performed using R software, version 3.01, Vienna, Austria.
The primary study end points were mean changes in GES from baseline to peak exercise, recovery (30 to 60 minutes after exercise), and the delayed sample (24 to 36 hours after exercise). Changes in GES were evaluated for the study population overall and for male and female study groups separately. The contributions of several clinical variables to changes in GES were also evaluated, including CAD status, baseline heart rate and blood pressure, rate pressure product, and exercise capacity. Secondary study end points were changes in expression levels of the individual genes evaluated by the GES algorithm, comparing levels at peak exercise and baseline. Changes were measured for 21 of the 23 genes, omitting 2 that are used strictly for normalization. Gene expression levels were measured by detection cut-points during real-time polymerase chain reaction analysis. Changes in gene expression were also evaluated for each functional component of the GES algorithm.
Results
Tables 1 and 2 reflect coronary angiogram data and baseline GES for men and women. As previously reported, baseline-transformed GES were higher for subjects with obstructive CAD (mean GES 20.8, SD = 7) than no/minimal CAD (mean GES 12.6, SD = 10) and were higher for men than women irrespective of CAD. Average baseline-transformed GES for men with no/minimal CAD and obstructive CAD were 21.6 (SD = 3.6) and 26.2 (SD = 4.1) and for women were 3.6 (SD = 3.2) and 15.4 (SD = 6.5).
| SEX/Age | % |
|---|---|
| F 47 | >50% |
| F 50 | 0% |
| F 52 | <15% |
| F 58 | <15% |
| F 59 | <15 |
| F 60 | >50% |
| F 61 | 0% |
| F 67 | >75% |
| F 69 | >50% |
| F 74 | >50% |
| M 46 | 0% |
| M 56 | 0% |
| M 56 | <20% |
| M 58 | >50% |
| M 62 | <20% |
| M 63 | 90% |
| M 63 | 90% |
| M 63 | >50% |
| M 65 | >50% |
| M 66 | 0% |
| Group | N | Acute (during testing) | Recovery (30-60 minutes post-testing) | Delayed (24-36 hours post-testing) |
|---|---|---|---|---|
| Overall CAD status | 20 | 0.29** (0.22, 0.36) 0.12 (-0.02, 0.27) | -0.01 (-0.09, 0.07) -0.04 (-0.19, 0.12) | -0.06 (-0.17, 0.05) 0.14 (-0.07, 0.36) |
| Female CAD status | 10 | 0.34** (0.22, 0.46) 0.04 (-0.20, 0.28) | -0.01 (-0.14, 0.12) -0.19 (-0.43, 0.06) | -0.07 (-0.22, 0.09) -0.02 (-0.33, 0.29) |
| Male CAD status | 10 | 0.25** (0.15, 0.34) 0.21 (0.02, 0.40) | -0.02 (-0.12, 0.09) 0.14 (-0.10, 0.33) | -0.06 (-0.22, 0.11) 0.31 (-0.03, 0.64) |
∗ Results of linear models evaluating the impact of exercise on gene expression at three time points of testing (acute, recovery, delayed), adjusting for CAD status. The upper entry in each cell is the adjusted mean change in GES relative to baseline (mean, 95% confidence interval). The lower entry is the estimated difference in mean GES change, comparing patients with obstructive CAD vs. patients with minimal CAD. All analyses were performed using GES raw scores.
There was a statistically significant increase in GES from “baseline to peak exercise” overall and when adjusted for CAD status and gender ( Table 2 , Figure 1 ). The adjusted mean increase in GES from “baseline to peak exercise” was 0.29 (95% confidence interval 0.22 to 0.36; p <0.001) for the entire study population, corresponding to a 3-point increase on the transformed GES scale (range 1 to 40).
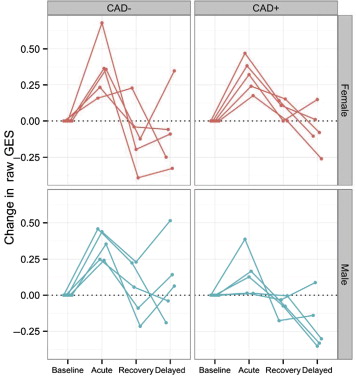
Adjusted mean GES at both time points after exercise (30 to 60 minutes and 24 to 36 hours) were not significantly different from baseline levels. There was no association between severity of CAD status and overall statistically significant changes in mean GES at any time point.
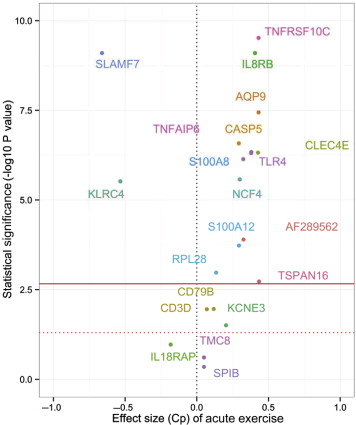
Changes in individual gene expression levels at peak exercise from baseline are represented in Figure 2 against nominal (unadjusted) p values. Statistically significant changes (Bonferroni-Dunn adjusted p values <0.05) were observed for 15 of 23 genes that comprise the GES algorithm ( Figure 2 , Table 3 ). Significant upregulation was observed for 2 genes, SLAMF7 and KLRC4, and downregulation was observed for 13 genes. Component NKUP showed significant upregulation during exercise, and components NDOWN, NEUT, and SCA1 showed significant downregulation.
Stay updated, free articles. Join our Telegram channel

Full access? Get Clinical Tree


