Although an association has been reported between the microvascular complications of diabetic patients and their poor prognosis after cardiovascular events related to advanced atherosclerosis, it is not clear whether there is a relation between diabetic retinopathy (DR) and the severity of plaque vulnerability. Fifty-seven diabetic patients with coronary artery disease, classified as non-DR (n = 42) or DR (n = 15), underwent angioscopic observation of at least 1 entire coronary artery. The number of yellow plaques (NYP) through the observed coronary artery was counted and their color grades, defined as 1 (light yellow), 2 (yellow), or 3 (intense yellow), were evaluated. The NYP per vessel and the maximum yellow grade were determined. The association between the presence of DR and incidences of acute coronary syndrome (ACS) was analyzed during the follow-up period (mean 7.1 ± 3.3 years; range, 0.83 to 11.75 years). Mean NYP per vessel and maximum yellow grade were significantly greater in DR than in non-DR patients (2.08 ± 1.01 vs 1.26 ± 0.77, p = 0.002, and 2.40 ± 0.74 vs 1.90 ± 0.82, p = 0.044, respectively). The cumulative incidences of ACS were higher in the DR group (p = 0.004), and the age-adjusted hazard ratio for ACS was 6.943 (95% CI 1.267 to 38.054; p = 0.026) for DR compared with non-DR patients. Our findings indicate that coronary atherosclerosis and plaque vulnerability are more severe in patients with DR. DR as a microvascular complication may be directly linked with macrovascular plaque vulnerability and fatal cardiovascular events such as ACS.
Diabetes mellitus (DM) is a metabolic disease characterized by hyperglycemia arising from abnormal insulin secretion from the pancreas and/or a deficiency in insulin activity. DM causes dysfunction, damage, or failure of various organs, including the eye, kidney, nerve, heart, and blood vessels and is associated with an increased mortality resulting from vascular complications. In addition, some investigations using coronary imaging modalities have already elucidated the specific features of advanced coronary atherosclerosis in diabetic patients. Nevertheless, there are few data showing a direct link between microvascular and macrovascular complications such as diabetic retinopathy (DR) and the severity of coronary atherosclerosis leading to an acute coronary syndrome (ACS). Coronary angioscopy is a robust imaging tool that can be used to evaluate the characteristics of atherosclerotic plaques in vivo. Angioscopic yellow plaques are commonly identified at the culprit lesion of an ACS. In addition, a prospective study revealed that the presence of multiple yellow plaques per vessel (≥2) is associated with future cardiovascular events such as ACS. Therefore, angioscopic yellow plaques are considered to be vulnerable. We designed a retrospective cohort study with a 10-year follow-up to confirm the relation between the presence of DR, the degree of angioscopic plaque vulnerability, and cardiovascular events.
Methods
Our institution has maintained a database of angioscopic analyses since we first introduced this imaging method. Using this systematic database, we evaluated all 57 coronary artery disease (CAD) patients with DM who underwent angioscopic examination from April 2001 to December 2007. Patients provided informed consent to participate after receiving a full explanation of the study’s purpose, nature, and risks. Patients with coronary arteries who were not anatomically suitable for angioscopy (e.g., ostial stenotic, proximally tortuous, or severely calcified) were excluded.
Patients were diagnosed with stable CAD if they had a positive stress test for myocardial ischemia and no change in the frequency, duration, or intensity of clinical symptoms within 4 weeks, including various combinations of chest, upper extremity, jaw, or epigastric discomfort, or atypical symptoms (e.g., dyspnea or diaphoresis). ACS was defined as the occurrence of ischemic chest discomfort at rest with electrocardiographic changes specific to myocardial ischemia. Patients with an elevated cardiac troponin T level (>0.01 ng/ml) on admission or at 6 to 8 hours after admission were diagnosed with acute myocardial infarction. If no cardiac troponin T elevation was noted, they were diagnosed with unstable angina.
DM was defined as a fasting plasma glucose concentration of ≥126 mg/dl, self-reported clinician-diagnosed diabetes, or a glycated hemoglobin (HbA1c) level of ≥6.5% (National Glycohemoglobin Standardization Program). The value of HbA1c (Japan Diabetes Society +0.4%) was estimated as a National Glycohemoglobin Standardization Program equivalent value calculated using the appropriate formula. DR was diagnosed by a specialist in ophthalmology, using direct ophthalmoscopy through dilated pupils or fundus uorescein angiography, as needed. Retinal findings were classified into 3 categories according to the status of the worse eye: no retinopathic changes, background retinopathy (microaneurysms, microinfarcts, hard exudates, or hemorrhages), and proliferative retinopathy (neovascularization or previous laser coagulation therapy).
Hyperlipidemia was defined as medication-dependent or previously known hyperlipidemia, fasting serum low-density lipoprotein cholesterol ≥140 mg/dl, or fasting serum total cholesterol ≥220 mg/dl.
The coronary angiograms were analyzed with a computer-assisted, automated, edge-detection algorithm (CMS; MEDIS, Nuenen, the Netherlands) using standard quantitative coronary angiography measurements by an expert angiographer who was blinded to the clinical and angioscopic findings The number of stenosed vessels with >50% luminal narrowing in the main coronary arteries was recorded (1- to 3-vessel disease). Abnormal findings were defined as haziness, wall irregularity, or filling defects.
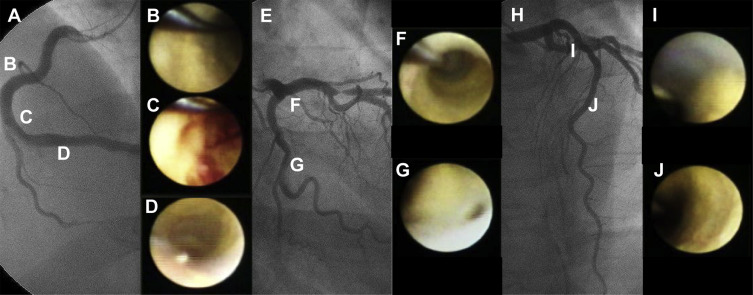
The coronary angioscopic procedure has been reported previously. Before observation, the white balance was adjusted for color correction. The light power was adjusted to avoid reflection and to obtain images with adequate brightness for determination of the plaque color. During angioscopic observations, an assistant adjusted the light power to maintain a constant brightness level on the target plaque. Angioscopic images and fluoroscopy during the angioscopic observations were recorded simultaneously on videotape for later analysis. The yellow grade was classified semiquantitatively according to the surface color: 0, white; 1, light yellow; 2, yellow; or 3, intense yellow. The number of yellow plaques (NYP) was determined for each vessel observed and averaged per vessel. The maximum yellow grade (MYG) was defined as the deepest yellow grade in all the coronary arteries observed in an individual patient. A ruptured plaque was considered to be a wall irregularity, including a tear, flap, or ulceration on the plaque surface. A thrombus was defined as a coalescent red superficial or protruding mass adhering to the vessel surface but clearly a separate structure that remained after flushing with Ringer’s lactate. The angioscopic images were evaluated by an investigator who was blinded to the patients’ clinical characteristics. In a previous study performed in our institution, the intraobserver agreements for thrombus, yellow plaque, and complex plaque were 95%, 100%, and 95%, respectively, and the interobserver agreements were 95%, 98%, and 93%, respectively. The κ values for the intraobserver and interobserver agreements of those items were 0.93, 1.00, and 0.88, respectively, and 0.93, 0.95, and 0.84, respectively. A representative case is shown in Figure 1 .
We followed all patients for de novo ACS events until January 2013. Follow-up data were obtained from medical records and telephone contact. The medical ethics committee at Nippon Medical School, Chiba-Hokusoh Hospital, approved this study protocol (no. 482), and written informed consent was obtained from all patients before the catheterization procedures.
Continuous quantitative data were presented as mean value ± SD. All variables were evaluated using the Student t test. Categorical variables were presented as frequencies and were compared using the Pearson’s chi-square test. Kaplan–Meier survival curves for subjects with DR or non-DR were plotted for incidences of ACS. Differences between the curves were tested by the log-rank test. Cox proportional hazards regression models were used to estimate hazard ratios (HRs) and 95% CIs for incidences of ACS. HRs were adjusted for age. All differences were evaluated at the 95% level of significance (p <0.05). All statistical analyses were performed using IBM SPSS version 21 (IBM Japan, Tokyo, Japan).
Results
The clinical characteristics of the 57 patients are summarized in Table 1 . There were 42 patients (74%) without DR (non-DR group) and 15 patients (26%) with DR (DR group). Eight patients (14%) were receiving insulin, 36 (63%) oral hypoglycemic agents, and the other 18 patients (32%) diet therapy alone. In the DR group, 10 patients (67%) had background retinopathy and 5 (33%) had proliferative retinopathy.
| Variable | Retinopathy | p Value | |
|---|---|---|---|
| Absent (n = 42) | Present (n = 15) | ||
| Age (years) | 64.9 ± 10.7 | 64.7 ± 10.2 | 0.935 |
| Male | 35 (83%) | 12 (80%) | 0.713 |
| Hypertension | 31 (74%) | 12 (80%) | 0.739 |
| Hyperlipidemia | 34 (81%) | 12 (80%) | 1.000 |
| Hyperuricemia | 8 (19%) | 2 (13%) | 1.000 |
| Current smoker | 20 (48%) | 4 (27%) | 0.223 |
| Duration of diabetes (years) | 6.1 ± 7.7 | 10.2 ± 9.3 | 0.102 |
| Prior myocardial infarction | 6 (14%) | 3 (20%) | 0.415 |
| Clinical presentation | |||
| Acute coronary syndrome | 17 (40%) | 9 (60%) | 0.236 |
| Acute myocardial infarction | 8 (19%) | 6 (40%) | 0.161 |
| Unstable angina pectoris | 9 (21%) | 3 (20%) | 1.000 |
| Stable coronary artery disease | 25 (60%) | 6 (40%) | |
| Medication | |||
| Statin | 27 (64%) | 9 (60%) | 0.766 |
| Angiotensin-converting enzyme inhibitor | 14 (33%) | 5 (33%) | 1.000 |
| Angiotensin receptor blocker | 17 (40%) | 5 (33%) | 0.761 |
| Beta-blocker | 18 (43%) | 6 (40%) | 1.000 |
| Calcium channel blocker | 19 (45%) | 5 (33%) | 0.547 |
| Dual antiplatelet therapy | 34 (81%) | 15 (100%) | 0.095 |
| Insulin | 1 (2%) | 7 (47%) | <0.001 |
| Oral hypoglycemic agent | |||
| Sulfonylurea | 18 (43%) | 6 (40%) | 1.000 |
| Alpha-glucosidase inhibitor | 18 (43%) | 4 (27%) | 0.360 |
| Biguanide | 2 (5%) | 0 (0%) | 1.000 |
| Thiazolidine | 3 (7%) | 3 (20%) | 0.180 |
| Glinide | 1 (2%) | 1 (7%) | 0.461 |
| Laboratory data | |||
| Total cholesterol (mg/dL) | 180.0 ± 25.2 | 182.1 ± 38.3 | 0.865 |
| Low-density lipoprotein cholesterol (mg/dL) | 109.4 ± 25.7 | 111.6 ± 28.3 | 0.791 |
| High-density lipoprotein cholesterol (mg/dL) | 43.0 ± 10.9 | 46.8 ± 15.4 | 0.300 |
| Triglycerides (mg/dL) | 140.0 ± 66.5 | 119.4 ± 61.7 | 0.300 |
| C-reactive protein (mg/dL) | 0.26 ± 0.26 | 0.28 ± 0.28 | 0.816 |
| Fasting plasma glucose (mg/dL) | 128.8 ± 26.4 | 140.7 ± 49.0 | 0.247 |
| Glycated hemoglobin (%) | 7.2 ± 1.1 | 7.6 ± 1.1 | 0.219 |
Baseline characteristics did not differ between the groups, except for insulin therapy, which was more prevalent in the DR than in the non-DR group (p <0.001). The mean duration of DM did not significantly differ between the 2 groups (p = 0.102). Mean levels of fasting plasma glucose and HbA1c were also similar between the 2 groups (p = 0.247, p = 0.219, respectively). Statins were prescribed almost equally, in 64% of patients in the non-DR and 60% in the DR group (p = 0.766). Levels of low-density lipoprotein cholesterol were also similar between the 2 groups (p = 0.791).
The angioscopic findings are listed in Table 2 . The distributions of observed coronary arteries were similar between the 2 groups. Total NYP and yellow intensity were higher in DR than in non-DR patients (p <0.001 and p = 0.004, respectively). No significant differences were observed in the frequency of plaque rupture or thrombus (p = 0.188, p = 0.066, respectively). The average NYP per vessel and the MYG are shown in Figure 2 . These values were higher in DR than in non-DR patients (2.08 ± 1.01 vs 1.26 ± 0.77, p = 0.002; and 2.40 ± 0.74 vs 1.90 ± 0.82, p = 0.044, respectively).
| Variable | Retinopathy | p Value | |
|---|---|---|---|
| Absent (n = 42) | Present (n = 15) | ||
| Angiographic findings | |||
| Severity findings | |||
| 1-vessel disease | 13 (31%) | 2 (13%) | 0.409 |
| 2-vessel disease | 14 (33%) | 6 (40%) | |
| 3-vessel disease | 15 (36%) | 7 (47%) | |
| Abnormal findings | 5 (12%) | 4 (27%) | 0.223 |
| Angioscopic findings | |||
| Observed coronary artey | |||
| Left anterior descending | 30 (71%) | 13 (87%) | 0.312 |
| Left circumflex | 20 (48%) | 5 (33%) | 0.381 |
| Right | 18 (43%) | 5 (33%) | 0.558 |
| Total No. of yellow plaques | 90 | 52 | |
| Coronary distribution of yellow plaques | |||
| Left anterior descending | 38 (42%) | 28 (54%) | 0.395 |
| Left circumflex | 20 (22%) | 10 (19%) | |
| Right | 32 (36%) | 14 (27%) | |
| Yellow grade | |||
| Grade 1 (light yellow) | 35 (39%) | 11 (21%) | 0.004 |
| Grade 2 (yellow) | 44 (49%) | 24 (46%) | |
| Grade 3 (intense yellow) | 11 (12%) | 17 (33%) | |
| Rupture | 4 (10%) | 4 (27%) | 0.188 |
| Thrombus | 13 (31%) | 9 (60%) | 0.066 |
Stay updated, free articles. Join our Telegram channel

Full access? Get Clinical Tree


