Several clinical variables have been identified as predictors of clinical outcome after transcatheter aortic valve implantation (TAVI). Nonetheless, there is limited and contradictive data on the impact of diabetes mellitus (DM) on the prognosis of patients who undergo TAVI. We aimed to investigate the clinical characteristics and the early and midterm outcomes after TAVI according to DM status. From 802 consecutive patients who underwent TAVI, we compared 548 patients with no DM to 254 patients with diabetes (177 orally treated and 77 insulin treated). Patients with DM were younger had higher body mass index and incidence of coronary artery disease and lower incidence of frailty. Device success, 30-day mortality and major complications rates were similar between groups. One-year mortality was 12.1% for patient with DM and 12.2% for patients without DM (p = 0.91). In a multivariable regression analysis including age, body mass index, coronary artery disease and frailty, DM was associated with decreased overall survival. This was driven by increased overall mortality of the insulin-treated DM subgroup (hazard ratio 2.40, 95% CI 1.32 to 4.37; p <0.01). In conclusion, DM does not affect short-term mortality or rates of complications after TAVI. Insulin-treated DM, but not orally treated DM, is independently associated with death at midterm follow-up and therefore aggressive cardiovascular risk factor modification as well as intense glycemic control should be considered for patients with insulin-treated DM with severe aortic stenosis who undergo TAVI.
Diabetes mellitus (DM) adversely affects morbidity and mortality for cardiovascular diseases and procedures. DM has been independently associated with increased morbidity and mortality after surgical aortic valve replacement. Transcatheter aortic valve implantation (TAVI) has emerged as a treatment option for inoperable or high-risk surgical patients with severe aortic stenosis (AS). There are limited and contradictive data on the impact of DM on the prognosis of patients with severe AS who undergo TAVI. Surprisingly, in a recent substudy of the PARTNER (Placement of Aortic Transcatheter Valves) trial, 1-year mortality was significantly higher in patients without DM compared to patients with diabetes although multivariate analysis was not performed. The purpose of this study was to evaluate the clinical characteristics and the early and midterm clinical outcomes after TAVI according to DM status.
Methods
We examined consecutive patients at high risk with severe symptomatic AS who underwent TAVI during a 3-year period at our institute. All patients had congestive heart failure with New York Heart Association class II to IV symptoms. Aortic valve disease was assessed initially with transthoracic echocardiography followed by an electrocardiogram-gated, multislice computed tomography (CT) angiography study. Decision for TAVI sizing was made by the heart team using data from all available imaging methods at the time of the procedure including immediate preprocedural 3-dimensional transesophageal echocardiography. TAVI was performed under general anesthesia in all cases. All patients were worked up for “transfemoral first” approach; and alternate access was used in patients ineligible for transfemoral approach. Patients were divided into 3 groups according to their DM status and kind of treatment: patients without DM, patients with orally treated DM, and patients with insulin-treated DM. The study was approved by the Institutional Review Board at the Cedars-Sinai Medical Center.
Baseline clinical, echocardiographic, and procedural details for TAVI were recorded for all patients including 1 month clinical and echocardiographic assessments during a follow-up visit. We compared patients without diabetes to patients with orally and insulin-treated DM. Early outcomes were defined as 30-day mortality and complications rate. Midterm outcomes were defined as 1-year mortality and overall mortality (mortality during the study period). TAVI end points, device success, and adverse events were considered according to the Valve Academic Research consortium (VARC)-2 definitions.
All data were summarized and displayed as mean ± SD for continuous variables and as number (percentage) of patients in each group for categorical variables. The Student t test and Pearson chi-square tests were used to evaluate statistical significance between continuous and categorical variables, respectively. Cox multivariate regression analysis was performed to identify independent variables that correlate to overall mortality in patients with and without DM. The multivariate model was built by selecting baseline and procedural variables that satisfied the entry criterion of p <0.05 for a difference between patients with and without DM in a univariate analysis: patient age, body mass index (BMI), coronary artery disease (CAD), mean aortic valve gradients, and frailty. A similar model was built to compare overall mortality between patients with no DM versus orally treated DM versus insulin-treated DM. For this model, additional variables that were different between insulin-treated DM patients and patients without DM were included: chronic renal failure and ejection fraction. Another model was used to assess predictors of overall mortality for the entire cohort. For this model, we performed a Cox regression analysis including all variables that were found to influence overall mortality among the entire study participants (with an entry criterion of p <0.2). All the analyses were considered significant at a 2-tailed p value of <0.05. The SPSS statistical package, version 20.0, was used to perform all statistical evaluation (SSPS Inc., Chicago, Illinois).
Results
From January 2012 to January 2015, 802 consecutive patients underwent TAVI at our institute. From this cohort, 548 patients had no DM (68.3%), 177 had orally treated DM (22.1%), and 77 had insulin-treated DM (9.6%). The mean age of the patients was 82.0 ± 8.5. The baseline clinical, echocardiographic, and CT characteristics of the study population are presented in Table 1 . Several baseline characteristics were not similar between groups. Patients with DM were younger and had higher BMI compared to patients without DM. CAD was significantly more prevalent and frailty was significantly less prevalent in patients with DM.
| Variable | Diabetes Mellitus | p-value (DM vs. no DM) | ||
|---|---|---|---|---|
| No (n=548) | Orally treated (n=177) | Insulin treated (n=77) | ||
| Age (years) | 82.9 ± 8.8 | 81.2 ± 7.9 | 77.2±8.7 | <0.001 |
| Male | 326 (59.5%) | 108 (61.0%) | 48 (62.3%) | 0.60 |
| Body mass index (kg/m 2 ) | 25.8 ± 5.0 | 28.2 ± 6.4 | 30.8 ± 7.5 | <0.001 |
| Hypertension | 496 (90.5%) | 164 (92.7%) | 72 (93.5%) | 0.26 |
| Coronary artery disease | 337 (61.5%) | 121 (68.4%) | 59 (76.6%) | 0.01 |
| Previous myocardial infarction | 86 (15.7%) | 29 (16.4%) | 15 (19.5%) | 0.56 |
| Previous coronary artery bypass graft | 134 (24.5%) | 49 (27.7%) | 26 (33.8%) | 0.13 |
| Previous valve surgery | 44 (8.0%) | 15 (8.5%) | 8 (10.4%) | 0.63 |
| Peripheral artery disease | 201 (36.7%) | 59 (33.3%) | 24 (31.2%) | 0.27 |
| Previous Stroke | 67 (12.2%) | 22 (12.4%) | 14 (18.2%) | 0.44 |
| Chronic lung disease | 203 (37.0%) | 63 (35.6%) | 34 (44.2%) | 0.76 |
| Chronic renal failure ∗ | 104 (19.0%) | 30 (16.9%) | 7 (9.1%) | 0.13 † |
| Previous pacemaker | 106 (19.3%) | 42 (23.7%) | 18 (23.4%) | 0.31 |
| Atrial fibrillation | 187 (34.1%) | 55 (31.1%) | 27 (35.1%) | 0.69 |
| Frailty | 206 (37.6%) | 56 (31.6%) | 15 (19.5%) | 0.008 |
| Society of Thoracic Surgeons score, (%) | 7.9 ± 4.9 | 8.4 ± 5.4 | 8.8 ± 4.8 | 0.10 |
| EuroScore II (%) | 10.7 ± 7.4 | 8.9 ± 6.4 | 11.8 ± 8.4 | 0.35 |
| Ejection fraction (%) | 57.2 ± 14.5 | 58.1 ± 14.5 | 51.9 ± 17.2 | 0.42 † |
| Aortic valve area (cm 2 ) | 0.63 ± 0.15 | 0.65 ± 0.17 | 0.64 ± 0.18 | 0.10 |
| Aortic valve mean gradient (mmHG) | 46.2 ± 13.3 | 45.2± 13.3 | 41.6± 14.7 | 0.04 |
| Aortic valve maximal gradient (mmHG) | 77.4 ± 20.6 | 75.5 ± 21.8 | 71.1 ± 23.5 | 0.04 |
| CT mean annulus diameter (mm) | 24.3 ± 2.7 | 24.2 ± 2.6 | 24.3 ± 2.8 | 0.74 |
| CT mean AV Agatston calcification score (AU) ‡ | 3672 ± 2144 | 3576 ± 2237 | 3085 ± 1886 | 0.24 |
∗ Glomerular filtration rate <30 ml/min/m 2 .
† p Value <0.05 for patients with insulin-treated DM versus patients without DM.
Procedural details are presented in Table 2 . There were no significant differences in valve size, valve type, or vascular access used between groups. Device success was 96.0% versus 93.7% in the no DM versus the DM group, respectively (p = 0.16). Fluoroscopy time was similar between groups, but total amount of contrast used was higher in patients with DM (mean: 93.8 ml vs 85.6 ml; p = 0.03). Postprocedural transesophageal echocardiography perivalvular leak grades and postprocedural aortic valve gradients were not different between groups.
| Diabetes Mellitus | p-value ∗ | |||
|---|---|---|---|---|
| No (n = 548) | Orally treated (n = 177) | Insulin treated (n = 77) | ||
| Implanted valve size (mm): | ||||
| 23 | 157 (28.7%) | 55 (31.1%) | 19 (24.7%) | 0.20 |
| 26 | 259 (47.3%) | 71 (40.1%) | 30 (39%) | |
| 29 | 120 (21.9%) | 46 (26%) | 25 (32.5%) | |
| 31 | 12 (2.2%) | 5 (2.8%) | 3 (3.9%) | |
| Implanted valve type: | ||||
| Sapien † | 143 (26.1%) | 46 (26.0%) | 17 (22.1%) | 0.47 |
| Sapien-XT † | 236 (43.1%) | 71 (40.1%) | 41 (53.2%) | |
| Sapien 3 † | 127 (23.2%) | 42 (23.7%) | 10 (13.0%) | |
| Corevalve ‡ | 42 (7.7%) | 18 (10.2%) | 9 (11.7%) | |
| Vascular access: | ||||
| Transfemoral | 469 (85.6%) | 154 (87%) | 69 (89.6%) | 0.37 |
| Transapical | 30 (5.5%) | 10 (5.6%) | 1 (1.3%) | |
| Transaortic | 41 (7.5%) | 13 (7.3%) | 7 (9.1%) | |
| Subclavian | 8 (1.5%) | 0 | 0 | |
| Device success | 526 (96.0%) | 165 (93.2%) | 73 (94.8%) | 0.16 |
| 2 nd valve | 19 (3.5%) | 8 (4.5%) | 4 (5.2%) | 0.39 |
| Postdilatation | 55 (10.0%) | 24 (13.6%) | 8 (10.4%) | 0.28 |
| Valve embolization | 3 (0.5%) | 2 (1.1%) | 1 (1.3%) | 0.39 |
| Fluoroscopy time (min.) | 16.7 ± 8.4 | 17.0 ± 10.3 | 15.5 ± 6.1 | 0.74 |
| Total contrast used (ml) | 85.6 ± 43.2 | 92.7 ± 42.1 | 96.3 ± 52.2 | 0.03 |
| TEE Postprocedural PVL: | ||||
| None/trace | 394 (71.9%) | 130 (73.4%) | 66 (85.7%) | 0.43 |
| Mild | 136 (24.8%) | 41 (23.2%) | 10 (13.0%) | |
| Moderate/severe | 18 (3.3%) | 6 (3.4%) | 1 (1.3%) | |
| Postprocedural AV gradient (mmHG) | 5.8 ± 5.2 | 5.7 ± 4.9 | 4.7 ± 4.7 | 0.32 |
∗ p value for patients with no DM versus patients with DM.
† Edwards Lifesciences, Irvine, California.
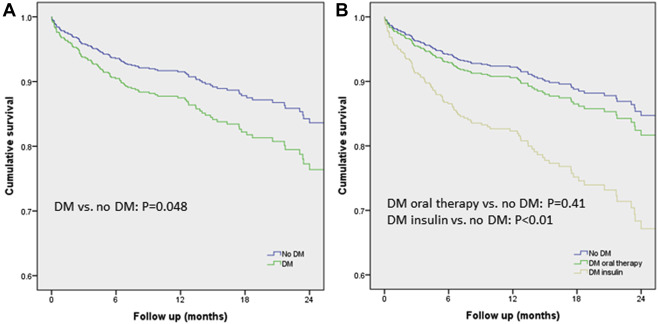
The mean follow-up period was 13.2 ± 8.3 months. All-cause mortality up to 30 days was 2.8% versus 2.9% in patients with and without DM, respectively (p = 0.90). Thirty-day VARC-2 end points are summarized in Table 3 . There were no significant differences in all VARC-2 defined end points between the 3 groups. One-year mortality was 12.1% for patient with DM and 12.2% for patients without DM (p = 0.91). When comparing patients with DM (both insulin and orally treated) to patients without DM in a multivariate model, DM was independently associated with increased mortality (hazard ratio [HR] 1.51, 95% CI 1.004 to 2.26; p = 0.048; Figure 1 ). When the multivariate model included all 3 groups separately ( Figure 1 ), insulin-treated DM was independently associated with increased mortality (HR 2.40, 95% CI 1.32 to 4.37; p <0.01), and orally treated DM was not associated with increased mortality (HR 1.22, 95% CI 0.76 to 1.96; p = 0.41). Frailty (HR 2.2, 95% CI 1.47 to 3.34; p <0.001) and chronic renal failure (HR 2.86, 95% CI 1.88 to 4.35; p <0.001) were also found to be independently associated with increased mortality in this model. Overall independent predictors of mortality for the entire cohort included insulin-treated DM, chronic lung disease, chronic renal failure, frailty, and alternative access ( Table 4 ).
| Diabetes Mellitus | p-value ∗ | |||
|---|---|---|---|---|
| No (n = 548) | Orally treated (n = 177) | Insulin treated (n = 77) | ||
| Mortality | 16 (2.9%) | 5 (2.8%) | 2 (2.6%) | 0.90 |
| Cerebrovascular accident / transient ischemic attack | 15 (2.7%) | 3 (1.7%) | 2 (2.6%) | 0.52 |
| Myocardial infarction | 3 (0.5%) | 0 (0%) | 1 (1.3%) | 1 |
| Respiratory failure | 19 (3.5%) | 3 (1.7%) | 3 (3.9%) | 0.40 |
| Cardiogenic shock | 9 (1.6%) | 4 (2.3%) | 2 (2.6%) | 0.48 |
| Cardiac tamponade | 3 (0.5%) | 1 (0.6%) | 0 (0%) | 1 |
| Major bleeding | 23 (4.2%) | 6 (3.4%) | 3 (3.9%) | 0.66 |
| Major vascular complications | 16 (2.9%) | 5 (2.8%) | 2 (2.6%) | 0.90 |
| Minor vascular complications | 53 (9.7%) | 14 (7.9%) | 4 (5.2%) | 0.23 |
| New permanent pacemaker implantation | 54 (12.1%) | 15 (10.9%) | 7 (11.5%) | 0.70 |
| Acute kidney injury stage 3 | 8 (1.5%) | 4 (2.3%) | 1 (1.3%) | 0.56 |
| New York Heart Association functional class | 1.75 ± 0.7 | 1.64 ± 0.6 | 1.76 ± 0.8 | 0.25 |
| Variable | Univariate analysis | Multivariate analysis | ||||
|---|---|---|---|---|---|---|
| Hazard Ratio | Confidence Interval | p-value | Hazard Ratio | Confidence Interval | p-value | |
| Age (years) | 1.03 | 1.00-1.05 | 0.04 | 1.02 | 0.99-1.04 | 0.31 |
| Body mass index (kg/m 2 ) | 0.96 | 0.93-99 | 0.03 | 1.00 | 0.96-1.04 | 1 |
| DM: | ||||||
| Orally treated | 1.13 | 0.77-1.78 | 0.59 | 1.21 | 0.75-1.98 | 0.42 |
| Insulin treated | 1.70 | 0.98-2.9 | 0.06 | 2.31 | 1.25-4.27 | 0.01 |
| Chronic lung disease | 1.46 | 1.02-2.11 | 0.05 | 1.68 | 1.10-2.58 | 0.02 |
| Peripheral artery disease | 1.63 | 1.12-2.36 | 0.01 | 1.34 | 0.90-1.98 | 0.15 |
| Chronic renal failure ∗ | 3.27 | 2.23-4.80 | <0.001 | 2.46 | 1.52-3.99 | <0.001 |
| Previous pacemaker | 1.66 | 1.10-2.49 | 0.02 | 1.03 | 0.64-1.66 | 0.90 |
| Atrial fibrillation | 1.44 | 0.99-2.09 | 0.06 | 1.38 | 0.91-2.10 | 0.13 |
| Frailty | 2.48 | 1.71-3.61 | <0.001 | 1.99 | 1.30-3.03 | 0.001 |
| Society of Thoracic Surgeons score, (%) | 1.09 | 1.06-1.11 | <0.001 | 1.03 | 0.99-1.06 | 0.14 |
| Ejection fraction | 0.98 | 0.97-0.99 | 0.002 | 1.01 | 0.99-1.02 | 0.48 |
| Aortic valve mean gradient (mmHG) | 0.98 | 0.97-0.99 | 0.005 | 0.99 | 0.98-1.00 | 0.08 |
| Valve type: | ||||||
| Sapien vs. XT/S3/CV | 1.58 | 1.07-2.33 | 0.02 | 1.04 | 0.68-1.59 | 0.87 |
| S3 vs. Sapien/XT/CV | 0.41 | 0.21-0.80 | 0.01 | 0.74 | 0.37-1.50 | 0.41 |
| Alternative access (transapical/ transaortic /subclavian) | 2.40 | 1.57-3.67 | <0.001 | 1.80 | 1.12-2.90 | 0.02 |
Stay updated, free articles. Join our Telegram channel

Full access? Get Clinical Tree


