Several clinical and procedural factors have been identified as predictors of early and midterm events after transcatheter aortic valve implantation (TAVI), but incidence and prognostic impact of diabetes mellitus (DM), especially insulin treated, on short- and midterm outcomes remain to be defined. All consecutive patients who underwent TAVI at our institutions were enrolled and stratified according to DM status. All-cause mortality at 30 days or in hospital and at follow-up was the primary end point, whereas periprocedural complications, rates of myocardial infarction, stroke, and reintervention at follow-up were the secondary ones. All end points were adjudicated according to the Valve Academic Research Consortium definitions. In all, 511 patients were enrolled: 361 without DM, 78 with orally treated DM, and 72 with insulin-treated DM. Orally treated DM patients were more frequently women, whereas insulin-treated DM patients were younger. Thirty-day Valve Academic Research Consortium mortality was not significantly higher in patients with orally treated DM and insulin-treated DM compared with patients without diabetes (6.4%, 9.7%, and 4.7%, p = 0.09). Bleedings, vascular complications, postprocedural acute kidney injury, and periprocedural strokes were not significantly different in the 3 groups. At midterm follow-up (median 400 days), patients with insulin-treated DM had a significantly higher mortality rate (33.3% vs 18.6%, p = 0.01) and higher myocardial infarction incidence (8.3% vs 1.4%, p = 0.002) if compared with patients without diabetes. Strokes and reinterventions at follow-up were similar in the 3 groups. After multivariable adjustment, insulin-treated DM was independently correlated with death (hazard ratio 2, 95% confidence interval 1.3 to 3.3) and myocardial infarction (hazard ratio 3.73, 95% confidence interval 1.1 to 13). In conclusion, DM does not significantly affect rates of complications in patients who underwent TAVI. Insulin-treated DM, but not orally treated DM, is independently associated with death and myocardial infarction at midterm follow-up and should be included into future TAVI-dedicated scores.
Transcatheter aortic valve implantation (TAVI) has emerged as a new therapeutic option for patients with severe, symptomatic aortic stenosis (AS) ineligible for surgical aortic valve replacement or at high risk. In these inoperable patients, TAVI reduced mortality compared with conservative strategy, and in high surgical risk, patients were not inferior to surgery at 2 years of follow-up. Despite its minimally invasive nature, TAVI remains associated with several periprocedural complications, and the event rates at midterm follow-up are relevant because of co-morbidities of patients. This high burden of adverse events has increased attention toward predictors of complications and death at follow-up to focus resources and efforts on high-risk population. Several clinical and procedural factors have been identified as predictors of early and midterm events after TAVI, but few data exist about the impact of diabetes mellitus (DM) on prognosis. Moreover, a differentiation between the impact of orally and insulin-treated DM after TAVI has not been reported. The aims of this study were to evaluate the clinical characteristics and the early and midterm outcomes after TAVI according to DM status.
Methods
This is a prospective multicenter study, including all consecutive patients with severe, symptomatic AS and with complete informations on DM status, considered at prohibitive or high surgical risk, referred for TAVI from June 2007 to December 2011 at 4 Italian institutions (Ferrarotto Hospital, University of Catania; division of cardiology, department of cardiac, thoracic, and vascular sciences, University of Padova; division of cardiology, cardiovascular department, Città Della Salute e della Scienza, University of Turin; and division of cardiology, Istituto Humanitas). Patients were divided into 3 groups according to their DM status and kind of treatment: patients without DM, patients with non–insulin-treated DM, and patients with insulin-treated DM. Their baseline, procedural, follow-up features and data were prospectively recorded in dedicated registries. Data collection was approved by the ethics committee, and patient’s informed consent was always obtained. In each center, indication for TAVI was appraised by consensus of a team of cardiac surgeons, cardiologists, and anesthetists. Coronary anatomy and hemodynamic status were assessed by coronary angiography and left and, when necessary, right-sided cardiac catheterization. Valvular anatomy and annulus dimension were evaluated with transthoracic and transesophageal echocardiography, contrast angiography of the aortic root, and multislice computer tomography of the thoracic aorta. The vascular access site was assessed by color-Doppler sonography and multislice computer tomography with contrast angiography of the aortoiliofemoral system.
Transfemoral, trans-subclavian, or transapical approaches were performed according to single center experience, with implantation of Core valve (Medtronic Inc., Minneapolis, Minnesota) and Edwards SAPIEN devices (Edwards Life science, Irvine, California).
The primary end point was the rate of all-cause mortality as defined in the Valve Academic Research Consortium at 30 days and at midterm follow-up. Secondary end points were appraised both at 30 days (rates of periprocedural and spontaneous myocardial infarction, transient ischemic attack, stroke, bleedings, major vascular complications and acute kidney injury) and at midterm follow-up (rates of myocardial infarction, transient ischemic attack, stroke, prosthesis dysfunction). All the events were adjudicated following Valve Academic Research Consortium definitions. To assess all procedural and in-hospital outcomes, institutional electronic database and individual patient charts were consulted. Short-term and midterm outcomes with at least 6 months of follow-up were recorded by phone, formal query to primary physicians, and ambulatory visits.
Categorical variables were compared with the use of Fisher’s exact test. Continuous variables, presented as mean ± SD, were compared with the use of analysis of variance. For continuous variables, normality was checked with Kolmogorov-Smirnov test, and if it resulted significant, Mann-Whitney U test was performed. Survival curves for time-to-event variables were constructed with the use of Kaplan-Meier estimates on all available data at 2 years and were compared with the use of the log-rank test. To study the effect of risk factors on mortality, Cox proportional hazards regression was performed for the multivariable analyses for all-cause death and with Cox proportional hazards regression with propensity score for myocardial infarction, given the differences in follow-up and the ratio events/variables. The multivariable models included all the covariates of Table 1 with a p value <0.10 in univariate analyses. All statistical analyses were performed with the use of SPSS, version 20 (IBM Corp., Armonk, New York).
| Variable | Diabetes Mellitus | p Value | ||
|---|---|---|---|---|
| None (n = 361) | Orally Treated (n = 78) | Insulin Treated (n = 72) | ||
| Age (yrs) | 82 (81–83) | 83 (81–84) | 79 (78–81) | 0.004; p = 0.002 for NDM and OTDM vs ITDM |
| Women | 189 (52.3%) | 30 (41.7%) | 34 (47.2%) | 0.14 |
| Smokers (active or previous) | 85 (23.5%) | 8 (10.2%) | 13 (18%) | 0.07 |
| Hypertension ∗ | 324 (89.7%) | 73 (93.6%) | 69 (95.8%) | 0.07 |
| Hyperlipidemia † | 101 (27.9%) | 18 (23%) | 32 (44.4%) | 0.04; p <0.001 for NDM and OTDM vs ITDM |
| Previous myocardial infarction | 77 (21.3%) | 12 (15.4%) | 18 (25%) | 0.82 |
| Previous surgical coronary revascularization | 48 (13.3%) | 12 (15.4%) | 12 (16.6%) | 0.21 |
| Previous percutaneous coronary revascularization | 121 (33.6%) | 28 (35.9%) | 29 (40.3%) | 0.36 |
| Previous stroke | 59(16.3%) | 5 (6.4%) | 9 (12.5%) | 0.13 |
| Peripheral vascular disease | 142 (39.3%) | 35 (44.8%) | 20 (27.7%) | 0.18 |
| NYHA | ||||
| Class I | 15 (4.2%) | 2 (2.6%) | 2 (2.8%) | 0.69 |
| Class II | 73 (20.2%) | 6 (7.7%) | 17 (23.6%) | 0.02; p <0.01 for NDM and ITDM vs OTDM |
| Class III | 227 (62.9%) | 64 (82%) | 44 (61.1%) | 0.004; p <0.0001 for NDM and ITDM vs OTDM |
| Class IV | 46 (12.7%) | 6 (7.7%) | 9 (12.5%) | 0.45 |
| GFR (mL/min/1.73 m 2 ) | 51 (48–63) | 48 (42–53) | 53 (47–59) | 0.45 |
| GFR <30 | 60 (16.6%) | 18 (23.1) | 15 (20.8%) | 0.10 |
| COPD | 114 (31.6%) | 26 (33.3) | 25 (34.7%) | 0.57 |
| EF (%) | 54 (52–56) | 55 (52–58) | 52 (48–54) | 0.32 |
| EF <30% | 23 (6.3%) | 8 (10.2%) | 4 (5.5%) | 0.09 |
| Pulmonary arterial systolic pressure (mm Hg) | 43 (41–48) | 42 (40–45) | 39 (38–46) | 0.54 |
| Pulmonary arterial systolic pressure >60 mm Hg | 35 (9.7%) | 5 (6.4%) | 9 (12.5%) | 0.72 |
| Aortic valve area (cm 2 ) | 0.7 (0.5–0.9) | 0.6 (0.5–0.8) | 0.4 (0.3–0.9) | 0.08 |
| Mean aortic pressure gradient (mm Hg) | 47 (45–49) | 44 (40–49) | 44 (40–48) | 0.13 |
| Logistic Euroscore | 22 (20–23) | 22 (19–24) | 22 (19.26) | 0.11 |
| Society of Thoracic Surgeons score | 9.1 (8–10) | 12.4 (7.3–14) | 12 (10–15) | 0.002; p <0.001 for NDM vs ITDM and OTDM |
∗ Blood pressure >140/90 mm Hg or previous pharmacologic treatment.
† Total cholesterol >190 mg/dl or previous pharmacologic treatment.
Results
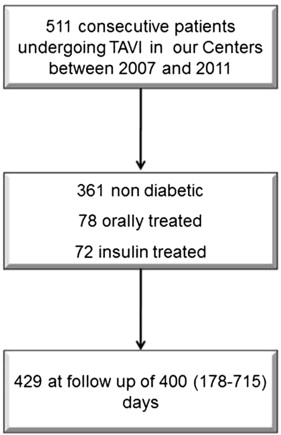
Baseline clinical and echocardiographic characteristics of the study population are summarized in Table 1 . In all, 511 patients were enrolled in our study ( Figure 1 ). Among them, 150 patients were diabetics (29.4%): 78 (52%) with orally treated DM and 72 (48%) with insulin treated DM. The 3 cohorts did not show statistically significant differences except for age and hyperlipidemia.
Thirty-day outcomes were listed in Table 2 . Patients with orally treated and insulin-treated DM demonstrated higher but NS rates of all cause and cardiovascular death. With respect to safety, rates of strokes, life-threatening bleedings, major vascular complications, and acute kidney injury did not differ among the 3 groups.
| Variable | Diabetes Mellitus | p Value | ||
|---|---|---|---|---|
| None (n = 361), n (%) | Orally Treated (n = 78), n (%) | Insulin Treated (n = 72), n (%) | ||
| Valve | 0.38 | |||
| Core valve | 190 (52.6) | 53 (67.9) | 29 (40.3) | |
| Edwards SAPIEN | 171 (47.4) | 25 (32.1) | 43 (59.7) | |
| Approach | 0.38 | |||
| Transapical | 87 (24.1) | 13 (16.7) | 19 (26.4) | |
| Transfemoral | 206 (57.1) | 46 (59) | 43 (59.7) | |
| Trans-subclavian | 68 (18.8) | 19 (24.3) | 10 (13.9) | |
| In-hospital outcomes | ||||
| Death (any cause) | 17 (4.7) | 5 (6.4) | 7 (9.7) | 0.09 |
| Cardiovascular death | 16 (4.4) | 5 (6.4) | 6 (8.3) | 0.15 |
| TIA | 2 (0.5) | 1 (1.2) | 0 | 0.81 |
| Stroke | 5 (1.4) | 1 (1.2) | 3 (4.1) | 0.1 |
| Bleeding (major and life threatening) | 158 (43.8) | 33 (42.3) | 29 (40.3) | 0.57 |
| Major vascular complication | 25 (6.9) | 3 (3.8) | 8 (11.1) | 0.42 |
| Periprocedural myocardial infarction | 3 (0.85) | 0 | 2 (2.8) | 0.25 |
| Myocardial infarction >72 h | 0 | 0 | 1 (1.4) | 0.05 |
| Acute kidney injury | 74 (20.5) | 19 (24.3) | 15 (20.1) | 0.76 |
At midterm follow-up (median 400 days, interquartile range 178 to 715), patients with insulin-treated DM had a significantly higher mortality rate and higher myocardial infarction incidence if compared with patients without diabetes at univariate analysis ( Table 3 ). The incidence of cardiovascular death, stroke, TIA, and reinterventions at follow-up was similar in the 3 groups. Figures 2 and 3 show Kaplan-Meier curves of all-cause mortality and myocardial infarction up to 2 years of follow-up. After multivariable adjustment, insulin-treated DM was independently correlated with death (hazard ratio [HR] 2, 95% confidence interval 1.3 to 3.3; Table 4 ) and myocardial infarction (HR 3.73, 95% confidence interval 1.1 to 13; Table 5 ).
| Variable | Diabetes Mellitus | |||
|---|---|---|---|---|
| None (n = 361), n (%) | Orally Treated (n = 78), n (%) | Insulin Treated (n = 72), n (%) | p Value | |
| Death | 67 (18.6) | 13 (16.6) | 24 (33.3) | 0.01 ∗ |
| Cardiovascular death | 42 (11.6) | 8 (10.2) | 11 (15.3) | 0.51 |
| Stroke | 9 (2.4) | 1 (1.3) | 4 (5.5) | 0.27 |
| Transient ischemic attack | 4 (1.1) | 0 | 1 (1.4) | 0.91 |
| Myocardial infarction | 5 (1.4) | 0 | 6 (8.3) | 0.002 ∗ |
| Reintervention | 3 (0.8) | 0 | 0 | 0.29 |
Stay updated, free articles. Join our Telegram channel

Full access? Get Clinical Tree


