Cardiac rehabilitation (CR) can reduce cardiovascular mortality and morbidity in coronary artery disease. Long coronary artery lesions may be associated with adverse outcomes after drug-eluting stent (DES) implantation. The purpose of this study was to evaluate angiographic outcomes after a comprehensive CR program in patients with DESs for long coronary artery lesions. A total of 576 patients treated with DESs for long (≥25 mm) coronary lesions were enrolled in this prospective CR registry. Comprehensive CR programs were successfully performed in 288 patients (50%). The primary end point was in-stent late luminal loss at the 9-month angiographic follow-up. There were few significant differences between the CR and non-CR groups in terms of baseline characteristics, including clinical, angiographic, and procedural variables. The rate of in-stent late luminal loss in the CR group was 35% less than in the usual care group (0.19 ± 0.33 mm in CR vs 0.29 ± 0.45 mm in non-CR, difference 0.08 mm, 95% confidence interval 0.01 to 0.16, p = 0.02) at the 9-month follow-up. After propensity-matched analysis (224 pairs), the results were consistent (0.18 ± 0.31 mm in CR vs 0.28 ± 0.41 mm in non-CR, difference 0.10 mm, 95% confidence interval 0.02 to 0.18, p = 0.02). The CR group showed a significant improvement in the overall risk profile compared with the non-CR group, including current smoking, biochemical profiles, depression, obesity, and exercise capacity. In conclusion, the comprehensive CR program significantly reduced late luminal loss after DES implantation for long coronary lesions. This may be associated with significant improvements in exercise capacity and overall risk profile.
Despite the introduction of drug-eluting stents (DESs) with strong antirestenotic and antithrombotic effects, the benefits are often attenuated in patients with long coronary artery lesions, as they are associated with greater risks of adverse clinical outcomes. Because of this, additional strategies to improve prognosis after percutaneous coronary intervention (PCI) for long coronary lesions are necessary. To date, no studies have analyzed the effects of cardiac rehabilitation (CR) on angiographic outcomes after DES implantation for native long coronary artery lesions. The purpose of this study was to determine the influence of a comprehensive CR program on angiographic outcomes in patients with DESs for long coronary artery lesions.
Methods
A total of 576 consecutively enrolled patients were treated with DESs in the Percutaneous Treatment of LONG Native Coronary Lesions with Drug-Eluting Stent (LONG-DES IV) ( http://www.clinicaltrials.gov , unique identifier: NCT01186094 ) and V ( NCT01186120 ) trials. These were prospective, randomized, single-blind controlled studies, conducted from March 1, 2009 to May 31, 2012 at the Asan Medical Center, South Korea. After the procedure, all patients were advised to take part in a CR program, as a standard strategy. During hospitalization, all patients received phase I of the CR program by CR staff. At the time of discharge, they were recommended to take part in phase II of the CR program, after automatic referral from an attending physician. Patients decided whether to participate in the CR program according to their individual circumstances, such as distance from the hospital, risk classification, socioeconomic status, motivation, and support system, among others.
Data from all patients who attended at least 1 outpatient CR session and CR clinic were included in the Asan Medical Center CR database as a prospective registry. Participation in CR was defined as attending at least 1 outpatient CR session (phase II) within 3 months of the index PCI. Attendance was determined using the Asan Medical Center CR database. All nonparticipant medical records were checked to ensure they had not attended CR within 3 months of the index PCI. Patients who did not attend CR in the 3 months after the index PCI but attended CR after a subsequent qualifying event were considered nonparticipants.
All patients underwent a baseline cardiopulmonary exercise test as part of an exercise prescription. Symptom-limited cardiopulmonary exercise testing using the Bruce ramp protocol was performed before and after the 3-month follow-up visits. Maximum oxygen uptake (VO 2 max) was defined as the highest VO 2 value achieved during exercise (Quark CPET; COSMED, Rome, Italy). In addition, patients were asked to answer a questionnaire, to determine if there were any signs of depression before and after the 3-month CR follow-up visit. Before November 2011, the Beck Depression Inventory was used, in which a value from 0 to 3 was assigned to each answer for a total of 21 questions; the total score was then compared with a scale to determine the severity of depression. The standard cutoffs were as follows: 0 to 9, minimal; 10 to 18, mild; 19 to 29, moderate; and 30 to 63, severe depression. After December, 2011, the Patient Health Questionnaire (PHQ-9) was used as a brief depression screening instrument, in which a value from 0 to 3 was assigned to each answer for a total of 9 questions. The standard cutoffs were as follows: 1 to 9, mild; 10 to 19, moderate; and 20 to 27, severe depression. The PHQ-9 has reasonable sensitivity and specificity for patients with coronary artery disease. If a patient was classified with a moderate to high probability of severe depression, he or she was referred for treatment to a psychiatrist belonging to the CR program, who could provide antidepressant drugs or cognitive behavioral therapy.
The LONG-DES IV and V trials consecutively enrolled eligible patients, aged ≥18 years, with stable angina, unstable angina, non–ST segment elevation myocardial infarction, or inducible ischemia, who had at least 1 native long coronary lesion suitable for stent implantation. Angiographic eligibility for inclusion consisted of a target de novo lesion with a stenosis diameter of ≥50%, a visual vessel diameter of ≥2.5 mm, a visual lesion length of ≥25 mm, and a planned total stent length of ≥28 mm. Patients who met the inclusion and exclusion criteria were randomized 1:1 after diagnostic angiography and before PCI, by means of an interactive web response system. Stent implantation was performed according to standard techniques. In the LONG IV trial, Resolute zotarolimus-eluting stents (Endeavor Resolute; Medtronic, Minneapolis, Minnesota) and sirolimus-eluting Stents (Cypher Select Plus; Cordis, Johnson & Johnson, New Brunswick, New Jersey) were used, and in the LONG V trial, Biolimus A9–eluting stents (Nobori; Terumo, Tokyo, Japan) and platinum-chromium everolimus-eluting stents (Promus Element; Boston Scientific, Natick, Massachusetts) were used.
The primary end point was in-stent late luminal loss 9 months after the index procedure, defined as the difference in minimal luminal diameter assessed immediately after the procedure and at the angiographic follow-up. Secondary angiographic end points were in-stent and in-segment binary restenosis and in-segment late loss at 9 months. Secondary clinical end points included death, myocardial infarction (MI), ischemia-driven target lesion revascularization, ischemia-driven target vessel revascularization, new lesion revascularization, and stent thrombosis within 12 months. In addition, we evaluated the changes in physical and biochemical variables before and after the CR program.
All deaths were considered to be from cardiac causes, unless a noncardiac cause was identified. MI diagnosis was based on the presence of new Q waves in at least 2 contiguous leads on an electrocardiogram or an elevation of creatine kinase-MB fraction or troponin I concentration >3 times the normal upper limit in at least 2 blood samples. Revascularization of the new lesion, target lesion, and target vessel was considered to be ischemia-driven if there was ≥50% stenosis of the diameter of the treated lesion or vessel by quantitative coronary analysis at an independent core laboratory as well as ischemic signs (i.e., positive functional tests) or symptoms, or a target vessel (or lesion) diameter stenosis of ≥70%, with or without documented ischemia. Stent thrombosis was defined as definite or probable according to the Academic Research Consortium definitions.
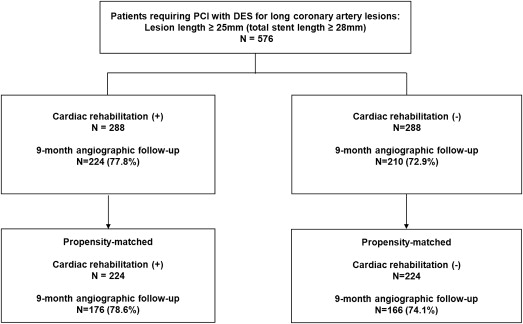
A 12-lead electrocardiogram was obtained, and serum concentrations of creatine kinase-MB isoenzyme were measured before stenting, after 8 to 16 hours, and again 18 to 24 hours after the procedure. Clinical follow-up visits were scheduled at 30 days, 6 months, 9 months, and 12 months. Blood samples for total cholesterol, low-density lipoprotein cholesterol, high-density lipoprotein cholesterol, triglycerides (Cobas R 8000 modular analyzer, Roche and homogeneous enzymatic colorimetric assay, Roche Diagnostics International Ltd, Rotkreuz, Switzerland), high-sensitivity C-reactive protein (latex-enhanced high-sensitivity C-reactive protein immunoassay, COBAS INTEGRA; Roche Diagnostics GmbH, Mannheim, Germany), and glycated hemoglobin (ion-exchange chromatography, high-performance liquid chromatography, VARIANT II; Bio-Rad Laboratories, Hercules, California) were collected at baseline and 3 months after completion of CR, or not. In addition, we monitored clinical status, rehospitalizations, recatheterization, cardiac-related medications, and occurrence of adverse events throughout the follow-up. All eligible patients were asked to return for an angiographic follow-up 9 months after the procedure, or earlier, if anginal symptoms occurred. Figure 1 shows the flow of patients during follow-up.
Clinical, angiographic, procedural, and outcome data were collected using a dedicated electronic case report form by specialized personnel at the clinical data management center, blinded to the treatment assignments.
Coronary angiograms were digitally recorded at baseline, immediately after the procedure, and at follow-up and were assessed offline in the angiographic core laboratory using an automated edge-detection system (CASS V; Pie Medical Imaging, Maastricht, Netherland) by experienced assessors unaware of the allocated stent. The reference diameter was determined by interpolation. All quantitative coronary angiogram analyses were obtained within the stented segment (in-stent) and over the entire segment, including the stent and its 5-mm proximal and distal margins (in-segment). Angiographic variables included absolute lesion length, stent length, reference vessel diameter, minimum lumen diameter, percent diameter stenosis, binary restenosis rate, immediate gain, late loss, and patterns of recurrent restenosis. Binary restenosis was defined as ≥50% diameter stenosis on follow-up angiography, and patterns of angiographic restenosis were quantitatively assessed using the Mehran classification.
Categorical variables, presented as frequencies and percentages, were compared using the chi-square test or Fisher’s exact test. Continuous variables, expressed as mean ± SD, were compared using Student unpaired t test or the Mann-Whitney U test, as appropriate. Cumulative event rates were calculated using the Kaplan-Meier method, and comparisons were made by way of the log-rank test. A propensity matching method was conducted to adjust for potential confounding factors. The propensity scores were estimated with no regard for outcome variables, using multiple logistic regression analysis. All prespecified covariates were included in the full nonparsimonious models for treatment with CR versus non-CR ( Table 1 and Table 2 ). The discrimination and calibration ability of the propensity score model was assessed by means of the C statistic and the Hosmer-Lemeshow statistic. The propensity score–matched pairs were created by matching CR and non-CR subjects on the logit of the propensity score using calipers of width equal to 0.2 of the standard deviation of the logit of the propensity score. After propensity score matching, the baseline covariates were compared between the 2 groups, with the paired t test or the Wilcoxon signed rank test for continuous variables and McNemar test or marginal homogeneity test for categorical variables ( Table 1 and Table 2 ). We also examined similarities between CR and non-CR subjects in the propensity score–matched sample by calculating standardized differences for each of the baseline variables listed in Table 1 . All of the standardized differences for each of the baseline variables were <0.10 (10%) after matching. In the propensity score–matched cohort, angiographic and clinical outcomes were compared between the 2 groups with the paired t test or Wilcoxon signed rank test for continuous variables and McNemar test or marginal homogeneity test for categorical variables.
| Characteristics | Crude | Propensity-Matched | ||||||
|---|---|---|---|---|---|---|---|---|
| Cardiac Rehabilitation (288 Patients) | Non-Cardiac Rehabilitation (288 Patients) | Standardized Difference of the Mean (%) | p | Cardiac Rehabilitation (224 Patients) | Non-Cardiac Rehabilitation (224 Patients) | Standardized Difference of the Mean (%) | p | |
| Age (years) | 60.0 ± 9.1 | 61.2 ± 9.5 | 12.6 | 0.13 | 60.8 ± 8.5 | 60.9 ± 9.5 | 1.8 | 0.85 |
| Height (cm) | 164.3 ± 9.3 | 163.4 ± 12.6 | 5.7 | 0.34 | 164.6 ± 8.5 | 163.6 ± 8.2 | 5.2 | 0.19 |
| Weight (kilograms) | 68.0 ± 9.9 | 68.7 ± 10.4 | 3.6 | 0.45 | 68.93 ± 9.8 | 67.7 ± 10.1 | 2.5 | 0.20 |
| Body mass index (kilogram/m 2 ) | 25.0 ± 2.8 | 25.5 ± 2.8 | 18.2 | 0.03 | 25.4 ± 2.8 | 25.2 ± 2.8 | 3.6 | 0.52 |
| Obesity, body mass index >25 | 136 (47.2%) | 152 (52.8%) | 11.0 | 0.21 | 112 (50.0%) | 113 (50.4%) | 2.4 | 0.99 |
| Male gender | 217 (75.3%) | 229 (79.5%) | 10.0 | 0.27 | 175 (78.1%) | 171 (76.3%) | 4.3 | 0.74 |
| Diabetes mellitus | 72 (25.0%) | 79 (27.4%) | 14.2 | 0.51 | 60 (26.8%) | 58 (25.9%) | 0.9 | 0.92 |
| Hypertension | 129 (44.8%) | 117 (40.6%) | 8.4 | 0.35 | 129 (57.6%) | 127 (56.7%) | 1.8 | 0.92 |
| Hyperlipidemia | 200 (69.4%) | 194 (67.4%) | 4.5 | 0.65 | 130 (58.0%) | 114 (50.9%) | 1.9 | 0.15 |
| Current smoker | 74 (25.7%) | 87 (30.2%) | 10.1 | 0.27 | 89 (39.7%) | 93 (41.7%) | 0 | 0.70 |
| Family history of coronary artery disease | 35 (12.2%) | 30 (10.5%) | 4.2 | 0.60 | 25 (11.2%) | 22 (9.8%) | 1.5 | 0.76 |
| Previous coronary angioplasty | 14 (4.9%) | 34 (11.8%) | 25.3 | <0.01 | 12 (5.4%) | 16 (7.1%) | 1.9 | 0.56 |
| Previous stroke | 8 (2.8%) | 13 (4.6%) | 9.3 | 0.28 | 8 (3.6%) | 6 (2.7%) | 5.1 | 0.79 |
| Previous myocardial infarction | 1 (0.3%) | 10 (3.5%) | 23.0 | 0.01 | 1 (0.4%) | 1 (0.4%) | 1.5 | 0.99 |
| Left ventricular ejection fraction (%) | 59.9 ± 5.4 | 59.8 ± 6.9 | 5.6 | 0.87 | 59.88 ± 5.5 | 59.6 ± 6.5 | 1.5 | 0.71 |
| Multi-vessel disease | 126 (43.8%) | 145 (50.3%) | 13.2 | 0.13 | 109 (48.7%) | 105 (46.9%) | 0.9 | 0.78 |
| Clinical indication | 8.7 | 0.42 | 3.8 | 0.90 | ||||
| Stable angina or silent ischemia | 195 (67.7%) | 209 (72.6%) | 156 (69.6%) | 153 (68.3%) | ||||
| Unstable angina | 69 (24.0%) | 57 (19.8%) | 50 (22.3%) | 54 (24.1%) | ||||
| Non-ST segment elevation myocardial infarction | 24 (8.3%) | 22 (7.6%) | 18 (8.0%) | 17 (7.6%) | ||||
| Medication | ||||||||
| Aspirin | 283 (98.3%) | 272 (94.4%) | 27.5 | 0.02 | 223 (99.6%) | 219 (97.8%) | 2.8 | 0.21 |
| Clopidogrel | 285 (99.0%) | 284 (98.6%) | 7.8 | 0.70 | 222 (99.1%) | 221 (98.7%) | 1.8 | 0.99 |
| Cilostazol | 8 (2.8%) | 11 (3.8%) | 3.5 | 0.64 | 11 (4.9%) | 13 (5.8%) | 2.2 | 0.83 |
| Beta-blocker | 200 (69.4%) | 200 (69.4%) | 0 | 1.00 | 154 (68.8%) | 157 (70.1%) | 3.5 | 0.84 |
| Calcium channel blocker | 244 (84.7%) | 238 (82.5%) | 5.8 | 0.57 | 193 (86.2%) | 182 (81.3%) | 2.5 | 0.20 |
| ACE inhibitor or ARB | 72 (25.0%) | 95 (32.9%) | 17.5 | 0.04 | 65 (29.0%) | 59 (26.3%) | 2.5 | 0.52 |
| Statin | 273 (94.8%) | 279 (96.8%) | 9.8 | 0.28 | 214 (95.5%) | 218 (97.3%) | 3.2 | 0.45 |
| Characteristics | Crude | Propensity-Matched | ||||||
|---|---|---|---|---|---|---|---|---|
| Cardiac Rehabilitation (288 Patients) | Non-Cardiac Rehabilitation (288 Patients) | Standardized Difference of the Mean (%) | p | Cardiac Rehabilitation (224 Patients) | Non-Cardiac Rehabilitation (224 Patients) | Standardized Difference of the Mean (%) | p | |
| Lesion characteristics | ||||||||
| Target vessel | 8.5 | 0.78 | 1.7 | 0.94 | ||||
| Left anterior descending | 194 (67.4%) | 191 (66.3%) | 118 (52.7%) | 121 (54.0%) | ||||
| Left circumflex | 26 (9.0%) | 31 (10.8%) | 56 (25.0%) | 56 (25.0%) | ||||
| Right coronary | 68 (23.6%) | 66 (22.9%) | 50 (22.3%) | 47 (21.0%) | ||||
| TIMI flow grade = 0 or 1 | 27 (9.4%) | 24 (8.4%) | 3.5 | 0.78 | 22 (9.8%) | 25 (11.2%) | 3.2 | 0.76 |
| Bifurcation lesion | 118 (41.1%) | 123 (42.7%) | 2.5 | 0.74 | 105 (46.8%) | 95 (42.4%) | 2.7 | 0.39 |
| Thrombus | 13 (4.5%) | 9 (3.1%) | 7.3 | 0.38 | 10 (4.5%) | 9 (4.0%) | 2.2 | 0.82 |
| Severe tortuosity | 2 (0.7%) | 1 (0.3%) | 5.2 | 0.81 | 7 (3.1%) | 7 (3.1%) | 0 | 0.99 |
| Severe calcification | 30 (10.5%) | 39 (13.5%) | 16.0 | 0.12 | 26 (11.6%) | 28 (12.5%) | 3.8 | 0.89 |
| Ulceration | 8 (2.8%) | 14 (4.9%) | 10.8 | 0.19 | 7 (3.1%) | 6 (2.7%) | 2.7 | 0.99 |
| Procedural characteristics | ||||||||
| Used drug-eluting stent | 0.97 | 0.87 | ||||||
| Sirolimus-eluting stent (Cypher) | 80 (27.8%) | 79 (27.4%) | 65 (29.0%) | 61 (27.2%) | ||||
| Zotarolimus-eluting stent (Endeavor Resolute) | 80 (27.9%) | 78 (27.1%) | 61 (27.2%) | 69 (30.8%) | ||||
| Biolimus A9-eluting stent (Nobori) | 65 (22.6%) | 63 (21.9%) | 49 (21.9%) | 47 (21.0%) | ||||
| Everolimus-eluting stent (Promus Element) | 63 (21.9%) | 68 (23.6%) | 49 (21.9%) | 47 (21.0%) | ||||
| Number of stents used at the target lesion | 18.2 | 0.64 | 3.6 | 0.35 | ||||
| One stent | 123 (42.7%) | 124 (43.1%) | 100 (44.6%) | 102 (45.5%) | ||||
| Two stents | 137 (47.6%) | 129 (44.8%) | 101 (45.1%) | 99 (44.2%) | ||||
| Three stents | 27 (9.4%) | 32 (11.1%) | 23 (10.3%) | 20 (8.9%) | ||||
| Four stents | 1 (0.3%) | 3 (1.0%) | 0 | 3 (1.3%) | ||||
| Mean | 1.7 ± 0.7 | 1.7 ± 0.7 | 0.62 | 1.7 ± 0.7 | 1.7 ± 0.7 | 0.94 | ||
| Length of stents used at the target lesion (mm) | 44.7 ± 16.0 | 46.1 ± 17.0 | 18.2 | 0.30 | 44.2 ± 16.1 | 44.3 ± 16.1 | 3.6 | 0.90 |
| Average stent diameter at the target lesion (mm) | 3.3 ± 0.3 | 3.3 ± 0.3 | 3.8 | 0.65 | 3.3 ± 0.3 | 3.3 ± 0.3 | 1.0 | 0.90 |
| Maximal pressure (atm) | 13.4 ± 3.9 | 14.2 ± 4.3 | 19.0 | 0.02 | 13.7 ± 3.8 | 13.8 ± 4.5 | 4.2 | 0.65 |
| Direct stenting | 23 (8.0%) | 22 (7.6%) | 1.3 | 0.87 | 18 (8.0%) | 21 (9.4%) | 4.8 | 0.74 |
| Post-additional balloon inflation | 260 (90.3%) | 253 (87.8%) | 7.0 | 0.42 | 25 (11.2%) | 29 (12.9%) | 0 | 0.66 |
| Intravascular ultrasound guidance | 280 (97.2%) | 283 (98.3%) | 7.0 | 0.58 | 219 (97.8%) | 219 (97.8%) | 0 | 0.99 |
All reported p values were 2-sided, and a p value of <0.05 was considered statistically significant. SAS software, version 9.1 (SAS Institute, Inc., Cary, North Carolina), was used for statistical analyses.
Results
A total of 576 consecutive patients received PCI for long coronary artery lesions in the LONG IV and LONG V trials. Among them, 288 patients (50%) participated in phase II CR program after index hospitalization. The mean and median numbers of CR sessions were 10.6 and 13, respectively, and the interquartile range was 8 to 16. Baseline clinical lesions and procedural characteristics are listed in Table 1 and Table 2 . Most of these characteristics were similar between the CR and non-CR groups, except for the incidence of previous MI and PCI history. After propensity score matching, there were 224 matched pairs of patients. No significant differences were present between the 2 groups ( Tables 1 and 2 ).
Quantitative angiographic results at baseline, immediately after the procedure, and at the 9-month follow-up are listed in Table 3 . Angiographic measurements of lesions before and immediately after the procedure were similar in the 2 groups. Follow-up angiography was performed on 434 patients in the total cohort (224, 77.8% in the CR group vs 210, 72.9% in the non-CR group, p = 0.21) and 342 propensity-matched patients (176, 78.6% in the CR group vs 166, 74.1% in the non-CR group, p = 0.26). The median duration for angiographic follow-up was 9.3 months (interquartile range 8.0 to 10.4). Patients undergoing angiographic follow-up were younger, taller, with a higher body mass index, more likely to take statins, less likely to have previous coronary angioplasty, and more likely to have post-additional balloon inflation than those who did not return for angiographic follow-up ( Supplementary Tables 1 and 2 ).
| Characteristics | Crude | Propensity-Matched | ||||
|---|---|---|---|---|---|---|
| Cardiac Rehabilitation (288 Patients) | Non-Cardiac Rehabilitation (288 Patients) | p | Cardiac Rehabilitation (224 Patients) | Non-Cardiac Rehabilitation (224 Patients) | p | |
| Before procedure | ||||||
| Lesion length (mm) | 31.38 ± 13.38 | 32.28 ± 13.57 | 0.42 | 30.85 ± 13.45 | 31.68 ± 13.29 | 0.52 |
| Reference vessel diameter (mm) | 3.30 ± 0.46 | 3.32 ± 0.43 | 0.51 | 3.30 ± 0.47 | 3.34 ± 0.44 | 0.37 |
| Minimal luminal diameter (mm) | 0.86 ± 0.47 | 0.93 ± 0.49 | 0.06 | 0.85 ± 0.48 | 0.95 ± 0.50 | 0.02 |
| Diameter stenosis (%) | 74.07 ± 13.81 | 71.84 ± 14.26 | 0.06 | 74.37 ± 13.96 | 71.25 ± 14.50 | 0.02 |
| Immediately after procedure | ||||||
| Minimal luminal diameter (mm) | ||||||
| In-segment | 2.71 ± 0.59 | 2.73 ± 0.56 | 0.66 | 2.72 ± 0.59 | 2.76 ± 0.57 | 0.40 |
| In-stent | 2.89 ± 0.51 | 2.91 ± 0.47 | 0.26 | 2.92 ± 0.51 | 2.95 ± 0.47 | 0.50 |
| Proximal margin | 3.49 ± 0.56 | 3.55 ± 0.58 | 0.63 | 3.53 ± 0.57 | 3.58 ± 0.59 | 0.36 |
| Distal margin | 2.51 ± 0.51 | 2.53 ± 0.47 | 0.52 | 2.72 ± 0.58 | 2.76 ± 0.54 | 0.42 |
| Diameter stenosis (%) | ||||||
| In-segment | 18.02 ± 9.45 | 17.40 ± 9.12 | 0.42 | 18.05 ± 9.69 | 17.45 ± 8.87 | 0.50 |
| In-stent | 9.61 ± 7.28 | 10.45 ± 7.55 | 0.17 | 9.45 ± 7.02 | 10.01 ± 7.18 | 0.30 |
| Proximal margin | 14.83 ± 9.20 | 15.70 ± 9.25 | 0.46 | 9.31 ± 8.14 | 11.62 ± 8.63 | 0.04 |
| Distal margin | 11.16 ± 8.93 | 11.70 ± 8.41 | 0.22 | 16.42 ± 9.38 | 16.16 ± 9.06 | 0.76 |
| Acute gain (mm) | ||||||
| In-segment | 1.55 ± 0.65 | 1.48 ± 0.60 | 0.22 | 1.57 ± 0.66 | 1.48 ± 0.60 | 0.15 |
| In-stent | 1.87 ± 0.63 | 1.79 ± 0.61 | 0.15 | 1.90 ± 0.64 | 1.80 ± 0.61 | 0.09 |
| Follow-up at 9 months, no. eligible patients (%) | 224 (77.8%) | 210 (72.9%) | 0.21 | 176 (78.6) | 166 (74.1) | 0.26 |
| Minimal luminal diameter (mm) | ||||||
| In-segment | 2.31 ± 0.51 | 2.23 ± 0.54 | 0.16 | 2.73 ± 0.63 | 2.76 ± 0.67 | 0.61 |
| In-stent | 2.54 ± 0.50 | 2.44 ± 0.55 | 0.04 | 2.90 ± 0.59 | 2.90 ± 0.63 | 0.77 |
| Proximal margin | 3.16 ± 0.61 | 3.15 ± 0.64 | 0.88 | 3.48 ± 0.63 | 3.53 ± 0.69 | 0.51 |
| Distal margin | 2.38 ± 0.48 | 2.36 ± 0.49 | 0.67 | 2.72 ± 0.57 | 2.73 ± 0.58 | 0.94 |
| Diameter stenosis (%) | ||||||
| In-segment | 22.15 ± 13.01 | 24.09 ± 14.92 | 0.15 | 21.97 ± 12.64 | 23.62 ± 15.21 | 0.28 |
| In-stent | 16.87 ± 12.75 | 20.44 ± 14.66 | <0.01 | 14.23 ± 13.64 | 16.74 ± 13.24 | 0.09 |
| Proximal margin | 13.53 ± 12.27 | 16.20 ± 12.43 | 0.03 | 15.56 ± 11.25 | 19.64 ± 14.74 | <0.01 |
| Distal margin | 17.12 ± 10.40 | 17.58 ± 11.44 | 0.66 | 17.82 ± 10.65 | 17.30 ± 11.24 | 0.66 |
| Late luminal loss (mm) | ||||||
| In-segment | 0.11 ± 0.33 | 0.17 ± 0.43 | 0.08 | 0.10 ± 0.33 | 0.17 ± 0.46 | 0.09 |
| In-stent (primary endpoint) | 0.19 ± 0.33 | 0.29 ± 0.45 | 0.02 | 0.18 ± 0.31 | 0.28 ± 0.47 | 0.02 |
| Proximal margin | 0.18 ± 0.46 | 0.22 ± 0.42 | 0.45 | 0.19 ± 0.48 | 0.21 ± 0.41 | 0.69 |
| Distal margin | 0.06 ± 0.27 | 0.08 ± 0.33 | 0.61 | 0.06 ± 0.28 | 0.07 ± 0.35 | 0.70 |
| Angiographic restenosis | ||||||
| In-segment | 12 (5.3%) | 14 (6.6%) | 0.48 | 8 (4.5%) | 11 (6.6%) | 0.47 |
| In-stent | 8 (3.5%) | 12 (5.7%) | 0.24 | 5 (2.8%) | 11 (6.6%) | 0.12 |
| Proximal margin | 4 (1.8%) | 3 (1.4%) | 0.82 | 4 (2.3%) | 1 (0.6%) | 0.37 |
| Distal margin | 1 (0.5%) | 2 (0.9%) | 0.60 | 1 (0.6%) | 1 (0.6%) | 0.99 |
| Angiographic Pattern of Restenosis ∗ | ||||||
| IA (gap) | 2 (16.7%) | 0 | 1 (12.5%) | 0 | ||
| IB (margin) | 3 (25.0%) | 2 (14.3%) | 2 (25.0%) | 2 (18.2%) | ||
| IC (focal body) | 4 (33.3%) | 8 (57.1%) | 3 (37.5%) | 7 (63.6%) | ||
| ID (multifocal) | 0 | 1 (7.1%) | 0 | 1 (9.1%) | ||
| II (intra-stent) | 2 (16.7%) | 2 (14.3%) | 1 (12.5%) | 0 | ||
| III (proliferative) | 1 (8.3%) | 0 | 1 (12.5%) | 0 | ||
| IV (total occlusion) | 0 | 1 (7.1%) | 0 | 1 (9.1%) | ||
Stay updated, free articles. Join our Telegram channel

Full access? Get Clinical Tree


