Although the adverse prognosis of Q-waves on electrocardiogram (ECG) has been demonstrated, the prognostic significance of prominent R wave (PRW) in V1 or V2 across a broad spectrum of acute coronary syndrome (ACS) has not been specifically studied. In the Global Registry of Acute Coronary Events (GRACE) and the Canadian ACS Registry I ECG substudies, admission ECGs were analyzed in an independent core ECG laboratory. PRW was defined as R wave >40 to 50 ms in V1 or V2, R/S ≥1 in V1, or R/S ≥1.5 in V2. Among 11,895 patients with ACS, 495 (4.2%) had PRW; they were less likely to have a history of hypertension or heart failure and had lower GRACE risk scores, but a higher incidence of ST-segment depression (all p ≤0.001). Patients with PRW had similar rates of in-hospital death (2.8% vs 4.1%, respectively, p = 0.15) but lower rates of in-hospital heart failure (8.5% vs 15.2%, respectively, p = 0.02) and 6-month mortality (4.6% vs 8.4%, respectively, p = 0.004). In multivariable analyses, PRW was not a significant independent predictor of in-hospital mortality (adjusted odds ratio = 0.99, 95% confidence interval 0.55 to 1.8) or 6-month mortality (adjusted odds ratio = 0.70, 95% confidence interval 0.43 to 1.15). Among 4,418 patients who underwent coronary angiography, those with PRW had a higher prevalence of left circumflex artery disease (62.5% vs 49.5%, respectively, p = 0.01). In conclusion, across the broad spectrum of patients with ACS, PRW provides no significant additional prognostic utility beyond comprehensive risk assessment using the GRACE risk score. PRW is more frequently associated with left circumflex artery disease.
The admission electrocardiogram (ECG) provides useful prognostic information and is key to the early risk stratification of acute coronary syndrome (ACS). A prominent R wave (PRW) in lead V1 or V2 was first noted by Levy et al in patients with acute myocardial infarction. Several authors later described the relation between PRW and posterior wall infarction. Since then, PRW has often been considered as a Q-wave equivalent of the posterior wall. Although the adverse prognosis of Q-waves, including PRW, has been reported in previous studies, the prognostic significance of prominent PRW in a broad spectrum of ACS has not been specifically studied. Accordingly, we examined the relation of PRW and clinical features, in-hospital management, short- and long-term outcomes.
Methods
The Canadian ACS Registry I and Global Registry of Acute Coronary Events (GRACE) were prospective, multicenter, observational studies of patients admitted with ACS. The objectives and methodologies have been published previously. Briefly, in the ACS I, patients ≥18 years of age with suspected acute cardiac ischemia of <24 hours of symptom onset were eligible for inclusion. In GRACE, patients had to be at least 18-year-old with a presumptive diagnosis of ACS and at least 1 of the following: electrocardiographic changes consistent with ACS, serial increases in serum biochemical markers of cardiac necrosis, and/or documented history of coronary artery disease. To minimize selection bias, the study centers were instructed to enroll consecutive eligible patients. Cardiac catheterization during index hospitalization was performed at the discretion of the treating physicians. Significant stenosis was defined as ≥50% narrowing in reference to the diameter of the adjacent normal segment of the coronary artery. Where required, the local institutional review board approved the study protocol.
The study population consisted of all patients with ACS from the GRACE ECG substudy (n = 7,527) and ACS I (n = 4,368). In this analysis, patients with right bundle branch block or right ventricular hypertrophy by ECG were excluded (n = 603). All admission ECGs were read independently at the Canadian Heart Research Center ECG core laboratory blinded to other clinical data and outcomes. Previous studies had validated the accuracy of ECG interpretation by this core laboratory. PRW was defined as R wave >40 ms in V1 or V2 (50 ms in ACS I), or R/S ≥1 in V1, or R/S ≥1.5 in V2. ST-segment deviation was measured at 80 ms after the J point to the nearest 0.05 mV in all leads. A Q-wave was defined as at least 40 ms in duration and/or ≥1/3 of the R-wave height.
To assess the independent prognostic significance of PRW, we adjusted for other known prognosticators in the GRACE risk model. The GRACE risk model was designed to predict in-hospital mortality and is comprised of the following predictor variables on presentation: age, heart rate, systolic blood pressure, cardiac arrest, Killip class, creatinine, ST-segment deviation, and biomarker status. The GRACE risk model for predicting postdischarge death at 6 months also included previous myocardial infarction and heart failure. The GRACE risk model has demonstrated excellent discrimination in external validation cohorts of patients with ACS. We stratified patients into 2 groups based on the presence or absence of PRW on the admission ECG and compared their baseline demographic characteristics, electrocardiographic features, angiographic findings, treatment, and outcomes. Continuous variables are presented as medians and categorical variables as percentages. To examine trends across groups, chi-square test for trend was used.
To evaluate the independent association of PRW and in-hospital and cumulative 6-month mortality, we used multivariable logistic regression to adjust for all the predictor variables in the GRACE risk score. The primary end point of this analysis was in-hospital mortality. Previous myocardial infarction and heart failure (in addition to the components of the GRACE risk model for in-hospital mortality) were also considered in the multivariable model for 6-month mortality. To verify the robustness of the results, the analyses were repeated using a more stringent definition of PRW (R wave >40 ms and R/S >1 in V1, or R wave >40 ms and R/S >1.5 in V2). To determine whether the prognostic value of PRW differed in the group with versus without ST-segment elevation, we tested for their interaction terms in the multivariable models. Model discrimination and calibration were assessed by the c-statistic and the Hosmer-Lemeshow goodness-of-fit test, respectively. Data were analyzed using SPSS version 15.0 (SPSS Inc., Chicago, Illinois). Statistical significance was set at a 2-sided p value <0.05.
Results
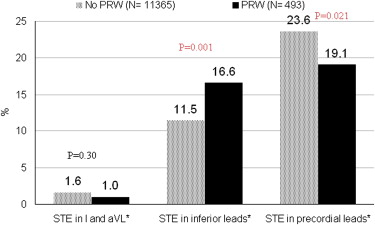
Of the 11,895 patients in the GRACE and ACS I who had ACS and no right bundle branch block or right ventricular hypertrophy in their presenting ECG, 495 (4.2%) had PRW. Table 1 lists the baseline demographics and clinical characteristics. Figure 1 shows the location of ST-elevation on the presenting ECG.
| Variable | PRW in V1 or V2 | p Value | |
|---|---|---|---|
| No (n = 11,400) | Yes (n = 495) | ||
| Age (yrs) | 64 (55–73) | 66 (55–75) | 0.059 |
| Men | 66 | 77.4 | <0.001 |
| Current smoker | 29.3 | 28.1 | 0.55 |
| Hypertension ∗ | 55.0 | 49.0 | 0.008 |
| Hyperlipidemia † | 45.2 | 45.5 | 0.88 |
| Diabetes mellitus | 24.0 | 20.5 | 0.071 |
| Angina pectoris | 56.5 | 56.1 | 0.86 |
| Previous myocardial infarction | 31.5 | 32.3 | 0.72 |
| Previous heart failure | 10.8 | 6.1 | 0.001 |
| Previous percutaneous coronary intervention | 14.9 | 15.9 | 0.56 |
| Previous coronary bypass grafting | 11.7 | 10.0 | 0.26 |
| Previous stroke/transient ischemic attack | 7.9 | 5.7 | 0.081 |
| Killip class | <0.001 | ||
| I | 81.2 | 89.7 | |
| II | 14.6 | 9.0 | |
| III | 3.5 | 1.3 | |
| IV | 0.7 | 0 | |
| Heart rate (beats/min) | 75 (64–90) | 72 (62–83) | <0.001 |
| Systolic blood pressure (mm Hg) | 142 (124–161) | 143 (123–161) | 0.71 |
| Diastolic blood pressure (mm Hg) | 80 (70–91) | 80 (70–90) | 0.65 |
| Abnormal cardiac marker at presentation | 41.7 | 42.5 | 0.71 |
| Cardiac arrest at presentation | 1.7 | 1.3 | 0.46 |
| ECG findings | |||
| ST-segment elevation (≥1 mm in ≥2 contiguous leads) | 32.7 | 32.3 | 0.85 |
| ST-segment depression (≥0.5 mm in any lead) | 49.9 | 57.8 | <0.001 |
| ST-segment depression in V1 and V2 (≥0.5 mm) | 5.0 | 10.3 | <0.001 |
| Q-wave in leads I and aVL | 2.8 | 5.3 | 0.002 |
| Q-wave in leads II and aVF | 4.2 | 10.9 | <0.001 |
| T-wave inversion in any lead | 26.3 | 24.2 | 0.30 |
| GRACE risk score | 128 (105–154) | 120 (99–146) | <0.001 |
∗ Previously diagnosed systemic hypertension either treated or untreated.
† Previously diagnosed hyperlipidemia or patient on lipid-lowering medication.
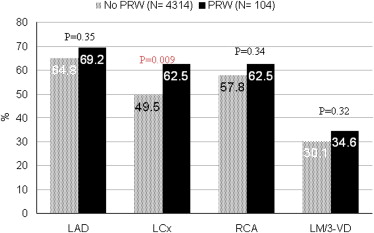
The management and outcome during the index hospitalization and at 6 months are listed in Table 2 . Figure 2 shows the angiographic findings of the 4,418 patients who underwent cardiac catheterization (angiographic data only available in GRACE).
| Variable | Overall (n = 11,895) | No PRW in V1 or V2 (n = 11,400) | PRW in V1 or V2 (n = 495) | p Value |
|---|---|---|---|---|
| In-hospital interventions | ||||
| Cardiac catheterization | 50.4 | 50.5 | 47.7 | 0.21 |
| Percutaneous coronary intervention | 26.2 | 26.5 | 19.6 | <0.001 |
| Coronary artery bypass grafting | 3.8 | 3.7 | 5.9 | 0.01 |
| Percutaneous coronary intervention and/or coronary artery bypass grafting | 29.9 | 30.1 | 25.1 | 0.02 |
| LVEF | 0.01 | |||
| Normal | 54.4 | 54.4 | 54.9 | |
| Mildly impaired | 24.1 | 23.9 | 29.8 | |
| Moderately impaired | 18.8 | 19.0 | 14.5 | |
| Severely impaired | 2.7 | 2.8 | 0.7 | |
| In-hospital outcomes | ||||
| Death | 4.1 | 4.1 | 2.8 | 0.15 |
| Myocardial (re-)infarction | 8.0 | 8.0 | 7.5 | 0.69 |
| Death or myocardial (re-)infarction | 10.9 | 11.0 | 9.4 | 0.26 |
| Heart failure | 15.0 | 15.2 | 8.5 | 0.02 |
| Six-month outcome | ||||
| Death | 8.2 | 8.4 | 4.6 | 0.004 |
In multivariable analyses adjusting for the prognosticators in the GRACE risk models, PRW was not a significant predictor of in-hospital or 6-month mortality ( Tables 3 and 4 ). There was no significant interaction between PRW and ST-segment elevation for in-hospital (p = 0.73) or 6-month mortality (p = 0.41). Sensitivity analysis showed that using a more stringent definition of PRW, 165 patients (1.4%) had PRW; they were less likely to have diabetes or previous heart failure but had similar rates of unadjusted in-hospital and 6-month mortality compared with those without PRW. PRW was also not a significant predictor of in-hospital (adjusted odds ratio = 1.51, 95% confidence interval 0.67 to 3.43, p = 0.32) or 6-month mortality (adjusted odds ratio = 0.96, 95% confidence interval 0.465 to 1.976, p = 0.91) after adjusting for the factors in the GRACE risk models. When the analysis was restricted to patients with no Q waves in V1 and V2, there was no significant difference among the groups with versus without PRW with respect to in-hospital mortality (p = 0.5), in-hospital heart failure (p = 0.29), and 6-month mortality (p = 0.8).
| Adjusted OR | 95% CI | p Value | |
|---|---|---|---|
| Age (yrs; per decade higher) | 2.08 | 1.87–2.31 | <0.001 |
| Heart rate (per 10 beats/min higher) | 1.09 | 1.05–1.14 | <0.001 |
| Systolic blood pressure (per 10 mm Hg higher) | 0.83 | 0.83–0.89 | <0.001 |
| Killip class | |||
| I | Reference | ||
| II | 2.02 | 1.57–2.59 | <0.001 |
| III | 3.28 | 2.29–4.69 | <0.001 |
| IV | 4.81 | 2.51–9.24 | <0.001 |
| Cardiac arrest on presentation | 5.79 | 3.65–9.19 | <0.001 |
| Creatinine (10 μmol/L higher) | 1.03 | 1.02–1.04 | <0.001 |
| Abnormal initial cardiac biomarker | 2.02 | 1.61–2.52 | <0.001 |
| ST-segment deviation | 1.70 | 1.28–2.25 | <0.001 |
| PRW in V1 or V2 | 0.99 | 0.55–1.80 | 0.98 |
| Adjusted OR | 95% CI | p Value | |
|---|---|---|---|
| Age (yrs; per decade higher) | 2.02 | 1.86–2.18 | <0.001 |
| Previous heart failure | 1.50 | 1.2–1.87 | <0.001 |
| Previous myocardial infarction | 1.0 | 0.84–1.21 | 0.98 |
| Heart rate (per 10 beats/min higher) | 1.13 | 1.09–1.16 | <0.001 |
| Systolic blood pressure (per 10 mm Hg higher) | 0.89 | 0.87–0.92 | <0.001 |
| Killip class | |||
| I | Reference | ||
| II | 1.63 | 1.33–1.99 | <0.001 |
| III | 2.27 | 1.67–3.10 | <0.001 |
| IV | 3.30 | 1.76–6.17 | <0.001 |
| Cardiac arrest on presentation | 3.89 | 2.49–6.09 | <0.001 |
| Creatinine (10 μmol/L higher) | 1.04 | 1.03–1.05 | <0.001 |
| Abnormal initial cardiac biomarker | 1.74 | 1.47–2.06 | <0.001 |
| ST-segment deviation | 1.48 | 1.21–1.82 | <0.001 |
| PRW in V1 or V2 | 0.70 | 0.43–1.15 | 0.16 |
Stay updated, free articles. Join our Telegram channel

Full access? Get Clinical Tree


