The aim of this study was to determine the impact of aortic stenosis (AS) on the different components of left atrial (LA) function. The study consisted of a total of 52 consecutive patients with severe AS (aortic valve area <1 cm 2 ) and 20 normal subjects matched for gender, heart rate, body surface area, and baseline systolic blood pressure. Phasic LA longitudinal function was assessed using tissue Doppler imaging. LA peak systolic (reservoir function), early diastolic (conduit function), and late diastolic (active function) strain rates were measured. During late diastole, LA peak strain (active function) was also measured. Mitral annular systolic, early diastolic (Ea), and late diastolic (Aa) velocities were also measured. Compared with controls, all strain values were significantly reduced in patients with AS. By multivariate regression analysis, mitral E-wave deceleration time (p = 0.033) and E/Ea ratio (p = 0.02, R 2 = 0.43) emerged as independently associated with LA peak systolic strain rate. Ea was the sole determinant of LA early diastolic strain rate (p <0.0001, R 2 = 0.42), whereas LA late diastolic strain rate was independently related to aortic valve area (p = 0.031) and Aa (p = 0.022, R 2 = 0.51). In conclusion, in patients with severe AS, the 3 components of LA function are reduced. LA reservoir dysfunction is related to left ventricular filling pressures, whereas LA conduit dysfunction depends on left ventricular relaxation. Active LA dysfunction is related to the severity of AS and late left ventricular diastolic function.
The different components of left atrial (LA) function—reservoir, conduit, and active contractile function—can be adequately examined by tissue Doppler–derived strain imaging. Strain imaging overcomes the main drawbacks of tissue Doppler–derived myocardial velocities and thus provides more accurate quantification of regional myocardial function. Compared to normal subjects, LA strain and strain rate have been shown to be altered in patients with various cardiovascular diseases. In aortic stenosis (AS), LA function as assessed by LA strain and strain rate has not yet been evaluated. We sought to determine the impact of AS on the different components of the LA function.
Methods
From April 2008 to June 2009, LA function was prospectively evaluated in 52 consecutive patients with AS (aortic valve area <1 cm 2 ) and in 20 normal subjects matched for gender, heart rate, body surface area, and baseline systolic blood pressure ( Table 1 ). None of the patients had concomitant significant valvular disease, atrial fibrillation, or pacemaker-dependant rhythm. Patients with AS were separated in 2 groups according to age: group 1, aged ≤70 years (n = 22), and group 2, aged >70 years (n = 30). Calcific degenerative AS was observed in 38 patients (73%), and bicuspid valve calcification was the cause of AS in the remaining 14 patients (27%). None of the control subjects had histories of coronary artery disease, cerebrovascular disease, valvular abnormalities, or diabetes. Three subjects in the control group had well-controlled hypertension.
| Variable | Controls(n = 20) | Patients With AS Aged ≤70 Years (n = 22) | Patients With AS Aged >70 Years (n = 30) | p Value |
|---|---|---|---|---|
| Age (years) | 54.9 ± 7.9 | 58.9 ± 12.6 | 79.8 ± 5.1 † | 0.001 |
| Men | 50% | 72% | 47% | NS |
| Heart rate (beats/min) | 75 ± 12 | 68 ± 12 | 72 ± 12 | NS |
| Body surface area (m 2 ) | 1.83 ± 0.22 | 1.81 ± 0.2 | 1.79 ± 0.17 | NS |
| Systolic blood pressure (mm Hg) | 135 ± 20 | 139 ± 24 | 141 ± 26 | NS |
| Diastolic blood pressure (mm Hg) | 78 ± 11 | 76 ± 11 | 70 ± 11 ⁎ | 0.04 |
| Hypertension | 15% | 50% ⁎ | 80% ⁎ , † | <0.0001 |
| Diabetes mellitus | 0% | 4.7% | 30% ⁎ | 0.03 |
| Treated dyslipidemia | 30% | 52% | 63% ⁎ | NS |
| Coronary artery disease | — | 10% | 16.7% | NS |
| Smoking | 20% | 24% | 10% | NS |
| Angiotensin-converting enzyme inhibitors | 10% | 29% | 37% | NS |
| Angiotensin receptor blocker | 5% | 5% | 20% | NS |
| Calcium channel blockers | 0% | 10% | 17% | NS |
| β blockers | 5% | 48% ⁎ | 47% ⁎ | 0.004 |
| Diuretics | 10% | 18% | 30% | NS |
Doppler echocardiographic examinations were performed using a Vivid 7 or 9 ultrasound system (GE Healthcare, Little Chalfont, United Kingdom). M-mode, 2-dimensional, color Doppler, pulsed-wave, and continuous-wave Doppler data were stored on a dedicated workstation for off-line analysis. For each measurement, ≥2 cardiac cycles were averaged. Continuous-wave Doppler was used to measure aortic transvalvular maximal velocities; peak and mean gradients were calculated using the simplified Bernoulli equation. Aortic valve area was calculated using the standard continuity equation. Measurements of left ventricular (LV) wall thickness and dimensions were made by M-mode echocardiography, as recommended by the European Association of Echocardiography. LV end-diastolic and end-systolic volumes and the LV ejection fraction were measured using the biapical Simpson method. LA volume was obtained using the Simpson biplane method of disks from the apical 4- and 2-chamber views. LV diastolic function was evaluated by the analysis of mitral inflow velocities (E and A waves). Using pulsed-wave tissue Doppler, peak velocities during early (Ea) and late (Aa) diastole obtained at the level of the septal, lateral, inferior, and anterior mitral annulus were measured separately and then averaged. The E/A and E/Ea ratios were then calculated.
Color-tissue Doppler imaging was performed in the apical 4- and 2-chamber views with a narrow sector width at a high frame rate (≥150 frames/s). Careful attention was paid to align the atrial wall to the Doppler beam. A sample volume of 10 × 2 mm was placed from mid to superior LA wall and tracked frame by frame to maintain its position within the LA walls. For each measurement, ≥2 end-expiratory cardiac cycles were averaged. Off-line peak strain and strain rate were obtained at the level of septal, lateral, anterior, and inferior LA walls and then averaged to obtain global LA longitudinal function. For strain rate, global peak systolic (SrS), early diastolic (SrE), and late diastolic (SrA) strain rates were measured ( Figure 1 ). Myocardial strain profiles were calculated by integrating the strain rates over time and compensating for drift over the cardiac cycle. Because active atrial contraction occurs in diastole, the strain curves were gated in diastole by moving the gating marker to the end of the T wave on the electrocardiogram.
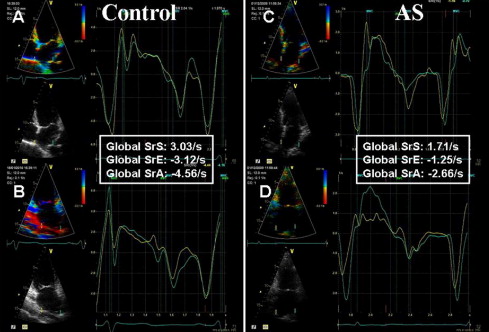
During LV systole, the left atrium acts as a reservoir, collecting blood from the pulmonary veins while the mitral valve is closed, resulting in LA enlargement. Passive stretching of the LA walls during LV systole leads to LA longitudinal lengthening, which is recorded as a positive strain rate (SrS) value. During early diastole, the left atrium acts as a conduit for passive emptying (SrE) and as a booster pump during atrial contraction (peak strain and SrA) in late diastole.
Continuous variables are expressed as mean ± SD, unless otherwise specified. Differences in continuous variables between groups were assessed using unpaired Student’s t tests. Categorical variables were compared using chi-square or Fisher’s exact tests as appropriate. Comparisons among the 3 groups (control subjects and AS patients aged ≤70 and >70 years) were performed using 1-way analysis of variance and then a Dunnett test. A p value <0.05 was considered significant. Linear regression analysis was applied to study the correlations between variables. To determine cofactors associated with parameters of LA function, a stepwise multiple linear regression was performed. All variables that were statistically significant were entered in the model (Statistica version 7; StatSoft, Inc., Tulsa, Oklahoma).
Results
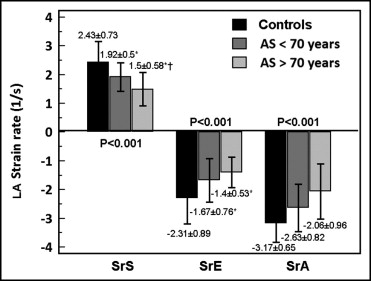
Tables 1 and 2 list the demographic and echocardiographic variables of the study population. Compared to controls, patients with AS were older. When analyzed by subgroups, patients in group 1 (aged ≤70 years) were no longer older than controls. The global LA strain and strain rate results in the control and AS groups are listed in Table 2 . Compared to controls, patients with AS had significant reductions of all strain and strain rate values. Moreover, except for global SrE, all strain and strain rate values were also significantly lower in older patients with AS. Figure 2 illustrates global strain rate differences among the 3 groups.
| Variable | Controls (n = 20) | Patients With AS Aged ≤70 Years (n = 22) | Patients With AS Aged >70 Years (n = 30) | p Value |
|---|---|---|---|---|
| LV ejection fraction (%) | 64.4 ± 6.5 | 67.3 ± 7.5 | 57.6 ± 13.6 ⁎ † | <0.001 |
| LV end-diastolic diameter (mm) | 45.1 ± 5.6 | 49.1 ± 6.7 | 48.5 ± 8.6 | NS |
| Ventricular septal thickness (mm) | 8.5 ± 1.0 | 11.8 ± 1.9 ⁎ | 12.3 ± 2.6 ⁎ | <0.001 |
| Posterior wall thickness (mm) | 9.3 ± 0.8 | 12.6 ± 1.9 ⁎ | 12.4 ± 1.8 ⁎ | <0.001 |
| LV mass index (g/m 2 ) | 81.6 ± 13.1 | 156.1 ± 40.5 ⁎ | 163.8 ± 50.8 ⁎ | <0.001 |
| Aortic valve area (cm 2 ) | — | 0.78 ± 0.25 | 0.66 ± 0.21 † | 0.05 |
| Mean transaortic gradient (mm Hg) | — | 43.6 ± 12.8 | 42.7 ± 13.8 | NS |
| Maximal transaortic gradient (mm Hg) | — | 71.4 ± 21.2 | 68.3 ± 20.1 | NS |
| Peak mitral E velocity (cm/s) | 71.4 ± 17.4 | 93.7 ± 34.6 ⁎ | 99.6 ± 33.2 ⁎ | 0.007 |
| Peak mitral A velocity (cm/s) | 78.2 ± 20.9 | 84.9 ± 20.5 | 90.2 ± 38.0 | NS |
| E/A ratio | 0.96 ± 0.28 | 1.15 ± 0.46 | 1.31 ± 0.74 | NS |
| Mitral E-wave deceleration time (ms) | 189 ± 47 | 242 ± 80 ⁎ | 205 ± 81 | 0.03 |
| Peak Ea velocity (cm/s) | 11.2 ± 2.6 | 7.6 ± 2.3 ⁎ | 6.2 ± 1.7 ⁎ , † | <0.001 |
| Peak Aa velocity (cm/s) | 12.5 ± 1.6 | 9.6 ± 2.1 ⁎ | 8.0 ± 2.5 ⁎ , † | <0.001 |
| E/Ea ratio | 7.8 ± 3.1 | 15.7 ± 11.0 ⁎ | 23.8 ± 15.2 ⁎ , † | <0.001 |
| Peak systolic velocity (cm/s) | 9.5 ± 2.2 | 6.7 ± 1.4 ⁎ | 5.3 ± 1.4 ⁎ , † | <0.001 |
| LA volume | 53.5 ± 16.0 | 76.0 ± 35.7 ⁎ | 87.9 ± 35.0 ⁎ | 0.001 |
| Global LA SrS (s −1 ) | 2.43 ± 0.73 | 1.92 ± 0.50 ⁎ | 1.50 ± 0.58 ⁎ , † | <0.001 |
| Global LA SrE (s −1 ) | −2.31 ± 0.89 | −1.67 ± 0.76 ⁎ | −1.40 ± 0.53 ⁎ | <0.001 |
| Global LA SrA (s −1 ) | −3.17 ± 0.65 | −2.63 ± 0.82 ⁎ | −2.06 ± 0.96 ⁎ , † | <0.001 |
| Global LA peak strain (%) | −21.7 ± 6.2 | −15.9 ± 6.3 ⁎ | −13.5 ± 6.4 ⁎ | <0.001 |
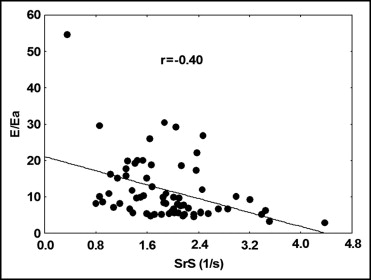
LA SrS was correlated inversely with age, LV mass, and E/A and E/Ea ratios ( Figure 3 ; Table 3 ). Good correlations were found between LA SrS and the LV ejection fraction, aortic valve area, mitral annular peak systolic velocity, mitral E-wave deceleration time, Ea, and Aa. No significant correlations were observed between LA SrS and blood pressure, peak and mean transaortic pressure gradients, and LA volume. By multivariate regression analysis, the LV ejection fraction (p = 0.033), mitral E deceleration time (p = 0.02), and the E/Ea ratio (p = 0.015, R 2 = 0.54) emerged as independently associated with global LA SrS. After adjustment for age, mitral E-wave deceleration time (p = 0.033) and the E/Ea ratio (p = 0.02, R 2 = 0.43) remained associated with global LA SrS.