Systemic inflammation at the development of an acute coronary syndrome (ACS) might alter the high-density lipoprotein (HDL) components and function. One of the major functions of HDL particles is their ability to remove cellular cholesterol from macrophages. The aim of the present study was to characterize the HDL efflux capacity in patients with ACS. We analyzed the cholesterol efflux in those ACS (within 72 hours of symptoms [ACS1]) and, again, 3 months later (ACS2). As controls, we used normal subjects without coronary artery disease (CAD) and patients with chronic, stable CAD. The 4 groups were matched for age and HDL cholesterol levels. We used a cell-based efflux system in 3 [H]-cholesterol–labeled J774 macrophages to measure cholesterol efflux from apolipoprotein B–depleted plasma. The present study included 20 patients with ACS. Their mean age was 58 ± 9 years, and the mean HDL cholesterol level was 1.06 ± 0.22 mmol/L (41 ± 9 mg/dl). The ACS1 group showed a marked increase in high-sensitivity C-reactive protein and serum amyloid A, reflecting systemic inflammation. The HDL cholesterol efflux capacity was reduced in ACS1 subjects and remained reduced 12 weeks later and in those with stable CAD. These results suggest that the acute presence of serum amyloid A does not account for the impairment of HDL-mediated cholesterol efflux capacity in the ACS1 group. Little correlation was found between HDL cholesterol and HDL efflux capacity (r = 0.233; p = 0.049), suggesting that HDL cholesterol is a poor marker of HDL function in inflammatory states and CAD. In conclusion, our data support the concept that atherogenic HDL dysfunction and impaired efflux occur in ACS, independent of changes in plasma HDL cholesterol and apolipoprotein A-I levels.
Patients with chronic, stable coronary artery disease (CAD) have been shown to have reduced cholesterol efflux capacity compared with healthy controls. In the setting of an acute myocardial infarction, we have shown a change in the high-density lipoprotein (HDL) proteome toward an inflammatory phenotype (as reflected by an increase in serum amyloid A [SAA]). Whether this inflammatory HDL has abnormal efflux function remains to be determined.
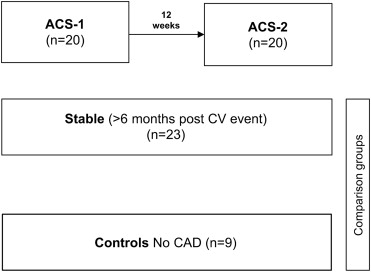
The purpose of the present study was to examine HDL-mediated cellular cholesterol efflux in patients with an acute coronary syndrome (ACS; <72 hours from the onset of symptoms—ACS1 group) and 12 weeks later (after recovery—ACS2 group) compared with HDL-mediated efflux from those with stable CAD and healthy controls. We determined the plasma levels of high-sensitivity C-reactive protein and SAA in all samples for the present study as an index of systemic inflammation.
Methods
Patients were selected from the McGill University Health Center (Montreal, Ontario, Canada). All subjects gave written informed consent to participate in the present study. The patients with ACS were recruited by 1 cardiologist (J.G.), according to their meeting inclusion criteria and their willingness to participate at both visits, 1 and 12 weeks later. We examined 4 groups of subjects, men and women aged 18 to 80 years. Group 1 included subjects with an ACS according to current criteria, with samples taken within 72 hours of symptom onset (n = 20; ACS1 group). The diagnosis of ACS was confirmed by clinical assessment by a cardiologist (J.G.), including electrocardiographic changes (non–ST- and ST-segment elevation acute myocardial infarction), troponin I elevation, and the presence of CAD on the coronary angiogram. The same patients were sampled 12 week after the onset of ACS (none of the patients had undergone coronary artery bypass grafting; ACS2 group; n = 20). We chose the 12-week point because most of the metabolic, lipoprotein, and inflammatory abnormalities will have resolved by that pointhen. Two comparison groups were then selected. Group 3 consisted of patients with chronic, stable CAD who had been followed up in the lipid clinic for ≥6 months after a cardiovascular event. Group 4 consisted of age-matched (within 5 years) healthy subjects without CAD as documented by coronary angiography who were awaiting elective aortic or mitral valve replacement or repair (controls). None of the control subjects were receiving statin therapy. All subjects with stable CAD continued with statin therapy at the time of sampling, according to current guidelines and ethics requirements. Exclusion criteria included a refusal to participate, an inability to return for the 12-week follow-up visit, hemodynamic instability requiring vasopressor support, the use of mechanical ventricular assist devices, the need for coronary artery bypass grafting, the lack of documented atherosclerotic CAD, uncontrolled hypertension, triglycerides ≥5 mmol/L, severe obesity (body mass index ≥35 kg/m 2 ), alcohol intake >21 drinks/wk, and presence of thyroid, hepatic, or renal disease. The subjects were excluded if they had autoimmune disease or any chronic or acute infectious or inflammatory illness. The Research Ethics Board of the McGill University Faculty of Medicine reviewed and approved the research protocol of the present study (registered with ClinicalTrials.Gov , NCT01278875 ).
The cholesterol and triglyceride concentrations were determined enzymatically on an autoanalyzer (Cobas Mira, Roche, New York, New York). Low-density lipoprotein cholesterol concentrations were calculated using the Friedewald formula. Apolipoprotein A-I, apolipoprotein B, and high-sensitivity C-reactive protein concentrations were determined by nephelometry (CSL Behring, Ottawa, Ontario). An enzyme-linked immunosorbent assay kit was used to measure the SAA levels (Human SAA ELISA kit, Abcam, Toronto, Ontario, Canada). Purified human SAA1 was used as the standard, and the test was performed according to the manufacturer’s instructions.
Blood was collected from the study subjects and controls by venipuncture; plasma was separated (2,000 g , 4°C for 20 minutes) and frozen at −80°C in 0.5-ml aliquots. Efflux assays were performed using apolipoprotein B-depleted plasma. Apolipoprotein B-containing lipoproteins were precipitated with polyethylene glycol 20% (40:100 plasma, vol/vol) and diluted to 2.8% in minimal essential medium-HEPES (0.5 ml/well). A standard was prepared by obtaining a pool obtained from 6 healthy donors and stored at −80°C until use.
Mouse-derived peritoneal macrophages J774 cells were purchased from American Type Culture Collection (ATCC TIB-67, Cedarlane, Burlington, Ontario, Canada). The cells were maintained in Roswell Park Memorial Institute medium with 10% fetal bovine serum and antibiotics in 5% carbon dioxide, plated in 24-multiwell plates (150,000 cells/well), and labeled with 0.5 ml/well of 2 μCi/ml 3 [H]-cholesterol (Roswell Park Memorial Institute medium/1% fetal bovine serum for 24 hours) in the presence of the acyl-coenzyme A:cholesterol acyltransferase inhibitor (2 μg/ml, Sandoz, Sigma-Aldrich, Oakville, Ontario, Canada). The adenosine triphosphate binding cassette transporter A1 (ABCA1) was upregulated for 18 hours in the presence 0.3 mM 8-(4-Chlorophenylthio)-cyclic adenosine monophosphate (Sigma-Aldrich, Oakville, Ontario, Canada) in Roswell Park Memorial Institute medium containing 0.2% bovine serum albumin. The experiments were performed in batches with several controls for standardization. Cholesterol efflux from nonstimulated cells was used to control for induction efficiency and to determine the diffusional efflux. The diffusional efflux was subtracted from the total efflux to determine the net efflux. As an additional control, efflux to lipid-free apolipoprotein A-I (10 μg/ml) was determined in stimulated and nonstimulated cells. Efflux was the fraction of total cellular cholesterol released within 6 hours to apolipoprotein B-depleted plasma. After the time-course experiments, the maximum efflux capacity was reached by 6 hours. This point was selected for the present study. Dose–response experiments showed that a concentration of 2.8% apolipoprotein B-depleted plasma provided optimal cholesterol release from J774 (data not shown). Dialyzing (phosphate-buffered saline) polyethylene glycol-precipitated HDL made no difference on cellular cholesterol efflux. Liquid scintillation counting (Perkin Elmer, Montreal, Ontario, Canada) was used to quantify the efflux of radioactive cholesterol (as determined by cpm – counts per minutes of 3[H] measurement) from the cell according to the following formula: percentage of cholesterol efflux = [ 3 H]-cpm medium /([ 3 H]-cpm medium + [ 3 H]-cpm cells ) × 100%. Each sample was run in triplicate, with a mean coefficient of variation of 3.72%. To correct for interassay variations across the plates, a pooled serum control from 6 healthy volunteers (3 men and 3 women) was included on each plate. Cholesterol efflux values are expressed as a percentage of the pooled normal control values set at 100%.
The results of lipid analyses and efflux assays are presented as the mean ± SD. The graphic data are expressed as the mean ± standard error of the mean. An analysis of the correlation between cholesterol efflux and the clinical and HDL-related variables was assessed using Pearson’s correlation coefficients. The paired Student’s t test was used to compare the differences between the ACS1 group and the other groups; p <0.05 was considered statistically significant.
Results
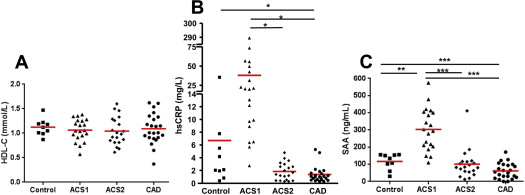
We examined 52 subjects, of whom 20 were patients with an ACS sampled within 72 hours of symptom onset (ACS1) and, again, 12 weeks later (ACS2). We included 23 patients with chronic, stable CAD, who were matched for age, gender, and HDL cholesterol levels, and 9 healthy controls, without CAD on the coronary angiogram and closely matched for HDL cholesterol level ( Figure 1 ). The characteristics of the study subjects are listed in Table 1 . The HDL cholesterol levels were similar among the 4 groups: ACS1 1.06 ± 0.22 mmol/L (41 ± 9 mg/dl); ACS2 1.04 ± 0.28 mmol/L (40 ± 11 mg/dl); stable CAD 1.10 ± 0.30 mmol/L (42 ± 11 mg/dl), and controls 1.11 ± 0.2 mmol/L (43 ± 8 mg/dl). None of these were significantly different among the 4 groups. The total HDL protein levels were significantly lower in the ACS1 group (1.74 ± 0.74 μg/μl), ACS2 group (1.60 ± 0.62 μg/μl), and CAD group (1.75 ± 0.58 μg/μl) compared with that in the controls (2.27 ± 0.36 μg/μl; p <0.05). We measured high-sensitivity C-reactive protein and SAA as indexes of systemic inflammation. The mean ± SD high-sensitivity C-reactive protein level was 37.95 ± 62.62, 1.85 ± 1.35, 1.50 ± 1.32, and 6.70 ± 11.04 mg/L for the ACS1, ACS2, CAD, and control group, respectively ( Table 1 ). Unexpectedly, 1 healthy control subject had an elevated high-sensitivity C-reactive protein level (35.45 mg/L); no underlying cause was identified from the history and physical examination findings. The high-sensitivity C-reactive protein level was significantly higher in the ACS1 group than in the ACS2 and stable CAD groups (p <0.05). The SAA levels were significantly increased in the ACS1 group (303 ± 124 ng/ml) compared with the ACS2 group (101 ± 86 ng/ml), stable CAD group (62 ± 46 ng/ml), and control group (117 ± 46 ng/ml; Figure 2 and Table 1 ). The peak troponin I level was 54 ± 60 μg/L in the ACS1 group (reference range <0.06 μg/L), indicating acute myocardial injury.

| Variable | ACS1 (n = 20) | ACS2 (n = 20) | CAD (n = 23) | Controls (n = 9) |
|---|---|---|---|---|
| Age (yrs) | 58.1 ± 8.9 | 58.3 ± 8.8 | 61.6 ± 9.5 | 56.2 ± 17.5 |
| Male gender | 16 (80) | 16 (80) | 21 (91) | 8 (89) |
| Hypertension | 5 | 5 | 10 | 5 |
| ACS NSTEMI/STEMI | 4/16 | 4/16 | 6/15 | 0/0 |
| Smoking | 7 (35) | 7 (35) | 2 (9) | 0 |
| Diabetes | 5 (25) | 5 (25) | 2 (7) | 0 |
| BMI (kg/m 2 ) | 27.3 ± 4.2 | 27.5 ± 4.3 | 27.8 ± 3.6 | 34.0 ± 6.4* |
| Total cholesterol (mmol/L; mg/dl) | 4.24 ± 0.87 (164.0 ± 33.6) | 3.12 ± 0.63 (120.5 ± 24.4) † | 3.86 ± 0.61 (149.4 ± 23.7) | 5.10 ± 0.80 (197.2 ± 31.1) ‡ |
| TG (mmol/L; mg/dl) | 1.56 ± 0.89 (138.4 ± 79.0) | 1.12 ± 0.44 (99.4 ± 39.2) ‡ | 1.52 ± 0.97 (134.7 ± 85.7) | 2.16 ± 0.77 (191.1 ± 68.1) |
| HDL cholesterol (mmol/L; mg/dl) | 1.06 ± 0.22 (41.1 ± 8.7) | 1.04 ± 0.28 (40.4 ± 11.0) | 1.10 ± 0.30 (42.5 ± 11.5) | 1.11 ± 0.20 (43.0 ± 7.8) |
| LDL cholesterol (mmol/L; mg/dl) | 2.47 ± 0.70 (95.5 ± 27.1) | 1.56 ± 0.39 (60.4 ± 15.2) † | 2.08 ± 0.43 (80.2 ± 16.8) ‡ | 3.01 ± 0.58 (116.2 ± 22.5) |
| apoA-I (g/L) | 1.23 ± 0.25 | 1.28 ± 0.25 | 1.38 ± 0.26 | 1.44 ± 0.13 ‡ |
| apoB (g/L) | 0.91 ± 0.30 | 0.62 ± 0.11 † | 0.76 ± 0.14 ‡ | 0.98 ± 0.20 |
| hs-CRP (mg/L) | 37.95 ± 62.62 | 1.85 ± 1.35 ‡ | 1.50 ± 1.32 ‡ | 6.70 ± 11.04 |
| SAA (ng/ml) | 303.3 ± 123.7 | 100.8 ± 85.6 † | 61.6 ± 45.8 † | 116.8 ± 46.2 † |
| Statin | 6 (30) | 6 (30) | 23 (100) | 0 |
| Cholesterol efflux | 16.9 ± 2.8 | 17.0 ± 3.2 | 15.4 ± 7.0 | 25.9 ± 6.1 † |

The low-density lipoprotein cholesterol levels in the 4 groups are listed in Table 1 . The plasma levels of low-density lipoprotein cholesterol differed among the 4 groups. Those with ACS were receiving various doses of statins at clinical presentation, but all the patients in the ACS2 group were treated according to current guidelines and were receiving high-dose statins, just as were those with stable CAD. By design, the control subjects were not taking statins. High-dose statin therapy (predominantly atorvastatin 40 to 80 mg/day) lowered the low-density lipoprotein cholesterol levels in the ACS2 group (p <0.001) and stable CAD group (p <0.05) compared with the levels in the ACS1 group.
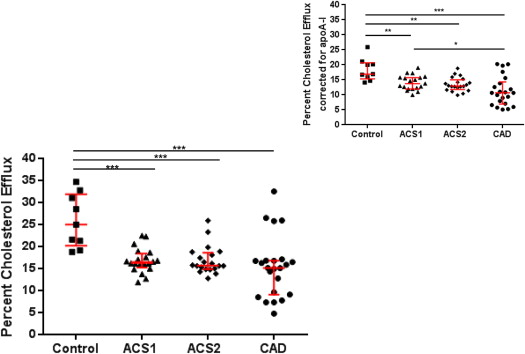
Cellular cholesterol efflux was determined according to the method of Khera et al, with minor modifications, using apolipoprotein B-depleted plasma. This technique determines HDL-mediated cellular cholesterol efflux, without having to use ultracentrifugation to isolate the HDL. The cellular cholesterol efflux capacity of HDL from the ACS1 group was significantly lower relative to that in the controls (p <0.001; Table 1 ). The cellular cholesterol efflux capacity was similarly reduced in the ACS1, ACS2, and stable CAD groups compared with the control group (p <0.001). This suggests that after an ACS, HDL-mediated cellular efflux capacity is reduced acutely and remains impaired. We calculated the change in HDL cholesterol between ACS1 and ACS2 and the change in efflux capacity [change in HDL cholesterol (HDL ACS1 −HDL ACS2 )/HDL ACS1 ]. The mean ± SD for the change in HDL was −0.015 ± 0.35 mmol/L. Similarly, the change in efflux was −0.014 ± 0.14%, indicating very little intervariability between the ACS1 and ACS2 groups.
The patients were matched for HDL cholesterol levels to remove the potential bias of differences in HDL cholesterol among the 4 groups. The ACS1 and ACS2 groups had lower cholesterol efflux values than the control group and slightly higher values than those with stable CAD. These results were not significantly altered when the efflux values were corrected for the apolipoprotein A-I levels ( Figure 3 ). Correcting for apolipoprotein A-I provided a rough index of the “per HDL particle efflux.”

The correlation between HDL-mediated cellular cholesterol and HDL cholesterol levels is provided in Table 2 . All assays were grouped (ACS1, n = 20; ACS2, n = 20; stable CAD, n = 23; and controls, n = 9). The correlation between HDL cholesterol and cholesterol efflux (r = 0.233; r 2 = 0.054; p = 0.049) indicates that only 5% of the variance in efflux can be attributed to the plasma HDL cholesterol levels. In subjects with an HDL cholesterol level of 1.0 mmol/L (39 mg/dl), the efflux values varied within a fivefold range (from ∼7% to 35%). More specifically, correlation coefficients were plotted in Figure 4 , depicting ACS1, ACS2, CAD, and controls separately. The best values (r = 0.55; r 2 = 0.30; p = 0.01) were found in the CAD group, indicating that only 30% of the variance in efflux can be attributed to the plasma HDL cholesterol levels ( Figure 4 ).


