The SYNergy between percutaneous intervention with TAXus drug-eluting stents and cardiac surgery (SYNTAX) score (SS) is an effective angiographic predictor of clinical outcomes in patients with multivessel coronary artery disease (MVD) undergoing percutaneous coronary intervention. It is not known whether this relation is independent of the number of diseased vessels. The aim of the present study was to assess the relation between the SS and major adverse cardiac events (MACE) in patients with single-vessel disease (SVD) and MVD undergoing percutaneous coronary intervention. In the ACUITY trial, the SS was determined in 2,627 patients undergoing percutaneous coronary intervention. The relation between the SS and the 1-year clinical outcomes was assessed according to SS tertiles: <5 (n = 441), ≥5 but <10 (n = 525), and ≥10 (n = 495) for SVD and <10 (n = 361), ≥10 but <18 (n = 401), and ≥18 (n = 404) for MVD. At 1 year of follow-up, the rate of MACE was 16.8%, 24.7%, and 23.7% for patients with MVD in the first, second and third tertiles, respectively (p = 0.02). The corresponding rates for those with SVD was 13.3%, 15.3%, and 19.1% (p = 0.01). In the patients with MVD, the SS independently predicted 1-year MACE (hazard ratio 1.02, 95% confidence interval 1.01 to 1.03; p = 0.002), myocardial infarction (hazard ratio 1.02, 95% confidence 1.00 to 1.04; p = 0.02), and cardiac death (hazard ratio 1.05, 95% confidence interval 1.02 to 1.09; p = 0.005). In patients with SVD, the SS independently predicted 1-year MACE (hazard ratio 1.03, 95% confidence interval 1.01 to 1.05; p = 0.0009) and myocardial infarction (hazard ratio 1.05, 95% confidence interval 1.02 to 1.07; p = 0.002). In the overall study cohort, the SS was an independent predictor of MACE and death, and MVD (vs SVD) was not. In conclusion, the SS is a useful angiographic predictive tool for patients with SVD and MVD.
The SYNergy between percutaneous intervention with TAXus drug-eluting stents and cardiac surgery (SYNTAX) score (SS) is an angiographic scoring system developed during the SYNTAX trial for risk stratification of patients according to the complexity of the coronary anatomy. It has been shown to be an effective angiographic tool for predicting the risk of major adverse cardiac events (MACE), mostly in stable patients with multivessel coronary artery disease (MVD) and those with unprotected left main disease undergoing percutaneous coronary intervention (PCI). Accordingly, SS has been incorporated in a daily practice when facing complex coronary artery disease dilemma. More recently, its application has been extended to a variety of other clinical setting including an all-comers population and in patients with ST-segment elevation myocardial infarction undergoing primary PCI. Although we have recently demonstrated the prognostic value of the SS in a broad range of patients with non–ST-segment elevation acute coronary syndromes enrolled in the Acute Catheterization and Urgent Intervention Triage StrategY (ACUITY) trial treated with PCI, the usefulness of the SS to predict clinical events in patients with single-vessel disease (SVD) has never been investigated. The aim of the present study was to assess the effect of the SS on ischemic outcomes in patients with SVD undergoing PCI compared with those with MVD from the large-scale, multicenter, prospective, randomized ACUITY trial.
Methods
The design and primary results of the ACUITY trial have been previously reported ( ClinicalTrials.gov identifier NCT00093158 ). In brief, 13,819 patients with moderate- and high-risk non–ST-segment elevation acute coronary syndromes undergoing an early invasive management strategy were randomly assigned to heparin plus glycoprotein IIb-IIIa inhibitors, bivalirudin plus glycoprotein IIb-IIIa inhibitors, or bivalirudin monotherapy before coronary angiography. Clinical follow-up examinations were performed at 30 days and 1 year. All MACE were adjudicated by an independent clinical events committee. Retrospectively, all stent thrombosis events were re-adjudicated using the Academic Research Consortium definitions. As a part of the present study, only PCI patients who had undergone quantitative coronary angiography (Cardiovascular Research Foundation, New York, New York) within the formal angiographic substudy of the ACUITY trial were included. In the ACUITY trial, quantitative coronary angiography was performed in 6,921 patients, including 3,664 PCI patients. After excluding those patients with a history of previous coronary artery bypass grafting (n = 862) and patients for whom the SS could not be calculated for technical reasons (n = 338), 2,627 patients remained available for analysis. Patients with infarct-related occluded arteries were considered to have total occlusion of undetermined duration. Lesions with in-stent restenosis were scored as de novo lesions. The SS was retrospectively calculated by 3 experienced interventional cardiologists who were unaware of the treatment assignment and clinical outcomes. To assess interobserver reproducibility among the 3 readers, a Fleiss kappa statistic value for multiple readers (tertile partitioning) was determined. Each lesion with ≥50% diameter stenosis in vessels ≥1.5 mm was scored using the SS algorithm, which has been fully described previously (available at: www.syntaxscore.com ). The Fleiss Kappa statistic (tertile partitioning), determined for the 3 readers from 50 films read independently, was 0.57, indicating that interobserver reproducibility was comparable to that previously reported from the SYNTAX trial. Continuous variables are expressed as the mean ± SD and were compared using the Student t test or the Mann-Whitney rank sum test, as appropriate. Categorical variables are presented as percentages and numbers per total and were compared using the chi-square test or Fisher’s exact test. Patients with SVD and MVD were separately grouped into SS tertiles. The 1-year outcomes were summarized as Kaplan-Meier estimates and compared using the log-rank test and hazards ratios. Stepwise Cox multivariate regression analyses were performed to assess the association between the SS and 1-year MACE, all-cause mortality, cardiac mortality, myocardial infarction, and target vessel revascularization in patients with SVD and MVD. Potential predictors were entered into the model with entry and stay criteria of 0.1. The following baseline and procedure variables were included in the models: SS (as a continuous variable), age, male gender, diabetes, renal insufficiency, left ventricular ejection fraction, baseline troponin elevation, ST-segment deviation, previous myocardial infarction, and previous PCI. The numbers of independent variables included in the models were carefully chosen to avoid overfitting (i.e., having too many covariates relative to the number of observations). To evaluate the predictive value of the SS compared with the number of diseased vessels disease, MVD versus SVD, as a covariate, was forced into the model of the 1-year clinical outcome for the entire population. All statistical tests were performed using Statistical Analysis Systems software, version 9.1 (SAS Institute, Cary, North Carolina), and p <0.05 denoted statistical significance.
Results
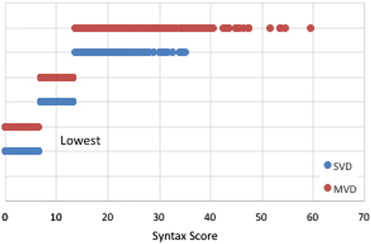
In the present analysis, SS was determined in 2,627 PCI patients, including 1,461 patients (55.6%) with SVD and 1,166 (44.4%) with MVD. For the patients with MVD, the median SS was 14, and was 7 for the patients with SVD. Figure 1 shows the distribution of the SS in those with SVD and MVD according the tertiles for the entire population (i.e., lowest [<7], middle [7 to 13], and highest [>13] SS). The baseline characteristics of the patients with SVD and MVD are listed in Table 1 . Patients with MVD had more co-morbidities and less favorable coronary anatomy. No significant differences were found in the in-hospital antithrombotic medication use between the 2 groups.
| Variable | SVD (n = 1,461) | MVD (n = 1,166) | p Value |
|---|---|---|---|
| Age (yrs) | 59.00 [51.00–68.00] (1,461) | 61.00 [53.00–71.00] (1,166) | <0.0001 |
| Men | 65.9 (962/1,461) | 69.6 (811/1,166) | 0.05 |
| Weight (kg) | 86.26 [75.82–99.88] | 86.13 [75.00–100.33] | 0.70 |
| Diabetes mellitus | 25.3 (368/1,456) | 32.5 (376/1,158) | <0.0001 |
| Insulin-requiring | 7.2 (104/1,456) | 8.6 (100/1,158) | 0.16 |
| Hypertension | 64.3 (934/1,454) | 67.2 (783/1,165) | 0.12 |
| Hyperlipidemia | 57.1 (818/1,435) | 55.1 (635/1,153) | 0.32 |
| Current smoking | 36.8 (535/1,455) | 33.4 (389/1,163) | 0.08 |
| Previous MI | 27.4 (392/1,430) | 31.2 (357/1,146) | 0.04 |
| Previous PCI | 45.6 (664/1,457) | 42.1 (491/1,166) | 0.07 |
| Renal insufficiency | 13.5 (184/1,360) | 17.9 (197/1,098) | 0.003 |
| Baseline cardiac biomarker elevation | 56.7 (763/1,346) | 64.5 (707/1,096) | <0.0001 |
| Baseline troponin elevation | 58.2 (717/1,231) | 63.7 (662/1,039) | 0.008 |
| ST-segment deviation ≥1 mm | 24.5 (358/1,461) | 26.5 (309/1,166) | 0.26 |
| TIMI risk score | |||
| Low (0–2) | 16.8 (204/1,211) | 15.3 (141/920) | 0.37 |
| Intermediate (3–4) | 60.5 (733/1,211) | 57.4 (528/920) | 0.15 |
| High (5–7) | 22.6 (274/1,211) | 27.3 (251/920) | 0.01 |
| Left ventricular ejection fraction | 55.00 [50.00–60.00] (1,147) | 55.00 [45.00–60.00] (936) | <0.0001 |
| Target coronary artery | |||
| Left anterior descending | 40.8 (579/1,418) | 47.9 (532/1,110) | 0.0004 |
| Right | 34.9 (495/1,418) | 45.9 (509/1,110) | <0.0001 |
| Left circumflex | 26.2 (372/1,418) | 46.0 (511/1,110) | <0.0001 |
| Other | 0.0 (0/1,418) | 0.2 (2/1,110) | 0.19 |
| Coronary angioplasty vessels per patient (n) | 1.02 ± 0.14 (1,418) | 1.40 ± 0.53 (1,110) | <0.0001 |
| Narrowings per patient (n) | 3.03 ± 1.84 (1,459) | 4.61 ± 2.08 (1,164) | <0.0001 |
| Extent of disease (mm) | 27.07 [16.50–43.00] (1,426) | 43.00 [29.00–63.25] (1,153) | <0.0001 |
| All final TIMI flow 3 | 97.2 (1,407/1,447) | 95.9 (1,497/1,561) | 0.05 |
| All final TIMI 3 and all Blush 3 | 77.9 (1,127/1,447) | 73.9 (1,154/1,561) | 0.01 |
| DES use | 84.8 (1,238/1,461) | 85.0 (991/1,166) | 0.91 |
| BMS use | 11.2 (164/1,461) | 17.6 (205/1,166 | <0.0001 |
| Both DES and BMS use | 32.7 (477/1,461) | 9.2 (107/1,166) | <0.0001 |
| Total stents used (n) | 1.03 ± 0.44 (1,461) | 1.55 ± 0.86 (1,166) | <0.0001 |
| Target lesion | |||
| Baseline reference vessel diameter (mm) | 2.77 ± 0.55 (1,661) | 2.72 ± 0.54 (1,776) | 0.008 |
| Baseline minimal luminal diameter (mm) | 0.72 ± 0.48 (1,661) | 0.71 ± 0.45 (1,776) | 0.0008 |
| Final minimal luminal diameter (mm) | 2.35 ± 0.56 (1,659) | 2.29 ± 0.56 (1,760) | 0.001 |
| Final diameter stenosis (%) | 16.67 ± 11.29 (1,659) | 17.19 ± 12.36 (1,760) | 0.20 |
| Antithrombotic medication ∗ | |||
| Bivalirudin | 64.7 (945/1,461) | 66.9 (780/1,166) | 0.25 |
| Unfractionated heparin | 20.4 (298/1,461) | 18.8 (219/1,166) | 0.30 |
| Enoxaparin | 13.2 (192/1,461) | 13.4 (156/1,166) | 0.86 |
| Glycoprotein IIb-IIIa inhibitors | 32.7 (477/1,461) | 32.6 (380/1,166) | 0.97 |
| Aspirin | 98.5 (1,435/1,458) | 98.4 (1,142/1,161) | 0.87 |
| Thienopyridine | 32.7 (477/1,456) | 58.3 (675/1,157) | 0.45 |
The clinical outcomes stratified according to SS tertile in patients with SVD and MVD are listed in Table 2 and shown in Figures 2 and 3 .
| Variable | SYNTAX Score | Overall p Value | ||
|---|---|---|---|---|
| SVD | <5 | ≥5 but <10 | ≥10 | |
| MACE | 13.4 (54) | 15.3 (77) | 19.1 (93) | 0.01 |
| Death/MI | 5.5 (24) | 8.5 (43) | 11.6 (57) | 0.003 |
| Death | 1.2 (5) | 1.4 (7) | 2.2 (11) | 0.35 |
| Cardiac death | 0.2 (1) | 0.4 (2) | 1.2 (6) | 0.11 |
| MI | 4.4 (19) | 7.7 (39) | 10.5 (51) | 0.002 |
| Q-wave | 0.5 (2) | 1.4 (7) | 1.6 (8) | 0.23 |
| Non–Q-wave | 3.9 (17) | 6.4 (32) | 8.8 (43) | 0.008 |
| TVR | 6.9 (26) | 7.2 (36) | 7.8 (37) | 0.57 |
| Definite or probable stent thrombosis | 0.2 (1) | 0.6 (3) | 2.1 (10) | 0.01 |
| MVD | <10 | ≥10 but <18 | ≥18 | |
| MACE | 16.8 (59) | 24.7 (97) | 23.7 (94) | 0.02 |
| Death/MI | 7.0 (25) | 17.8 (70) | 14.9 (59) | 0.0001 |
| Death | 1.4 (5) | 4.2 (16) | 4.6 (18) | 0.05 |
| Cardiac death | 0.6 (2) | 2.6 (10) | 3.2 (13) | 0.04 |
| MI | 6.2 (22) | 15.2 (60) | 12.1 (48) | 0.0006 |
| Q-wave MI | 0.9 (3) | 2.6 (10) | 3.3 (13) | 0.07 |
| Non–Q-wave MI | 5.3 (19) | 12.9 (51) | 8.9 (35) | 0.002 |
| TVR | 6.4 (22) | 10.0 (39) | 10.4 (40) | 0.10 |
| Definite or probable stent thrombosis | 1.1 (4) | 2.0 (8) | 3.8 (15) | 0.05 |
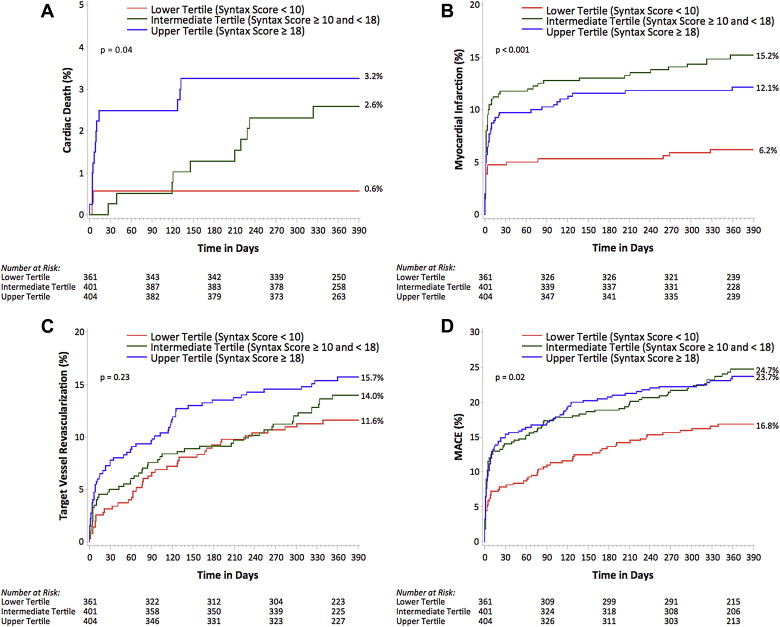
Compared with patients in the first and second tertile, those in the third tertile had a greater incidence of MACE (13.4%, 15.3%, and 19.1%, respectively; p trend = 0.01), death or myocardial infarction (5.5%, 8.5%, and 11.6%, respectively; p trend = 0.003), myocardial infarction (4.4%, 7.7%, and 10.5%, respectively; p trend = 0.002), and probable or definite stent thrombosis (0.2%, 0.6%, and 2.1%, respectively; p trend = 0.01). Compared with patients in the lowest tertile, those in the intermediate and upper tertiles had a greater incidence of MACE (16.8%, 24.7%, and 23.7%, respectively; p trend = 0.02), death or myocardial infarction (7.0%, 17.8%, and 14.9%, respectively; p trend = 0.003), all-cause death (1.4%, 4.2%, and 4.6%, respectively; p = 0.046), cardiac death (0.6%, 2.6%, and 3.2%, respectively; p trend = 0.04), myocardial infarction (6.2%, 15.2%, and 12.1%, respectively; p trend = 0.002), and probable or definite stent thrombosis (1.1%, 2.0%, and 3.8%, respectively; p trend = 0.05). The data shown in Figure 4 compare the incidence of MACE in those with SVD and MVD in each tertile of the overall population. The rates of MACE in the highest SS tertile were similar among those with SVD and MVD.
The SS was an independent predictor of MACE, all-cause death, cardiac death, myocardial infarction, and target vessel revascularization in the overall population ( Table 3 ). Even after including the number of diseased vessels (MVD vs SVD) in the model, the SS remained a powerful predictor of ischemic events, but MVD was not. After adjusting for possible confounders, the SS was also an independent predictor of ischemic events in those with SVD and in those with MVD, separately ( Table 4 ).
| HR (95% CI) | p Value | |
|---|---|---|
| MACE | ||
| MVD vs SVD | 1.19 (0.97–1.46) | 0.09 |
| SYNTAX score (1-point increment) | 1.03 (1.01–1.04) | <0.0001 |
| Diabetes | 1.25 (1.03–1.53) | 0.02 |
| Renal insufficiency | 1.59 (1.27–1.99) | <0.0001 |
| Previous PCI | 1.44 (1.19–1.74) | 0.0002 |
| All-cause death | ||
| MVD vs SVD | 1.37 (0.71–2.65) | 0.34 |
| SYNTAX score (1-point increment) | 1.03 (1.00–1.06) | 0.03 |
| Age (10-yr increment) | 1.80 (1.38–2.33) | <0.0001 |
| Diabetes | 2.23 (1.25–3.98) | 0.007 |
| Left ventricular ejection fraction | 0.97 (0.95–1.00) | 0.019 |
| Cardiac death | ||
| MVD vs SVD | 2.16 (0.82–5.71) | 0.12 |
| Syntax score (1-point increment) | 1.05 (1.01–1.08) | 0.006 |
| Age (10-yr increment) | 1.45 (1.05–2.01) | 0.02 |
| Diabetes | 2.21 (1.03–4.71) | 0.04 |
| Left ventricular ejection fraction | 0.96 (0.93–0.99) | 0.005 |
| Myocardial infarction | ||
| MVD vs SVD | 1.33 (1.00–1.78) | 0.05 |
| SYNTAX score (1-point increment) | 1.03 (1.01–1.04) | 0.0006 |
| Age (10-yr increment) | 0.85 (0.74–0.97) | 0.01 |
| Renal insufficiency | 2.63 (1.83–3.77) | <0.0001 |
| Previous PCI | 1.40 (1.04–1.89) | 0.03 |
| Baseline troponin elevation or ST-segment deviation | 1.48 (1.04–2.09) | 0.03 |
| Target vessel revascularization | ||
| MVD vs SVD | 1.25 (0.97–1.61) | 0.09 |
| SYNTAX score (1-point increment) | 1.03 (1.01–1.04) | <0.0001 |
| Age (10-yr increment) | 0.81 (0.72–0.91) | 0.0005 |
| Renal insufficiency | 1.67 (1.17–2.38) | 0.005 |
| Previous PCI | 1.89 (1.49–2.41) | <0.0001 |
Stay updated, free articles. Join our Telegram channel

Full access? Get Clinical Tree


