Hemodynamics of Normal and Abnormal Arteries
R. Eugene Zierler
An in-depth understanding of the major diseases that affect the arterial system and the diagnostic methods that can be applied to them requires some knowledge of the basic principles that govern pressure and flow. The major mechanisms of arterial disease are obstruction of the lumen and disruption of the vessel wall. Arterial stenosis or occlusion may result from atherosclerosis, emboli, thrombi, fibromuscular dysplasia, trauma, or external compression. The clinical significance of a particular obstructive lesion depends on its location, severity, and duration, as well as the ability of the circulation to compensate by developing collateral pathways. Disruption of the arterial wall is typically caused by ruptured aneurysms or trauma. Because these pathologic mechanisms tend to involve the large and medium-sized arteries, the techniques for identification of arterial disease by duplex scanning have focused on these segments of the arterial system. Although some vascular disorders involve the small arteries and microcirculation, these are best examined by indirect physiologic tests.
When a patient with arterial disease first presents, the health care provider needs to answer certain questions, regardless of the underlying disorder. In the presence of arterial obstruction, it is important to know the overall severity of ischemia, as well as the location and relative severity of the responsible lesions. For aneurysmal disease, the key question usually relates to the size and location of the lesion. A combination of indirect physiologic tests and direct duplex imaging can provide the necessary diagnostic information for initial diagnostic and therapeutic decisions. Because duplex scanning assesses both vascular anatomy and flow characteristics at specific arterial sites, this approach is ideally suited for evaluation of the most common arterial problems.
PRESSURE AND FLOW IN NORMAL ARTERIES
Fluid Energy
Although pressure gradients are the most obvious forces involved, blood flows through the arterial system in response to differences in total fluid energy. The pressure in a fluid system is defined as force per unit area, with units such as dynes per square centimeter or millimeters of mercury (mm Hg). Intravascular arterial pressure (P) has three components: (1) dynamic pressure produced by cardiac contraction, (2) hydrostatic pressure, and (3) static filling pressure. Hydrostatic pressure depends on the specific gravity of blood and the height of the point of measurement above or below a specific reference level, generally considered to be the right atrium. The hydrostatic pressure is given by
where ρ is the specific gravity of blood (˜1.056 g/cm3), g is the acceleration due to gravity (980 cm/s2), and h is the distance in centimeters above or below the right atrium. The magnitude of hydrostatic pressure may be relatively large. For example, in a man 5 feet 8 inches tall, the hydrostatic pressure at ankle level is approximately 90 mm Hg. The static filling pressure is usually in the range of 5 to 10 mm Hg and represents the residual pressure that exists in the absence of arterial flow; it is determined by the volume of blood and the elastic properties of the vessel wall.
Total fluid energy (E) consists of potential energy (Ep) and kinetic energy (Ek). The components of potential energy are intravascular pressure (P) and gravitational potential energy. Gravitational potential energy represents the ability of blood to do work because of its height above a specific reference level. The formula for gravitational potential energy is the same as that for hydrostatic pressure (Eq. 1) but with an opposite sign: +ρgh. Because the static filling pressure is relatively low, and the gravitational potential energy and hydrostatic pressure usually cancel each other out, the predominant component of potential energy is the dynamic pressure of cardiac contraction. Potential energy can be expressed as
Kinetic energy represents the ability of blood to do work on the basis of its motion. It is proportional to the specific gravity of blood and the square of blood velocity (v):
When fluid flows from one point to another, its total energy (E) remains constant, provided that flow is steady and there are no frictional energy losses. This is in accordance with the law of conservation of energy and constitutes Bernoulli’s principle. In the horizontal diverging tube shown in Figure 5.1, steady flow
between point 1 and point 2 is accompanied by an increase in cross-sectional area and a decrease in flow velocity. The widening of the tube results in conversion of kinetic energy to potential energy in the form of pressure. Although the fluid moves against a pressure gradient of 2.5 mm Hg and therefore gains potential energy, the total fluid energy remains constant because of the decrease in velocity and a proportional loss of kinetic energy. The situation depicted in Figure 5.1 does not occur in human arteries because the required ideal flow conditions are not present. The fluid energy lost in moving blood through the arterial circulation is dissipated mainly in the form of heat.
between point 1 and point 2 is accompanied by an increase in cross-sectional area and a decrease in flow velocity. The widening of the tube results in conversion of kinetic energy to potential energy in the form of pressure. Although the fluid moves against a pressure gradient of 2.5 mm Hg and therefore gains potential energy, the total fluid energy remains constant because of the decrease in velocity and a proportional loss of kinetic energy. The situation depicted in Figure 5.1 does not occur in human arteries because the required ideal flow conditions are not present. The fluid energy lost in moving blood through the arterial circulation is dissipated mainly in the form of heat.
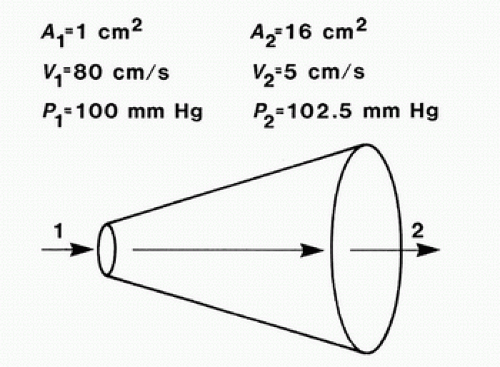 FIGURE 5.1. Effect of increasing cross-sectional area on pressure and velocity in an idealized frictionless fluid system. Flow is from left to right. While pressure increases between point 1 and point 2, total fluid energy remains constant as a result of a decrease in velocity. (Redrawn from Sumner DS. The hemodynamics and pathophysiology of arterial disease. In Rutherford RB (ed). Vascular Surgery. Philadelphia: WB Saunders, 1977.) |
Poiseuille’s Law and Vascular Resistance
Energy losses in flowing blood occur either as viscous losses resulting from friction or as inertial losses related to changes in the velocity or direction of flow. The term viscosity describes the resistance to flow that arises because of the intermolecular attractions between fluid layers. Fluids with particularly strong intermolecular attractions offer a high resistance to flow and have high coefficients of viscosity. Because blood viscosity increases exponentially with increases in hematocrit, the concentration of red blood cells is the most important factor affecting the viscosity of whole blood. The viscosity of plasma is determined largely by the concentration of plasma proteins. Poiseuille’s law describes the viscous energy losses that occur in an idealized flow model. This law states that the pressure gradient along a tube (P1 – P2) is directly proportional to the mean flow velocity ([v with bar above]) or volume flow (Q), the tube length (L), and the fluid viscosity (η) and is inversely proportional to either the second or the fourth power of the radius (r):
This equation is often simplified to: pressure = flow × resistance, where Q is flow and
is the resistance term. The hemodynamic resistance of an arterial segment increases as the flow velocity increases, provided the lumen size remains constant. These additional energy losses are related to inertial effects or changes in kinetic energy and are proportional to the square of blood velocity (Eq. 3).
The strict application of Poiseuille’s law requires steady laminar flow in a straight, rigid, cylindrical tube. Because these conditions seldom exist in the arterial circulation, Poiseuille’s law can only estimate the minimum pressure gradient or viscous energy losses that may be expected in arterial flow. Energy losses due to inertial effects often exceed viscous energy losses, particularly in the presence of arterial disease. In the human circulation, approximately 90% of the total vascular resistance results from flow through the arteries and capillaries, whereas the remaining 10% results from venous flow. The arterioles and capillaries are responsible for over 60% of the total resistance, whereas the large and medium-sized arteries account for only about 15%.1 Therefore, the arteries that are most commonly affected by atherosclerotic occlusive disease are normally very low resistance vessels.
Blood Flow Patterns
Laminar and Turbulent Flow
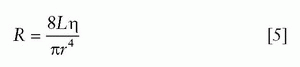
In the idealized flow conditions specified by Poiseuille’s law, the flow pattern is laminar, with all flow streamlines moving parallel to the tube walls and the fluid arranged in a series of concentric layers or laminae like those shown in Figure 5.2. The velocity within each lamina remains constant, with the lowest velocity adjacent to the tube wall and increasing velocity toward the center of the tube. This results in a velocity profile that is parabolic in shape (Fig. 5.3).
In contrast to the linear streamlines of laminar flow, turbulence is an irregular flow state in which velocity varies at random with respect to space and time. These irregular velocity changes result in the dissipation of fluid energy as heat. When turbulence is the result of a stenotic arterial lesion, it generally occurs immediately downstream from the stenosis and may be present only over the systolic portion of the cardiac cycle when velocities are highest. Under conditions of turbulent flow, the velocity profile changes from the parabolic shape of laminar flow to a rectangular or blunt shape (see Fig. 5.3). Because of the random velocity changes, energy losses are much greater for a turbulent flow state than for a laminar flow state.
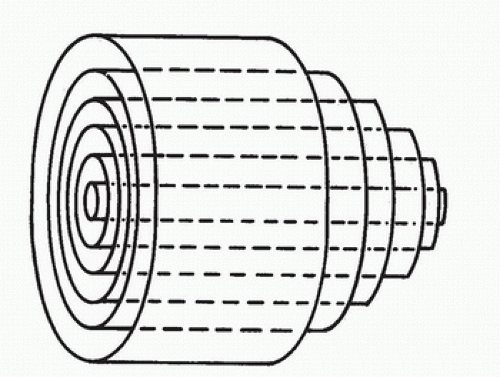 FIGURE 5.2. Laminar flow in a cylindrical tube. Concentric layers or laminae of fluid flow from left to right. The center laminae move more rapidly than do those near the periphery, and the flow profile is parabolic. (From Strandness DE, Sumner DS. Useful physical concepts. In Strandness DE, Sumner DS (eds). Hemodynamics for Surgeons. New York: Grune & Stratton, 1975, p 7.) |
 FIGURE 5.3. Velocity profiles of steady laminar and turbulent flow. Velocity is lowest adjacent to the tube wall and maximal in the center of the lumen. (From Sumner DS. The hemodynamics and pathophysiology of arterial disease. In Rutherford RB (ed). Vascular Surgery. Philadelphia: WB Saunders, 1977.) |
Boundary Layer Separation
When fluid flows through a tube, the portion of fluid adjacent to the tube wall is referred to as the boundary layer. This layer is subject to both frictional interactions with the tube wall and viscous forces generated by the more rapidly moving fluid toward the center of the tube. When the tube geometry changes, such as at points of curvature, branching, or alteration in lumen diameter, small pressure gradients are created that cause the boundary layer to stop or reverse direction. This results in a complex, localized flow pattern known as an area of flow separation or separation zone.2,3 Boundary layer separation has been observed in models of arterial anastomoses and bifurcations (Fig. 5.4).3,4,5 In the diagram of a carotid bifurcation shown in Figure 5.5, the central rapid-flow stream of the common carotid artery is compressed along the inner wall of the bulb, producing a region of high shear stress, with an area of flow separation along the outer wall of the carotid bulb that includes helical flow patterns and flow reversal. The region of the carotid bulb adjacent to the separation zone is subject to relatively low shear stresses. Within the internal carotid artery distal to the bulb, flow reattachment occurs and a more laminar flow pattern is present (see Figs. 5.4 and 5.5).
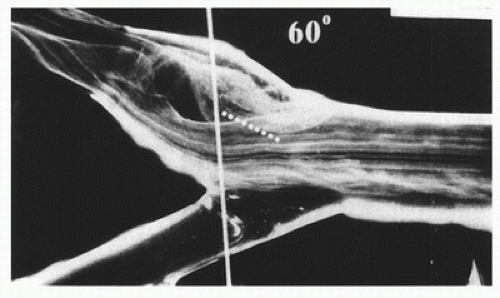 FIGURE 5.4. Flow visualization model of the normal carotid bulb using a pulsatile system and hydrogen bubbles as flow tracers. This frame was taken just after peak systole. The flow pattern seen in the outer (top) aspect of the model bulb is the region of flow separation; laminar flow is present along the flow divider. (From Ku DN, Giddens DP. Pulsatile flow in a model carotid bifurcation. Arteriosclerosis 1983;3:31-39, with permission.) |
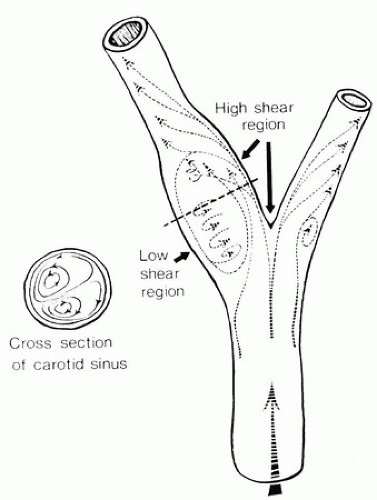 FIGURE 5.5. Carotid artery bifurcation shows an area of flow separation adjacent to the outer wall of the bulb. Rapid flow is associated with high shear stress, whereas the slower flow of the separation zone produces a region of low shear. (From Zarins CK, Giddens DP, Glagov S. Atherosclerotic plaque distribution and flow velocity profiles in the carotid bifurcation. In Bergan JJ, Yao JST (eds). Cerebrovascular Insufficiency. New York: Grune & Stratton, 1983.) |
The complex flow patterns described in models of the carotid bifurcation have also been documented in human subjects by pulsed Doppler studies.4,5 As shown in Figure 5.6, the Doppler spectral waveform obtained near the inner wall of a normal carotid bulb is typical of the forward, steady flow pattern found in the internal carotid artery. However, sampling of flow along the outer wall of the bulb demonstrates lower velocities with periods of both forward and reverse flow that are consistent with flow separation. Flow separation in the carotid bulb can also be seen with color-flow imaging, as shown in Figure 5.7. This is considered to be a normal finding and is particularly common in young individuals.5 Wall thickening in the carotid bulb and alterations in arterial distensibility with increasing age make flow separation less prominent in older individuals.6
Stay updated, free articles. Join our Telegram channel

Full access? Get Clinical Tree


