where ρ is the specific gravity of blood (~1.056 g/cm3), g is the acceleration due to gravity (980 cm/s2), and h is the distance in centimeters above or below the right atrium. The magnitude of hydrostatic pressure may be relatively large. For example, in a man 5 feet 8 inches tall, the hydrostatic pressure at ankle level is approximately 90 mm Hg. The static filling pressure is usually in the range of 5 to 10 mm Hg and represents the residual pressure that exists in the absence of arterial flow; it is determined by the volume of blood and the elastic properties of the vessel wall.
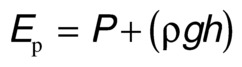
Total fluid energy (E) consists of potential energy (Ep) and kinetic energy (Ek). The components of potential energy are intravascular pressure (P) and gravitational potential energy. Gravitational potential energy represents the ability of blood to do work because of its height above a specific reference level. The formula for gravitational potential energy is the same as that for hydrostatic pressure (Eq. 1) but with an opposite sign: +ρgh. Because the static filling pressure is relatively low, and the gravitational potential energy and hydrostatic pressure usually cancel each other out, the predominant component of potential energy is the dynamic pressure of cardiac contraction. Potential energy can be expressed as
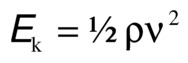
Kinetic energy represents the ability of blood to do work on the basis of its motion. It is proportional to the specific gravity of blood and the square of blood velocity (v):
When fluid flows from one point to another, its total energy (E) remains constant, provided that flow is steady and there are no frictional energy losses. This is in accordance with the law of conservation of energy and constitutes Bernoulli’s principle. In the horizontal diverging tube shown in Figure 5.1, steady flow between point 1 and point 2 is accompanied by an increase in cross-sectional area and a decrease in flow velocity. The widening of the tube results in conversion of kinetic energy to potential energy in the form of pressure. Although the fluid moves against a pressure gradient of 2.5 mm Hg and therefore gains potential energy, the total fluid energy remains constant because of the decrease in velocity and a proportional loss of kinetic energy. The situation depicted in Figure 5.1 does not occur in human arteries because the required ideal flow conditions are not present. The fluid energy lost in moving blood through the arterial circulation is dissipated mainly in the form of heat.
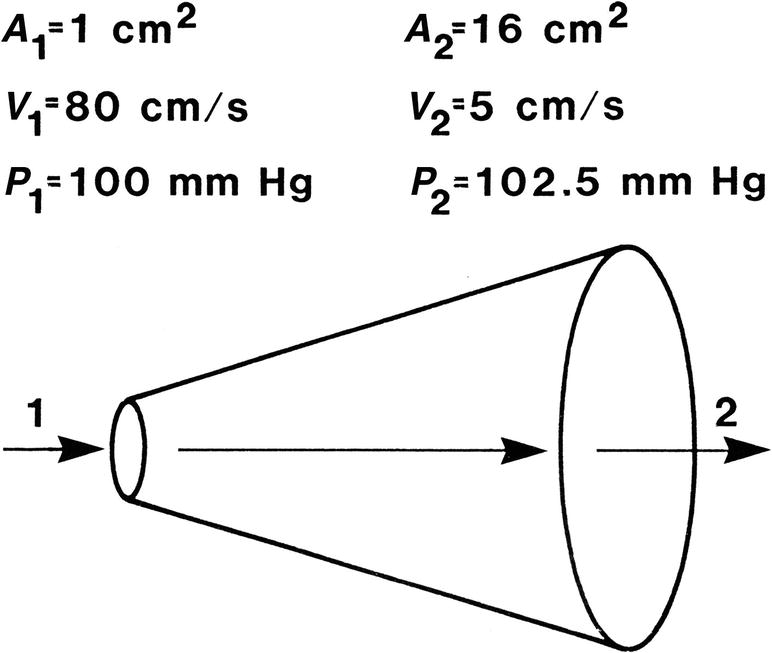
FIGURE 5.1. Effect of increasing cross-sectional area on pressure and velocity in an idealized frictionless fluid system. Flow is from left to right. While pressure increases between point 1 and point 2, total fluid energy remains constant as a result of a decrease in velocity.
(Redrawn from Sumner DS. The hemodynamics and pathophysiology of arterial disease. In Rutherford RB (ed). Vascular Surgery. Philadelphia: WB Saunders, 1977.)
Poiseuille’s Law and Vascular Resistance
Energy losses in flowing blood occur either as viscous losses resulting from friction or as inertial losses related to changes in the velocity or direction of flow. The term viscosity describes the resistance to flow that arises because of the intermolecular attractions between fluid layers. Fluids with particularly strong intermolecular attractions offer a high resistance to flow and have high coefficients of viscosity. Because blood viscosity increases exponentially with increases in hematocrit, the concentration of red blood cells is the most important factor affecting the viscosity of whole blood. The viscosity of plasma is determined largely by the concentration of plasma proteins. Poiseuille’s law describes the viscous energy losses that occur in an idealized flow model. This law states that the pressure gradient along a tube (P1 − P2) is directly proportional to the mean flow velocity  or volume flow (Q), the tube length (L), and the fluid viscosity (η) and is inversely proportional to either the second or the fourth power of the radius (r):
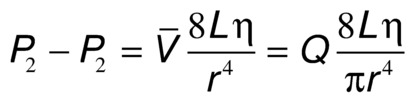
This equation is often simplified to: pressure = flow × resistance, where Q is flow and
is the resistance term. The hemodynamic resistance of an arterial segment increases as the flow velocity increases, provided the lumen size remains constant. These additional energy losses are related to inertial effects or changes in kinetic energy and are proportional to the square of blood velocity (Eq. 3).
The strict application of Poiseuille’s law requires steady laminar flow in a straight, rigid, cylindrical tube. Because these conditions seldom exist in the arterial circulation, Poiseuille’s law can only estimate the minimum pressure gradient or viscous energy losses that may be expected in arterial flow. Energy losses due to inertial effects often exceed viscous energy losses, particularly in the presence of arterial disease. In the human circulation, approximately 90% of the total vascular resistance results from flow through the arteries and capillaries, whereas the remaining 10% results from venous flow. The arterioles and capillaries are responsible for over 60% of the total resistance, whereas the large and medium-sized arteries account for only about 15%.1 Therefore, the arteries that are most commonly affected by atherosclerotic occlusive disease are normally very low resistance vessels.
Blood Flow Patterns
Laminar and Turbulent Flow
In the idealized flow conditions specified by Poiseuille’s law, the flow pattern is laminar, with all flow streamlines moving parallel to the tube walls and the fluid arranged in a series of concentric layers or laminae like those shown in Figure 5.2. The velocity within each lamina remains constant, with the lowest velocity adjacent to the tube wall and increasing velocity toward the center of the tube. This results in a velocity profile that is parabolic in shape (Fig. 5.3).
FIGURE 5.2. Laminar flow in a cylindrical tube. Concentric layers or laminae of fluid flow from left to right. The center laminae move more rapidly than do those near the periphery, and the flow profile is parabolic.
(From Strandness DE, Sumner DS. Useful physical concepts. In Strandness DE, Sumner DS (eds). Hemodynamics for Surgeons. New York: Grune & Stratton, 1975, p 7.)
FIGURE 5.3. Velocity profiles of steady laminar and turbulent flow. Velocity is lowest adjacent to the tube wall and maximal in the center of the lumen.
(From Sumner DS. The hemodynamics and pathophysiology of arterial disease. In Rutherford RB (ed). Vascular Surgery. Philadelphia: WB Saunders, 1977.)
In contrast to the linear streamlines of laminar flow, turbulence is an irregular flow state in which velocity varies at random with respect to space and time. These irregular velocity changes result in the dissipation of fluid energy as heat. When turbulence is the result of a stenotic arterial lesion, it generally occurs immediately downstream from the stenosis and may be present only over the systolic portion of the cardiac cycle when velocities are highest. Under conditions of turbulent flow, the velocity profile changes from the parabolic shape of laminar flow to a rectangular or blunt shape (see Fig. 5.3). Because of the random velocity changes, energy losses are much greater for a turbulent flow state than for a laminar flow state.
Boundary Layer Separation
When fluid flows through a tube, the portion of fluid adjacent to the tube wall is referred to as the boundary layer. This layer is subject to both frictional interactions with the tube wall and viscous forces generated by the more rapidly moving fluid toward the center of the tube. When the tube geometry changes, such as at points of curvature, branching, or alteration in lumen diameter, small pressure gradients are created that cause the boundary layer to stop or reverse direction. This results in a complex, localized flow pattern known as an area of flow separation or separation zone.2,3 Boundary layer separation has been observed in models of arterial anastomoses and bifurcations (Fig. 5.4).3–5 In the diagram of a carotid bifurcation shown in Figure 5.5, the central rapid-flow stream of the common carotid artery is compressed along the inner wall of the bulb, producing a region of high shear stress, with an area of flow separation along the outer wall of the carotid bulb that includes helical flow patterns and flow reversal. The region of the carotid bulb adjacent to the separation zone is subject to relatively low shear stresses. Within the internal carotid artery distal to the bulb, flow reattachment occurs and a more laminar flow pattern is present (see Figs. 5.4 and 5.5).
FIGURE 5.4. Flow visualization model of the normal carotid bulb using a pulsatile system and hydrogen bubbles as flow tracers. This frame was taken just after peak systole. The flow pattern seen in the outer (top) aspect of the model bulb is the region of flow separation; laminar flow is present along the flow divider.
(From Ku DN, Giddens DP. Pulsatile flow in a model carotid bifurcation. Arteriosclerosis 1983;3:31–39, with permission.)
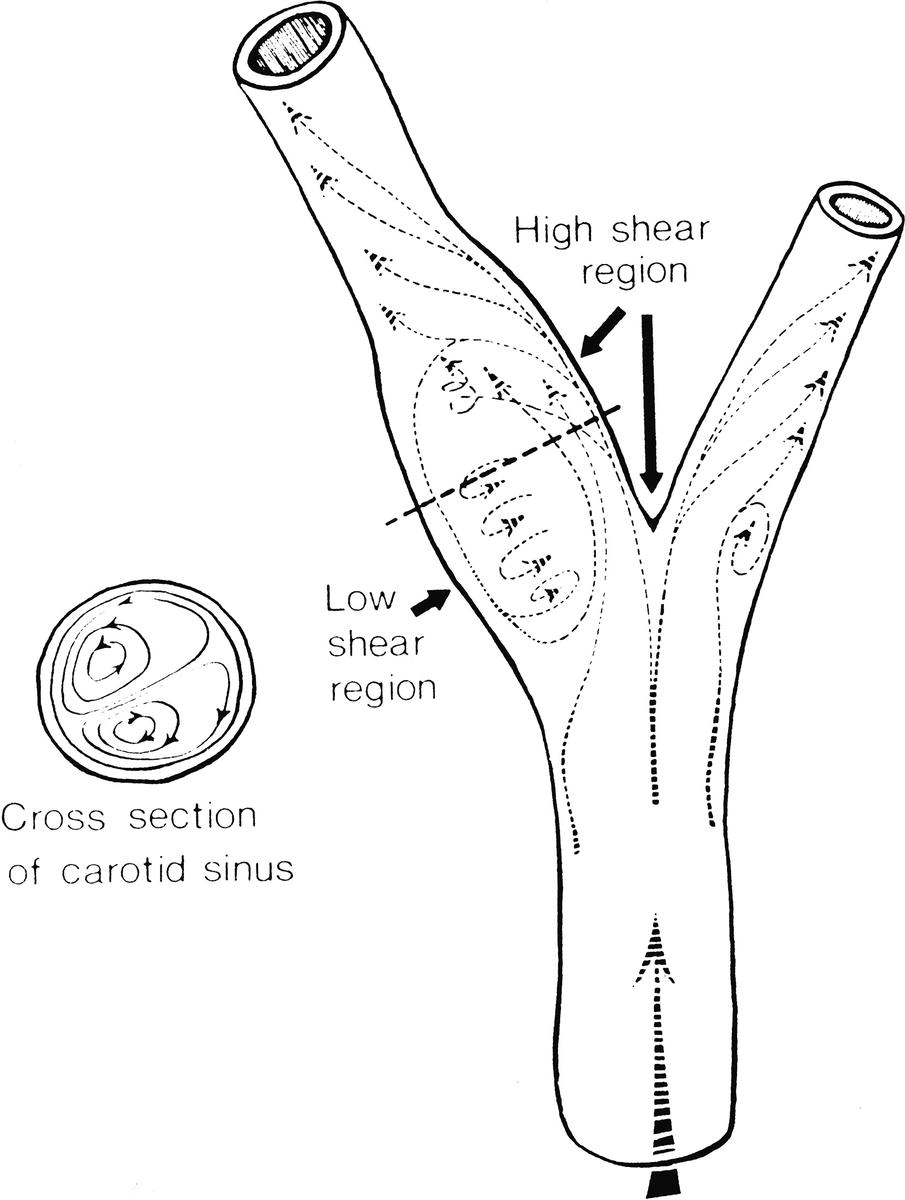
FIGURE 5.5. Carotid artery bifurcation shows an area of flow separation adjacent to the outer wall of the bulb. Rapid flow is associated with high shear stress, whereas the slower flow of the separation zone produces a region of low shear.
(From Zarins CK, Giddens DP, Glagov S. Atherosclerotic plaque distribution and flow velocity profiles in the carotid bifurcation. In Bergan JJ, Yao JST (eds). Cerebrovascular Insufficiency. New York: Grune & Stratton, 1983.)
The complex flow patterns described in models of the carotid bifurcation have also been documented in human subjects by pulsed Doppler studies.4,5 As shown in Figure 5.6, the Doppler spectral waveform obtained near the inner wall of a normal carotid bulb is typical of the forward, steady flow pattern found in the internal carotid artery. However, sampling of flow along the outer wall of the bulb demonstrates lower velocities with periods of both forward and reverse flow that are consistent with flow separation. Flow separation in the carotid bulb can also be seen with color-flow imaging, as shown in Figure 5.7. This is considered to be a normal finding and is particularly common in young individuals.5 Wall thickening in the carotid bulb and alterations in arterial distensibility with increasing age make flow separation less prominent in older individuals.6
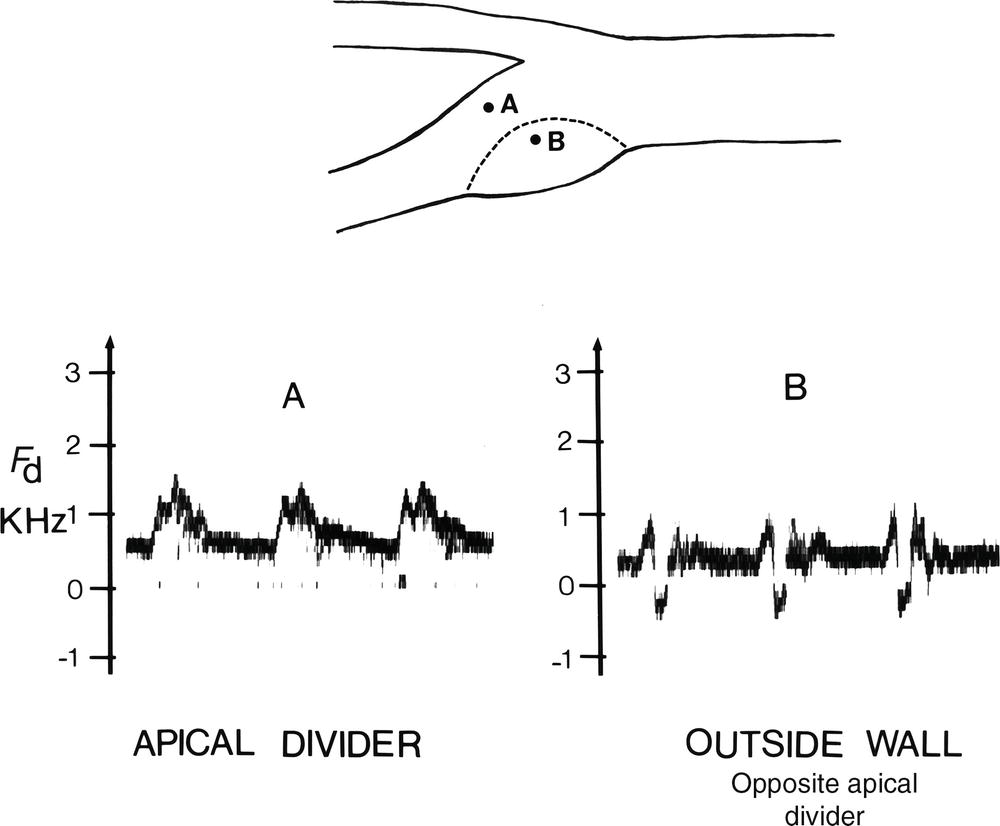
FIGURE 5.6. Flow separation in the normal carotid bulb shown by pulsed Doppler spectral waveform analysis. The flow pattern near the apical divider (A) is forward throughout the cardiac cycle, but near the outer wall of the bulb (B), the spectrum contains both forward (positive) and reverse (negative) flow components. The latter pattern indicates an area of flow separation.
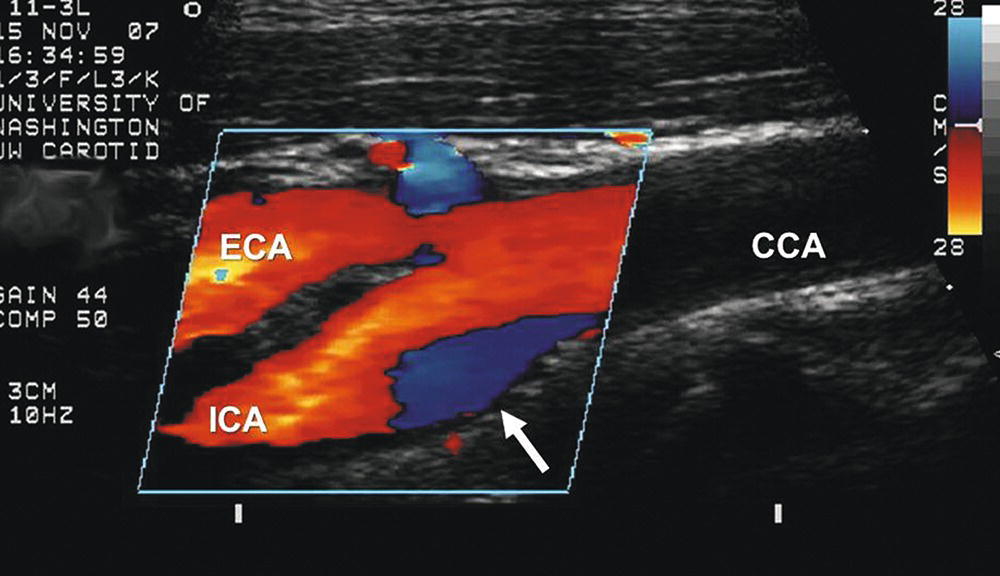
FIGURE 5.7. Color-flow image of a normal carotid bifurcation showing flow separation. As predicted by the model study shown in Figure 5.4, an area of flow separation is visualized along the outer wall of the carotid bulb (white arrow) as a blue region, indicating that the direction of flow in the separation zone is reversed. (CCA, common carotid artery; ICA, internal carotid artery; ECA, external carotid artery.)
The clinical importance of boundary layer separation is that these localized flow disturbances may contribute to the formation of atherosclerotic plaques.7 Examination of human carotid bifurcations, both at autopsy and during surgery, indicates that intimal thickening and atherosclerosis tend to occur along the outer wall of the carotid bulb, whereas the inner wall is relatively spared. These findings suggest that atherosclerotic lesions form near areas of flow separation and low shear stress.
Pulsatile Flow
In a pulsatile system, pressure and flow vary with time, and the velocity profile changes throughout the cardiac cycle. The hemodynamic principles that have been discussed are based on steady flow, and they cannot be applied to pulsatile flow in the arterial circulation; however, they can be used to determine the minimal energy losses that would be expected in a specific flow system. The resistance term of Poiseuille’s law (Eqs. 4 and 5) estimates viscous energy losses in steady flow, but it does not account for the inertial effects, arterial wall elasticity, and wave reflections that influence pulsatile flow. The term vascular impedance is used to describe the resistance or opposition offered by a peripheral vascular bed to pulsatile blood flow.8
Bifurcations and Branches
Although the branches of the arterial system produce sudden changes in the flow pattern that are potential sources of energy loss, the effect of branching on the total pressure drop in normal arterial flow is relatively small. Arterial branches commonly take the form of bifurcations. Flow patterns in a bifurcation are determined mainly by the area ratio and the branch angle. The area ratio is defined as the combined area of the secondary branches divided by the area of the primary artery. Bifurcation flow can be analyzed in terms of pressure gradient, velocity, and transmission of pulsatile energy. According to Poiseuille’s law, an area ratio of 1.41 would allow the pressure gradient to remain constant along a bifurcation. If the combined area of the branches equals the area of the primary artery, then the area ratio is 1.0 and there is no change in the velocity of flow. For efficient transmission of pulsatile energy across a bifurcation, the vascular impedance of the primary artery should equal that of the branches, a situation that occurs with an area ratio of 1.15 for larger arteries and 1.35 for smaller arteries.9 Human infants have a favorable area ratio of 1.11 at the aortic bifurcation, but the ratio gradually decreases with age. This decline in the area ratio of the aortic bifurcation leads to an increase in both the velocity of flow in the secondary branches and the amount of reflected pulsatile energy. For example, with an area ratio of 0.8, approximately 22% of the incident pulsatile energy is reflected back to the infrarenal aorta. This mechanism may play a role in the localization of atherosclerosis and aneurysms in this arterial segment.10
The curvature and angulation of an arterial bifurcation can also contribute to the development of flow disturbances and energy loss. As blood flows around a curve, the rapidly moving fluid in the center of the vessel tends to flow outward and be replaced by the slower fluid originally located near the arterial wall. This can result in complex helical flow patterns, such as those observed in the carotid bifurcation (see Fig. 5.4).4 As the angle between the secondary branches of a bifurcation widens, the tendency to develop turbulent or disturbed flow increases. The average angle between the human iliac arteries is 54 degrees; however, with diseased or tortuous iliac arteries, this angle can approach 180 degrees, and flow disturbances are particularly likely to develop.
Pressure and Flow in Normal Limbs
As the arterial pressure pulse moves distally, the systolic pressure rises, the diastolic pressure falls, and the pulse pressure becomes wider. The decrease in mean arterial pressure between the heart and the ankle is normally less than 10 mm Hg. In normal individuals, the ratio of ankle systolic pressure to brachial systolic pressure (ankle-brachial index) has a mean value of 1.11 ± 0.10 in the resting state.11 Moderate exercise in normal extremities produces little or no drop in ankle systolic pressure. Strenuous effort may be associated with a drop of several millimeters of mercury; however, pressures return rapidly to resting levels after cessation of exercise.
The velocity flow pattern in the major arteries of the leg is normally triphasic, as shown in Figure 5.8. An initial large forward-velocity phase resulting from cardiac systole is followed by a brief phase of flow reversal in early diastole and a third smaller phase of forward flow in late diastole. This triphasic pattern is modified by a variety of factors, including proximal arterial disease and changes in peripheral resistance. For example, body warming, which causes vasodilatation and decreased resistance, tends to eliminate the second phase of flow reversal; on exposure to cold, resistance increases and the reverse-flow phase becomes more prominent.
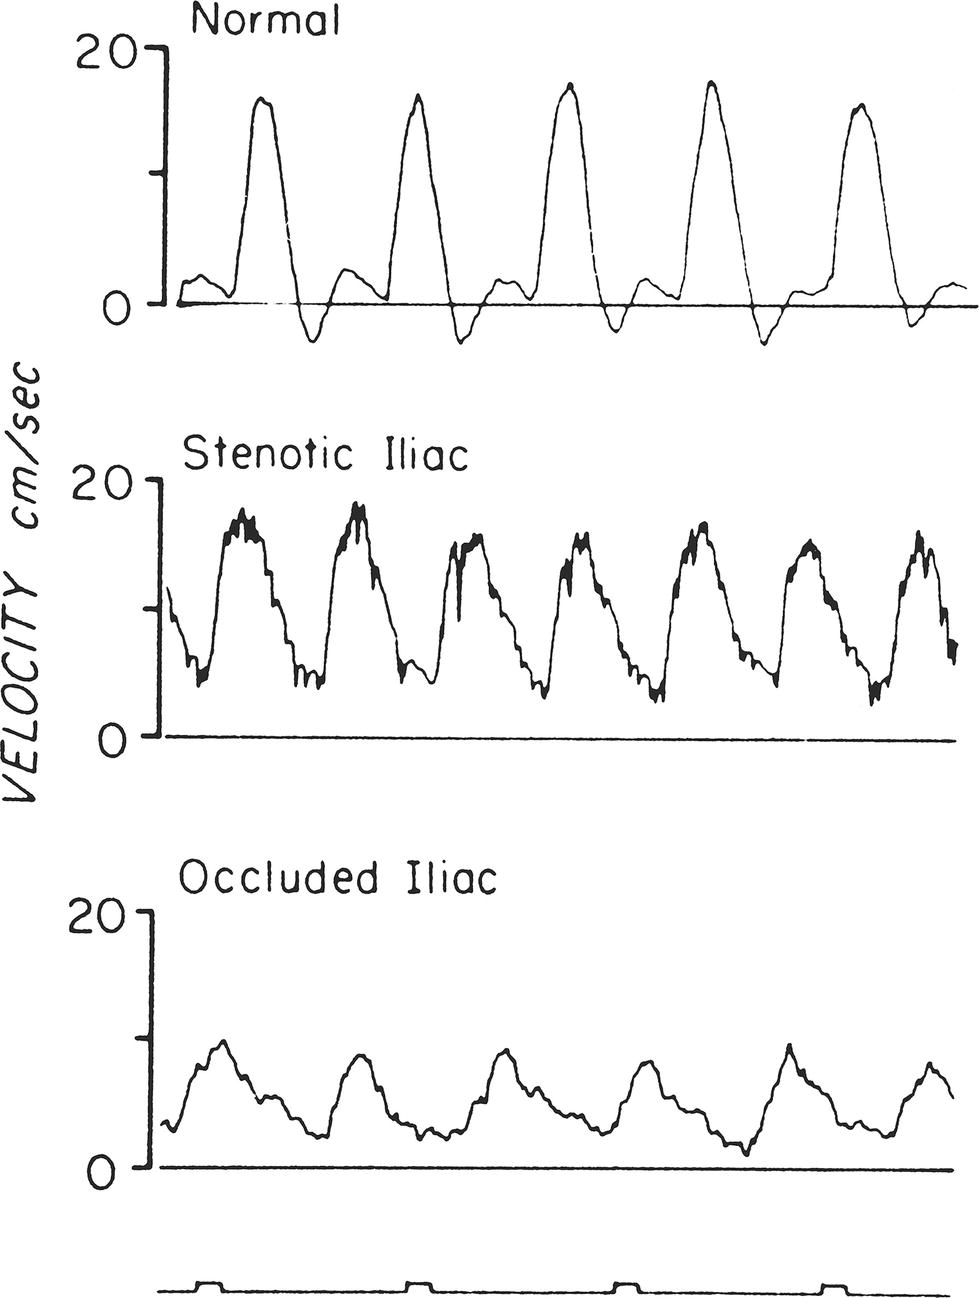
FIGURE 5.8. Velocity flow waveforms obtained with a directional Doppler velocity detector from the femoral artery of a normal subject, a patient with external iliac stenosis, and a patient with common iliac occlusion. Note the normal triphasic velocity pattern and the abnormal dampened, monophasic velocity patterns.
(From Strandness DE, Sumner DS. Blood flow to limbs. In Hemodynamics for Surgeons. New York: Grune & Stratton, 1975, p 257.)
Stay updated, free articles. Join our Telegram channel

Full access? Get Clinical Tree


