Heart Failure
Heart failure is a common, progressive, and usually lethal syndrome that represents a final common pathway by which a variety of disease processes impair cardiac function. In the United States, heart failure can be diagnosed in almost 10% of individuals over the age of 65, and 1 in 8 death certificates at all ages mentions heart failure (Heart disease and stroke statistics—2010 Update). Heart failure is deadly, with a worse prognosis than most malignancies; for example, mean survival for patients with this syndrome (Levy et al., 2006) is about the same as that for stage 3B breast cancer (chest wall metastases and/or extensive lymph node metastases) (Woodward et al., 2003). Because the most obvious abnormality in heart failure is impaired pump function, definitions traditionally focus on the abnormal hemodynamics, highlighting the clinical signs and symptoms that result from the impaired pumping of blood from the veins to the arteries. However in the late 1980s, when long-term clinical trials began to reveal the dismal prognosis in these patients, definitions began to recognize the progressive deterioration of failing hearts and the shortened life expectancy, and so included changes that damage the failing heart. This text defines heart failure as a clinical syndrome in which heart disease reduces cardiac output, increases venous pressures, and generally causes progressive deterioration of the heart muscle.
Hemodynamic Abnormalities
The heart is a biological pump that moves blood from a region of low pressure (the veins) to one at higher pressure (the arteries), and so can be compared to a mechanical pump that moves water from a leaky basement into a garden hose (Fig. 18-1). Failure of the pump causes the basement to flood and reduces flow out of the hose, which in heart failure are analogous to increasing venous pressure and decreasing cardiac output, respectively. To make a more “realistic” comparison to clinical heart failure, as it is understood today, the defective mechanical pump must also deteriorate rapidly.
A simple way to classify the hemodynamic abnormalities in heart failure is to define the reduced ejection of blood into the aorta and pulmonary artery as forward failure, and the reduced return of blood from the veins to the heart as backward failure. This classification is complicated by the fact that the underlying abnormality can involve mainly the left or the right ventricle, so that there can be four distinct manifestations of this syndrome (Table 18-1). However, the two sides of the heart operate in series, so that when blood backs up behind one ventricle it impairs ejection by the other ventricle, and when less blood is pumped out of one ventricle, less returns to the other. Furthermore, the heart is a reciprocating pump, where phases of filling alternate with phases of ejection. As a result, when ejection is reduced, the increased volume of blood remaining in the heart at the end of systole reduces the heart’s ability to fill during the next diastole; conversely, when filling is reduced the heart cannot eject a normal stroke volume (SV).
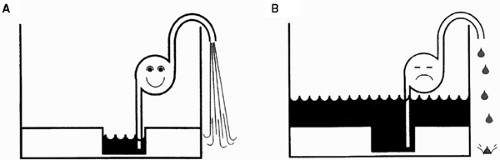 Fig. 18-1: The failing heart as a defective pump in a leaky basement. A: The heart can be viewed as a pump that moves water from a leaky basement into a hose. B: Failure of the pump can cause inadequate emptying of the basement, which then floods (high venous pressure or “backward failure”), and inadequate flow of water into the hose (low cardiac output or “forward failure”), or both. |
Left and Right Heart Failure
The clinical picture in most patients with heart failure is dominated by the signs and symptoms of impaired left ventricular function. This is especially true in developed countries, where the major etiologies are ischemic and hypertensive heart disease. Symptoms of left heart failure also dominate the clinical picture in most patients with dilated, hypertrophic, and infiltrative cardiomyopathies. Tachycardia-induced cardiomyopathy, which is rare but important because it is among the few curable forms of heart failure, usually causes left heart failure. Primary right heart failure, which is less common, can be caused by cor pulmonale that is a complication of chronic lung disease, multiple pulmonary emboli, and primary pulmonary hypertension. Valvular heart disease can cause either left or right heart failure, depending on the anatomic abnormalities, while congenital heart disease often causes right heart failure, for example, when pulmonic stenosis or pulmonary hypertension associated with an intracardiac shunt overloads the right ventricle. Right heart failure can come to dominate the clinical picture in patients in whom the primary abnormality involves the left heart (see later).
Table 18-1 Hemodynamic Abnormalities in Heart Failure | |||||||||||||||
|---|---|---|---|---|---|---|---|---|---|---|---|---|---|---|---|
|
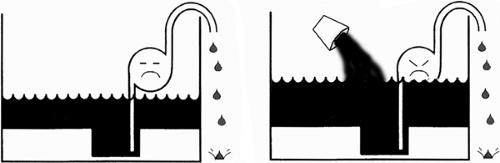 Fig. 18-2: Effect of fluid retention. If the failing heart is viewed as a defective pump in a leaky basement (Fig. 18-1), fluid retention worsens the flooding. |
Backward and Forward Failure
The concepts of forward and backward failure are useful in understanding the signs and symptoms of heart failure (see later), but are of no value in describing the abnormal hemodynamics because a heart that cannot fill normally cannot eject a normal stroke volume, and a heart that cannot eject normally cannot accept a normal venous return. For this reason, heart failure must limit ejection and filling to the same extent. Forward failure is sometimes equated with depressed myocardial contractility (decreased inotropy), and backward failure with impaired relaxation (decreased lusitropy), but this is not correct because at any steady state ejection and filling must be equal.
The major determinant of whether a patient with heart failure has a high venous pressure and is edematous (backward failure) or suffers from low cardiac output (forward failure) is the neurohumoral response (see Chapter 8). Fluid retention by the kidneys, a major cause of increased preload and venous congestion, worsens backward failure (Fig. 18-2), while the increased afterload caused by peripheral vasoconstriction reduces ejection and so worsens forward failure (Fig. 18-3).
Therapy is also an important determinant of the manifestations of forward and backward failure (see later). Vasodilator drugs, by reducing afterload, increase stroke volume and alleviate
the low cardiac output that characterizes forward failure, while diuretics reduce blood volume and decrease venous pressures, and so alleviate the manifestations of backward failure. Excessive vasodilatation, however, can worsen forward failure by lowering blood pressure, and excessive diuresis can worsen forward failure by reducing preload. For these reasons, the severity of forward and backward failures, defined as reduced cardiac output and increased venous pressure, respectively, provides little information regarding the extent to which the abnormal pump function is caused by reduced filling or reduced ejection, or whether contractility is depressed (decreased inotropy) or relaxation is impaired (decreased lusitropy).
the low cardiac output that characterizes forward failure, while diuretics reduce blood volume and decrease venous pressures, and so alleviate the manifestations of backward failure. Excessive vasodilatation, however, can worsen forward failure by lowering blood pressure, and excessive diuresis can worsen forward failure by reducing preload. For these reasons, the severity of forward and backward failures, defined as reduced cardiac output and increased venous pressure, respectively, provides little information regarding the extent to which the abnormal pump function is caused by reduced filling or reduced ejection, or whether contractility is depressed (decreased inotropy) or relaxation is impaired (decreased lusitropy).
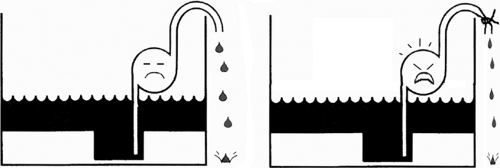 Fig. 18-3: Effect of vasoconstriction. If the failing heart is viewed as a defective pump in a leaky basement (Fig. 18-1), vasoconstriction increases the work of the pump and decreases its forward output. |
Systolic and Diastolic Dysfunction
Systolic and diastolic dysfunction, which describe different pathophysiological mechanisms, are not the same as systolic and diastolic heart failure, which refer to different clinical syndromes (see later). Systolic dysfunction describes ejection abnormalities that slow the rate of pressure rise during isovolumic contraction (+dP/dt) and the rate and extent of ejection (Fig. 18-4A), whereas diastolic dysfunction impairs ventricular filling by slowing the rate of pressure fall during isovolumic relaxation (-dP/dt), decreasing the rate of filling, or increasing stiffness throughout diastole (Fig. 18-4B).
Causes of systolic dysfunction include left ventricular damage caused by myocardial infarction, dilated cardiomyopathies, viral myocarditis, and toxic and metabolic abnormalities.
Diastolic dysfunction can be caused by wall thickening and reduced cavity volume in patients with hypertension or hypertrophic cardiomyopathies, and restrictive diseases like amyloidosis, fibroelastosis, and pericardial disease. A number of biochemical and molecular abnormities also cause systolic and diastolic dysfunction by impairing cardiac myocyte contraction and relaxation, respectively.
Diastolic dysfunction can be caused by wall thickening and reduced cavity volume in patients with hypertension or hypertrophic cardiomyopathies, and restrictive diseases like amyloidosis, fibroelastosis, and pericardial disease. A number of biochemical and molecular abnormities also cause systolic and diastolic dysfunction by impairing cardiac myocyte contraction and relaxation, respectively.
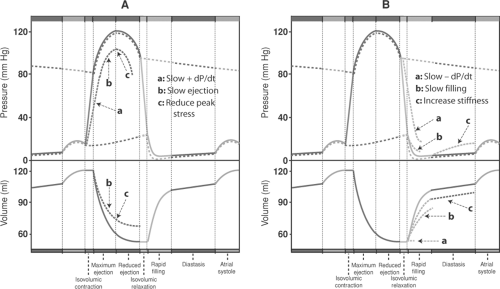 Fig. 18-4: Pathophysiological mechanisms that can impair cardiac performance. A: Systolic dysfunction can result from: (a) slowed rate of pressure rise during isovolumic contraction (+dP/dt), (b) slowed ejection, and/or (c) reduced peak systolic wall stress. B: Diastolic dysfunction can result from: (a) Slowed rate of pressure fall during isovolumic relaxation (-dP/dt), (b) slowed filling during early diastole, and/or (c) increased stiffness throughout diastole. |
Measurements of stroke volume and venous and arterial pressures cannot distinguish between systolic and diastolic dysfunction because aortic pressure and cardiac output are decreased, and ventricular diastolic pressures increased in most of these patients. Systolic dysfunction can be suggested by a marked reduction in +dP/dt, ejection rate, or systolic compliance, while diastolic dysfunction is suggested by a low -dP/dt, slowed ventricular filling, or reduced diastolic compliance. However, systolic and diastolic dysfunction commonly occur together, which makes it difficult for any hemodynamic measurement to identify which of these mechanisms is responsible for impaired pump function.
Systolic and Diastolic Heart Failure
Systolic and diastolic heart failure are clinical syndromes that are both easy and difficult to define. The simple definitions are that systolic heart failure is caused by abnormalities in ejection, while diastolic heart failure occurs when filling is impaired. However, these definitions are not valid because, as noted earlier, a ventricle that ejects poorly cannot fill normally, and vice versa. For this reason, the distinction has come to rely on ventricular architecture: the ventricle is dilated in patients with systolic heart failure, whereas ventricular cavity volume can be normal, slightly reduced, or minimally increased in diastolic heart failure. The measurement usually used to distinguish between systolic and diastolic heart failure is the ejection fraction (EF) (see Chapter 12), which is the ratio between stroke volume and end-diastolic volume (EDV):

The reason that EF has become the major basis for this distinction is that absolute values for stroke volume and EDV are difficult to measure clinically whereas the ratio, which is dimensionless, is readily determined using noninvasive methods, notably echocardiography. The dependence on EF in distinguishing between these two types of heart failure is evidenced by current terminology, which describes systolic heart failure as HFlowEF (heart failure with low ejection fraction), and diastolic heart failure as HFnEF (heart failure with normal ejection fraction) or HFpEF (heart failure with preserved ejection fraction). The new terminology reflects the central importance of ventricular architecture in making this distinction.
EF distinguishes systolic and diastolic heart failure because EDV (the denominator) is increased when ejection is impaired and usually reduced when impaired filling is the underlying abnormality. Abnormalities in stroke volume (the numerator) are less important because the extent to which cardiac output can decrease is limited in both types of heart failure. This is especially true in the elderly, where a decrease in stroke volume is limited by the normally low cardiac output; for example, cardiac index (cardiac output normalized for body surface area) at age 70 is ∼2.5 l/min/m2, which is only slightly greater than in moderate to severe heart failure, where cardiac index is 1.6 to 2.3 l/min/m2 (Baim and Grossman, 2000). A major exception, high output failure, is uncommon and is readily identified by clinical evidence of a high cardiac output.
Table 18-2 Systolic and Diastolic Heart Failure | |||||||
|---|---|---|---|---|---|---|---|
|
Systolic heart failure, which is characterized by left ventricular dilatation, is usually caused by diseases that destroy, damage, or weaken the myocardium (Table 18-2). The left ventricular wall motion abnormalities in systolic heart failure can be either regional or diffuse (global). Regional wall motion abnormalities are seen when occlusion of a major coronary artery has destroyed part of the left ventricle (myocardial infarction), whereas global wall motion abnormalities result from dilated cardiomyopathies and myocarditis, in which depression of ventricular function is more uniform.
Diastolic heart failure is seen in patients with concentric left ventricular hypertrophy and stiff ventricles. Etiologies include hypertension and the decreased aortic impedance that accompanies aging, which explains why diastolic heart failure is commonly diagnosed in the elderly. Sudden episodes of severe pulmonary edema (called flash pulmonary edema) are often seen in patients with diastolic heart failure who have only mild symptoms under basal conditions. These episodes are caused by the reduced ventricular compliance, which allows even a small increase in preload or afterload to cause a sharp rise in end-diastolic pressure that “tips” the patient onto the descending limb of the Starling curve (see later).
Signs and Symptoms of Heart Failure
The clinical manifestations of heart failure include signs, which are objective manifestations of depressed cardiac performance, and symptoms, which are abnormalities perceived by the patient. The consequences of increased venous pressure behind a failing ventricle are readily understood because upstream transmission of this pressure elevates capillary pressure, which increases the hydrostatic forces that cause fluid to be transudated across the capillary endothelium into the tissues. The result is edema in the lungs of patients with left heart failure and peripheral edema, ascites (fluid in the peritoneal cavity), and pleural effusions in right heart failure. Fatigue, the major symptom associated with decreased cardiac output, is due mainly to a skeletal muscle myopathy (see later).
None of the signs and symptoms described earlier are specific for heart failure. Hemodynamic abnormalities resembling those caused by increased venous pressure in heart failure occur in patients with normal hearts when increased blood volume, renal failure, hepatic disease, protein deficiency or infusion of large amounts of blood or saline elevates systemic and pulmonary
venous pressures. Conversely, decreased blood volume, which can be caused by hemorrhage, extensive burns, cholera, or toxic shock syndrome, reduces cardiac output. Fatigue, a major symptom in virtually all patients with heart failure, also has many causes.
venous pressures. Conversely, decreased blood volume, which can be caused by hemorrhage, extensive burns, cholera, or toxic shock syndrome, reduces cardiac output. Fatigue, a major symptom in virtually all patients with heart failure, also has many causes.
Table 18-3 Some Common Causes of Heart Failure | ||||||||||||||||||||||||||||||||
|---|---|---|---|---|---|---|---|---|---|---|---|---|---|---|---|---|---|---|---|---|---|---|---|---|---|---|---|---|---|---|---|---|
|
Right and Left Heart Failure
The clinical picture in most patients with heart failure is dominated by the signs and symptoms of left ventricular failure; this is especially true in developed countries, where the major etiologies of heart failure are ischemic and hypertensive heart disease (Table 18-3). Patients with dilated cardiomyopathies also suffer mainly from left heart failure. Right heart failure, which is less common, occurs most often in patients with congenital heart disease and cor pulmonale; the latter can also come to dominate the clinical picture in patients with left heart failure. The latter occurs when chronic elevation of left atrial pressure increases pulmonary arterial pressure by causing reactive pulmonary vasoconstriction and proliferative changes that obliterate small pulmonary arteries. Although this response reduces blood flow through the lungs, and so alleviates pulmonary congestion, it replaces one problem (left heart failure) for another (right heart failure) (Wood, 1954).
Backward Failure of the Left Heart
Backward failure of the left heart causes shortness of breath (dyspnea) largely by increasing the work required to ventilate the congested lungs. In contrast to normal breathing, which is rarely perceived, it is impossible to ignore the increased respiratory effort seen when elevated pulmonary venous pressure causes the lungs to become stiff and inelastic, like a water-logged sponge. Cardiac dyspnea is exacerbated by arterial hypoxia, which occurs when pulmonary interstitial edema impairs oxygen exchange. Ventilation-perfusion mismatch and weakness of the respiratory muscles (see later) can also contribute to hypoxia in these patients.
Dyspnea caused by both left heart failure and pulmonary disease is worsened by exertion, but cardiac dyspnea generally becomes more severe when the patient lies down (orthopnea) because elevation of the lower extremities increases central blood volume by draining blood from the leg veins. Paroxysmal nocturnal dyspnea, the sudden onset of severe shortness of breath in a patient who has been recumbent for several hours, occurs when blood volume is increased more slowly by resorption of interstitial fluid from the edematous lower extremities.
High pulmonary venous pressure causes fluid to be transudated across the pulmonary capillaries; this fluid appears first in the interstitium, from which it is carried to the systemic veins via lymphatic vessels. If transudation occurs more rapidly than the rate at which the fluid can be removed by the lymphatics, the interstitium becomes edematous. Interstitial edema can be seen on an ordinary chest x-ray as thin horizontal lines, called Kerley B lines that, because of the effects of gravity, initially appear in the lower lung fields. Left heart failure also results in a radiological pattern called “cephalization,” in which the pulmonary veins draining the upper lobes appear larger than those that drain the lower lobes. However, clinical estimation of left ventricular diastolic pressure is difficult, and so may require measurements made by pulmonary artery catheterization.
Accumulation of interstitial fluid interferes with gas exchange between the pulmonary capillaries and the alveoli; most prominent is arterial hypoxia because oxygen is much less soluble in water than carbon dioxide. When backward failure of the left heart becomes severe, fluid entering the small bronchi causes râles, which are crackling sounds described by Hippocrates as like the “seething of vinegar.” Because of gravity, râles appear initially at the lung bases. In severe left heart failure, when pulmonary capillary pressure (which drives fluid into the interstium) greatly exceeds plasma protein oncotic pressure (which causes fluid resorption), flooding of the airspaces leads to pulmonary edema that can literally drown a patient.
Backward Failure of the Right Heart
Backward failure of the right heart elevates jugular venous pressure, which provides an invaluable bedside measurement for quantifying the severity of right heart failure. Right heart failure also causes fluid transudation into the soft tissues of the periphery (edema) and the pleural, pericardial, and abdominal spaces (anasarca). Massive fluid accumulation, once called dropsy, caused horrible suffering in patients before the development of modern diuretics which, along with salt (sodium) restriction, has changed the clinical manifestations of this syndrome. Today, fatigue, rather than fluid retention, is the most troublesome problem in these patients. It is for this reason that heart failure is now replacing the older designation congestive heart failure (CHF).
Forward Failure
Fatigue, which has emerged as a major problem in patients with heart failure, has several causes, the most important of which is a skeletal muscle myopathy. Mechanisms that contribute to this myopathy include reduced skeletal muscle perfusion, disuse caused by inactivity, malnutrition, cytokines and other inflammatory mediators, apoptosis, and molecular abnormalities in the skeletal myocytes. Mitochondrial dysfunction in the latter impairs oxidative adenosine triphosphate (ATP) regeneration and increases anaerobic lactate production that accelerates the appearance of systemic acidosis during exercise. The ability of
exercise training both to alleviate the symptoms associated with this myopathy and improve prognosis argues strongly against the once widely held view that heart failure should be treated with prolonged rest.
exercise training both to alleviate the symptoms associated with this myopathy and improve prognosis argues strongly against the once widely held view that heart failure should be treated with prolonged rest.
Interplay Between the Failing Heart and the Peripheral Circulation
Heart failure reduces blood flow into the arteries and causes blood to accumulate in the veins behind the failing ventricle (Fig. 18-1) at the same time, increases in peripheral resistance and blood volume exacerbate the clinical manifestations of heart failure. Understanding of these and other hemodynamic changes in patients with heart failure is facilitated by examining pressure–volume loops, which focus on the heart to show how changing preload and afterload alter cardiac performance (see Chapter 11), and Guyton diagrams which describe the interplay between blood flow into and out of the heart by showing the effects of atrial pressure on venous return and cardiac output (see Chapter 12). Both provide valuable insights into the way that changes in blood volume and arteriolar resistance modify cardiac performance.
Effects of Heart Failure on Pressure–Volume Loops
Pressure–volume loops depict the interplay between lusitropy, which determines the end-diastolic pressure–volume relationship; inotropy, which determines the end-systolic pressure–volume relationship; and preload and afterload, which determine the positions of the end-diastolic and end-systolic points along the corresponding pressure–volume relationships. The following discussion describes the events that occur when a sudden decrease in contractility impairs the heart’s ability to eject, and when a rapid increase in diastolic stiffness impairs the ability of the heart to fill.
Impaired Ejection
A sudden decrease in contractility, such as occurs after coronary artery occlusion, shifts the end-systolic pressure–volume relationship (the Starling curve) to the right and downward (Fig. 18-5A). Because ejection is reduced, end-systolic (residual) volume increases; as a result, addition of a normal venous return to the greater end-systolic volume increases EDV in the next cardiac cycle (Fig. 18-5B). This hemodynamic adjustment increases preload by moving the end-diastolic point upward and to the right along the end-diastolic pressure–volume relationship which, according to Starling’s law of the heart, increases stroke volume.
The neurohumoral response (see Chapter 8) causes two important hemodynamic adjustments to the impaired cardiac performance. The first is arteriolar vasoconstriction, which increases afterload. This response, which initially results from the α-adrenergic effects of sympathetic activation, and later from the effects of angiotensin II, endothelin, and vasopressin, increases aortic pressure and reduces stroke volume (Fig. 18-5C). Because vasoconstriction reduces cardiac output and increases energy expenditure (see Chapter 12), this response is often detrimental in patients with heart failure. Salt and water retention by the kidneys, the second major component of the neurohumoral response, increases preload, and so shifts the end-diastolic point upward and to the right along the end-diastolic pressure–volume relationship (Fig. 18-5D). According to Starling’s law, this increases stroke volume, but at the expense of increasing venous pressure.
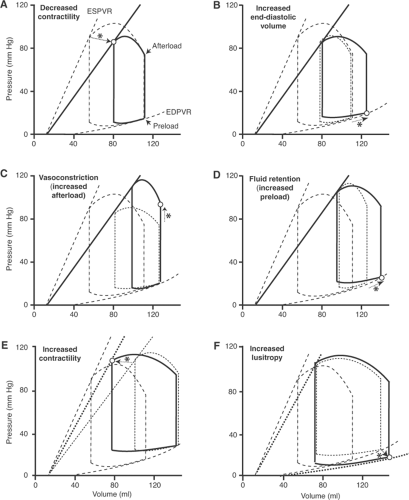 Fig. 18-5: Left ventricular pressure–volume loops after a sudden decease in the heart’s ability to eject; for clarity, the responses to the fall in the end-systolic pressure–volume relationship (ESPVR) are shown sequentially. Hemodynamic and other changes are identified by dotted arrows (indicated by asterisks) that point to open circles that represent the new condition. In all six panels, the heart operating under baseline conditions is depicted using dashed lines; in panels B–F, the pressure–volume loop in the preceding panel is shown using dotted lines. A: Impaired ejection shifts the ESPVR to the right and downward (solid curve) which, if afterload remains constant, reduces stroke volume by shifting the end-systolic point (open circle) to a lower volume. B: Reduced ejection increases end-diastolic pressure and volume (open circle), which according to Starling’s law increases stroke volume; this is apparent when the solid curves in A and B are compared. C: Vasoconstriction increases afterload (open circle), which moves the end-systolic point upward, thereby increasing arterial pressure but reducing stroke volume; this is apparent when the solid loops in B and C are compared. D: Fluid retention increases preload (open circle), which increases stroke volume but at the expense of higher end-diastolic pressure and volume; this is apparent when the solid loops in C and D are compared. E: Increased contractility (dotted line) increases stroke volume, which is apparent when the solid loops in D and E are compared. F: Increased lusitropy (dotted line) increases stroke volume, which is apparent when the solid loops in E and F are compared. ESPVR: end-systolic pressure–volume relationship; EDPVR: end-diastolic pressure–volume relationship. |
The neurohumoral response affects the heart when β-adrenergic stimulation increases contractility and facilitates filling. The inotropic response, which shifts the end-systolic pressure–volume relationship upward and to the left (Fig. 18-5E), along with the chronotropic response to β-stimulation, increases the ability of the failing heart to eject at a given EDV and afterload. The lusitropic response shifts the end-diastolic pressure–volume relationship downward and to the right (Fig. 18-5F), which improves backward failure by reducing end-diastolic pressure; this response also alleviates forward failure when the increased EDV increases ejection (Starling’s law of the heart).
Impaired Filling
A lusitropic abnormality that decreases the ability of the heart to fill, which can appear rapidly when the heart becomes energy-starved, shifts the end-diastolic pressure–volume relationship to the left and upward (Fig. 18-6A). Because ejection is reduced, end-systolic (residual) volume increases so that addition of the venous return to the greater end-systolic volume increases EDV in the next beat. According to Starling’s law of the heart, the latter increases stroke volume (Fig. 18-6B). Vasoconstriction and fluid retention, which are initiated by the neurohumoral response, increase both afterload and preload. The higher afterload caused by arteriolar constriction increases aortic pressure but reduces stroke volume (Fig. 18-6C), while the higher EDV caused by venoconstriction and fluid retention increases stroke volume, but at the expense of a further increase in diastolic pressure (Fig. 18-6D). β-Adrenergic stimulation of the heart increases contractility, which increases ejection (Fig. 18-6E) and, by stimulating the biochemical mechanisms that relax the heart, reduces end-diastolic pressure and increases ejection (Fig. 18-6F).
Combination of Impaired Ejection and Impaired Filling
Impairment of both ejection and filling “compresses” the pressure–volume loop (Fig. 18-7). The smaller area within the pressure–volume loop reflects the reduced ability of the failing heart to perform external work, which decreases both stroke volume and the ability of the ventricle to develop pressure.
Effects of Systolic and Diastolic Dysfunction on the Response to Increased Venous Return
The hemodynamic consequences of increasing venous return differ when cardiac function is impaired by an inotropic and a lusitropic abnormality (Fig. 18-8). Systolic dysfunction reduces stroke volume at any given preload (Fig. 18-8B) and causes venous pressure to rise in response to an increase in venous return that restores stroke volume (Fig. 18-8D). The steeper end-diastolic pressure–volume relationship in a heart with diastolic dysfunction (Fig. 18-8C) causes a similar increase in venous return to generate a much greater rise in venous pressure (Fig. 18-8E). This adverse effect of diastolic dysfunction is amplified because the steep end-diastolic pressure–volume relationship reduces the ability of the Starling’s law to increase stroke volume by impairing the ability of the ventricle to dilate. Similar differences are seen in chronic systolic and diastolic heart failure, and explain the rapid onset of severe pulmonary congestion (often called “flash pulmonary edema”) commonly seen in patients with diastolic heart failure.
Changes in Ventricular Architecture
The pressure–volume loops in Figure 18-5 through 18-8, which illustrate the consequences of acute changes in the inotropic and lusitropic properties of the heart, do not provide an accurate picture of what happens to patients when ventricular architecture is modified in chronic
heart failure (Fig. 18-9). Cavity enlargement in eccentric hypertrophy, which characterizes systolic heart failure, shifts the pressure–volume loops to higher volumes (Fig. 18-10C), whereas reduction in cavity size in concentric hypertrophy (Fig. 18-10A), which characterizes diastolic heart failure, shifts the pressure–volume loops to lower volumes.
heart failure (Fig. 18-9). Cavity enlargement in eccentric hypertrophy, which characterizes systolic heart failure, shifts the pressure–volume loops to higher volumes (Fig. 18-10C), whereas reduction in cavity size in concentric hypertrophy (Fig. 18-10A), which characterizes diastolic heart failure, shifts the pressure–volume loops to lower volumes.
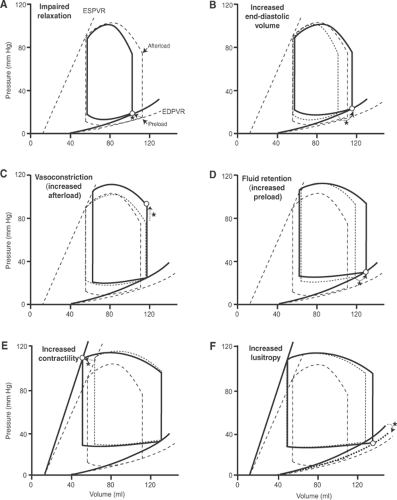 Fig. 18-6: Left ventricular pressure–volume loops after a sudden decease in the heart’s ability to fill; for clarity, the responses to an upward shift in the end-diastolic pressure–volume relationship (EDPVR) are shown sequentially. Hemodynamic and other changes are identified by dotted arrows (indicated by asterisks) that point to open circles which represent the new condition. In all six panels, the heart operating under baseline conditions is depicted using dashed lines; in panels B–F, the pressure–volume loop in the preceding panel is shown using dotted lines. A: Impaired relaxation shifts the EDPVR to the left and upward (solid curve), which causes the end-diastolic point (open circle) to move to a lower volume at a higher pressure; if afterload remains constant, stroke volume will be reduced. B: Reduced ejection leads to a further increase in end-diastolic pressure and volume (open circle), which according to Starling’s law increases stroke volume; this is apparent when the solid curves in A and B are compared. C: Vasoconstriction increases afterload (open circle), which moves the end-systolic point upward, thereby increasing ejection pressure but reducing stroke volume; this is apparent when the solid loops in B and C are compared. D: Fluid retention increases preload (open circle), which increases stroke volume but at the expense of increasing end-diastolic pressure and volume; this is apparent when the solid loops in C and D are compared. E: Increased contractility (dotted line) increases stroke volume, which is apparent when the solid loops in D and E are compared. F: Increased lusitropy (dotted line) increases stroke volume, which is apparent when the solid loops in E and F are compared. ESPVR, end-systolic pressure–volume relationship; EDPVR, end-diastolic pressure–volume relationship. |
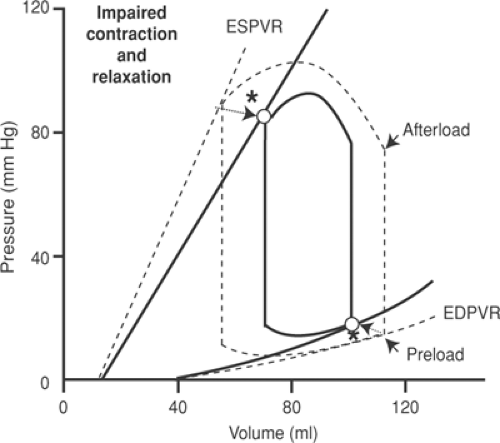 Fig. 18-7: Left ventricular pressure–volume loop after a sudden decease in the heart’s ability both to eject and to fill (solid lines). Hemodynamic and other changes are identified using dotted arrows that point to open circles that represent the new condition (indicated by asterisks). The pressure–volume loop for the heart operating under baseline conditions is depicted using a dashed line. ESPVR, end-systolic pressure–volume relationship; EDPVR, end-diastolic pressure–volume relationship. |
Although systolic heart failure is characterized by the inability to eject normally, filling is also impaired because dilatation increases wall stress at any diastolic pressure (the law of Laplace; see Chapter 11). In diastolic heart failure, where the underlying problem is inability to fill normally, the heart’s ability to eject is impaired when concentric hypertrophy reduces cavity volume. The steepness of the end-diastolic pressure–volume relationship in both types of heat failure is also increased by fibrosis that generally accompanies ventricular hypertrophy.
Effects of Atrial Pressure on Cardiac Output and Venous Return (Guyton Diagrams)
The interplay between venous return and cardiac output depicted in Guyton diagrams provides an additional way to view the effects of heart failure on cardiac performance and circulatory hemodynamics. These are illustrated in Figure 18-11, which describes the sequence of events that follows a decrease in ejection caused by depressed myocardial contractility. The initial effect is a shift in the intercept between the curves relating cardiac output to venous return that decreases stroke volume and increases atrial (venous) pressure (Fig. 18-11B). The latter then increases cardiac output according to Starling’s law of the heart (Fig. 18-11C). These changes do not initially affect blood volume, so that the curve relating venous return to atrial pressure does not change.
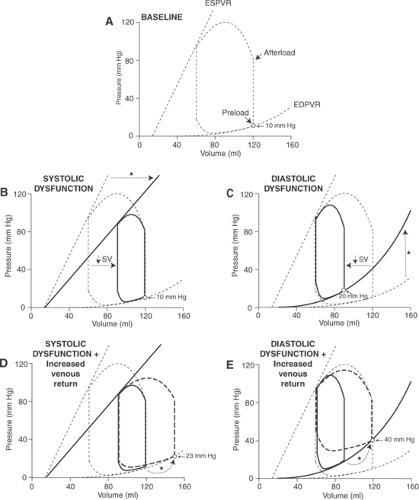 Fig. 18-8: Differences in the hemodynamic effects of the same increase in venous return in hearts with systolic and diastolic dysfunction. In all five panels, the heart operating under baseline conditions is depicted by dashed lines. Pressure–volume loops are shown under basal conditions (A), after a decrease in inotropy that causes systolic dysfunction (B, D), and after a decrease in lusitropy that causes diastolic dysfunction (C, E). B: The first beat after a reduction in inotropy that shifts the end-systolic pressure–volume relationship to the right and downward (solid arrow) reduces stroke volume by 50% (arrow labeled ↓SV); note that end-diastolic pressure and volume are unchanged. C: The first beat after a reduction in lusitropy that reduces stroke volume by 50% (arrow labeled ↓SV); because the decrease in diastolic compliance shifts the end-diastolic pressure–volume relationship to the left and upward (solid arrow), end-diastolic pressure increases from 10 to 20 mm Hg. D: The decrease in stroke volume shown in B increases end-systolic volume which, when added to the venous return causes end-diastolic volume to increase in subsequent beats. If venous return remained unchanged, the increased end-diastolic volume would restore stroke volume to normal by increasing end-diastolic pressure to ∼23 mm Hg (dotted arrow marked by an asterisk). E: The increased end-diastolic pressure shown in C causes end-diastolic volume to increase which, if the venous return in the next beat restored stroke volume to normal, would cause end-diastolic pressure to increase to ∼40 mm Hg (dotted arrow marked by an asterisk). The much higher diastolic pressures in diastolic dysfunction (C and E) than in systolic dysfunction (B and D) are caused by the greater shift of the end-diastolic pressure–volume relationship upward and to the left. ESPVR, end-systolic pressure–volume relationship; EDPVR, end-diastolic pressure–volume relationship; SV, stroke volume. |
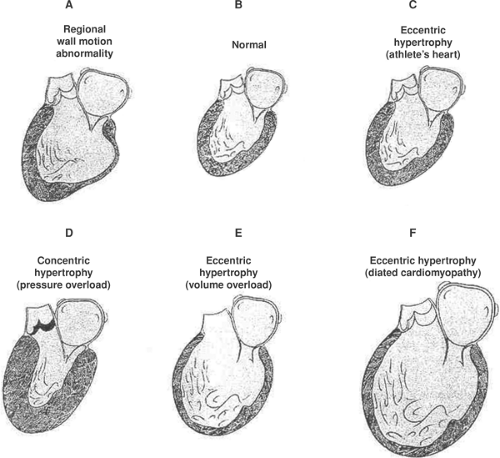 Fig. 18-9: Architectural patterns of cardiac hypertrophy. Normal left ventricle (B). The eccentric hypertrophy seen in the “athlete’s heart” (C), an example of physiologic hypertrophy, differs from the pathological eccentric hypertrophy in dilated cardiomyopathy, where ejection is decreased (F), and that caused by chronic volume overload where ejection is increased (E). Myocardial infarction, which causes a regional wall motion abnormality (A), leads to eccentric hypertrophy of the noninfarcted regions of the ventricle. All differ from the concentric hypertrophy caused by chronic pressure overload (D). |
Two components of the neurohumoral response (see Chapter 8) modify these curves. The first is fluid retention, which by increasing blood volume, shifts the curve relating venous return to atrial pressure upward and to the right (Fig. 18-11D); this response increases cardiac output (Starling’s law of the heart), but causes a further rise in venous pressure. The second component of the neurohumoral response, an increase in myocardial contractility (Fig. 18-11E), causes an upward shift of the curve relating atrial pressure to cardiac output which, by shifting the intercept upward and to the left, increases cardiac output and lowers atrial pressure.
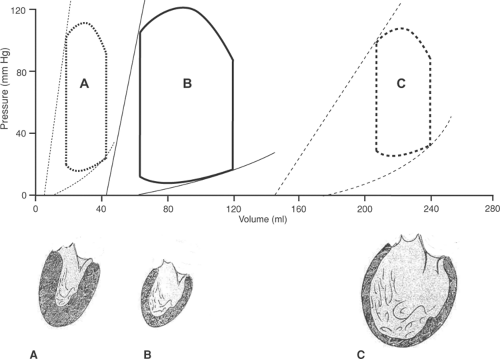 Fig. 18-10: Pressure–volume loops (above) in different architectural phenotypes of left ventricular hypertrophy (below). A: Concentric hypertrophy; B: normal; C: eccentric hypertrophy. (Based on Kass, 1988.)
Stay updated, free articles. Join our Telegram channel
Full access? Get Clinical Tree
 Get Clinical Tree app for offline access

|