Genomic Alterations in Lung Cancer


Genomic Alterations in Lung Cancer


Marileila Varella Garcia


Lung cancer has been the leading cause of cancer-related morbidity and mortality worldwide.1 These tumors are classified into two major clinicopathological categories, small cell lung carcinoma (SCLC) and non-small cell lung carcinoma (NSCLC). SCLC, accounting for 15% to 20% of lung cancers, displays neuroendocrine features and a propensity for rapid growth and early metastasis. NSCLC, accounting for the balance of approximately 80% of lung tumors, includes adenocarcinoma and squamous cell carcinoma, the two most common histological subtypes. Lung cancers, as other carcinomas, display numerous alterations in gene expression patterns resulting from acquired genetic and epigenetic mechanisms, including DNA methylation or histone modification across large chromosomal regions. Conventional and high-throughput technologies have detected scores of genomic changes occurring in individual specimens. However, few of those are recurrent changes among a large number of tumors, a characteristic that poses a challenge for the precise definition of molecular subtypes.

It is well-known that lung cancers show genetic instability, a persistent state that causes several mutational events leading to gross genetic alterations. This genomic instability is reflected in the heterogeneity of karyotypes and molecular profiles within a given tumor type and among different foci of the same tumor. Genomic changes in cancer may occur at different levels, ranging from the single nucleotide to an entire chromosome. Changes at one or few nucleotides, the mutations, may be completely innocuous or may be responsible for dramatic functional changes depending on the specific mutated site. Changes at the chromosomal level are usually detrimental since most likely affect large number of genes. Characterization of the genomic changes and identification of which molecular events contribute to the mechanisms that are central to tumorigenesis and to the multistep tumor progression are critical needs. Ultimately, the genomic discoveries will be translated into clinical tools that may impact the practice of cancer medicine.

In this chapter, we will review the most important genomic alterations detected in lung cancers. We will also discuss recent findings that have contributed to the better understanding of the molecular features of these tumors and to the development of strategies for earlier diagnosis and more efficient therapies.


CHROMOSOMAL STRUCTURAL ALTERATIONS AND GENOMIC IMBALANCES: METHODOLOGICAL STRATEGIES FOR DETECTION

Chromosomal alterations in cancer have been detected by classical cytogenetics methods, mainly banding karyotyping (G-, R-, or Q-banding). Solid tumors frequently exhibit numerous changes in chromosome numbers, including gain of whole-genome complement and gains and losses of specific chromosomes. Tumors also have structural intrachromosomal and interchromosomal rearrangements, which change the copy numbers of genes when deletions, duplications, or amplifications occur, and affect the transcription of genes when positioning changes are introduced by insertions, inversions, and translocations. Although conventional cytogenetic methods were fundamental for important discoveries on molecular mechanisms of hematological diseases, they failed to provide similar contribution on solid tumors. Typically, rearrangements in solid tumors are numerous and complex, and the resolution of 5 to 10 megabase (Mb) of the banding karyotype is not satisfactory for identifying the spectrum of genomic changes responsible for most of the specific biological characteristics of the cancer cell.

The development of molecular cytogenetic strategies such as multiplex fluorescence in situ hybridization (M-FISH)2 and spectral karyotyping (SKY)3 have facilitated the identification of extranumerary chromosomes and increased the accuracy of identification of chromosomal origins of complexly rearranged chromosomal (Fig. 6.1). M-FISH and SKY, which paint genomic material from each of the 24 human chromosomes in specific fluorescent colors, are technologies especially tailored
to uncover interchromosomal rearrangements and have been successful in revealing subtle karyotypic alterations, which would be otherwise overlooked.
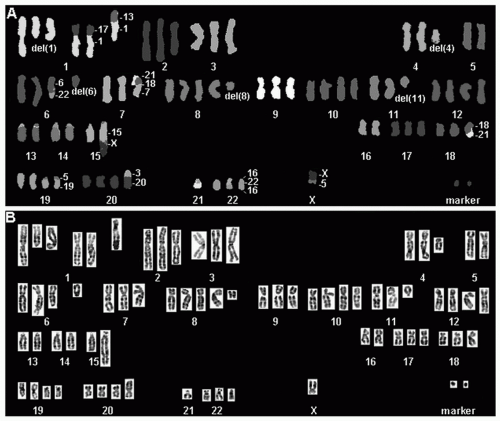


FIGURE 6.1 SKY of a primary lung adenocarcinoma showing numerous numerical and structural chromosome changes. The classifiied image with the pseudocolors is shown in (A) and the inverted-DAPI image is shown in (B). The specimen was near triploid, with extra copies of chromosomes 1, 10, 12, 19, and 20 and deletions of segments of chromosomes 1, 4, 5, 6, and 11. Translocations were found involving chromosomes 1 and 13, 1 and 17, 3 and 20, 5 and 19, 5 and X, 6 and 22, 7, 15, and X, 18 and 21, 16 and 22, and 18 and 21. Two very small marker chromosomes were found carrying chromosome 2 sequences. (See color plate.)

For detection of genomic imbalances, the cornerstone technology was the comparative genomic hybridization (CGH), which was introduced in the early 1990s.4 As proposed initially, CGH involved hybridization of differentially labeled DNA from two genomes, the genome to be tested and a normal genome used as a reference against a normal metaphase template. This approach is called metaphase CGH (mCGH) or chromosomal-based CGH (cCGH). Measuring the fluorescent intensity that dominates each given chromosome region in the template allows the identification of regions in the tested genome carrying normal copy numbers or gains and losses relative to the normal reference. Although mCGH proved to be useful for detection of genomic imbalances in solid tumors, the analysis is performed in metaphases and the high level of chromatin condensation at that cell cycle stage also limit the resolution of genomic changes to 5 to 10 Mb. Importantly, several studies have shown that the expression of genes located in chromosomal regions of gains or losses varies consistently with the DNA copy number.5,6,7,8,9,10 The availability of genomic resources and technological advances has fostered a major improvement in the last decade, represented by the shift from cCGH to microarray-based platforms. In their first generation, called matrix-CGH and array CGH,11,12 these arrays included only few hundreds of DNA clones. Soon after, two microarray platforms were launched using bacterial artificial chromosome (BAC) clones as DNA probes. These instruments, the tiling BAC array13 and the 1-Mb resolution whole-genome BAC array14 were able to mine the entire genome for copy number variants. Despite the fact that the BAC arrays cannot reliably detect aberrations smaller than the BAC insert (100 to 200 kilobase [kb]), these new tools granted a significantly higher detection rate for copy number abnormalities than any of the metaphase-based cytogenetic techniques.


More recently, oligonucleotide-based arrays have emerged as the platform of choice for genome-wide analysis of copy number alterations because of their high-throughput and highresolution characteristics. Some of the commercially available oligonucleotide arrays have probes specifically developed for detection of copy number variation (NimbleGen Systems and Agilent Technologies), whereas others were developed as genotyping arrays designed to identify single-nucleotide polymorphisms (SNPs) and later modified to uncover copy number variations (Affymetrix and Illumina). The NimbleGen CGH microarrays contain 45- to 85-mer oligonucleotide probes that are directly synthesized on a silica surface using light-directed photochemistry. A whole-genome tiling array is available with 2.1 million probes (HG18 WG Tiling 2.1M CGH v2.0D) and custom tiling arrays are also available. The Agilent Human Genome CGH Microarray (G2519A) contains 60-mer oligonucleotide probes printed onto glass slides through an industrial inkjet printing process. This microarray includes 40,000 probes spanning the human genome with an average spatial resolution of 75 kb, including coding and noncoding sequences, and has an emphasis on the most common cancer-related genes. Agilent arrays may also be customized from more than 8 million predesigned and validated probes. With the NimbleGen Systems and Agilent Technologies platforms, the test and reference genomes are labeled with different fluorophores (usually Cy3 and Cy5), and cohybridized to the same array, similarly to the mCGH technology. The signal intensity ratio of the test sample versus the reference sample is calculated for each probe across the entire genome.

The Affymetrix GeneChip arrays contain 25-mer SNPbased oligonucleotide markers or probes directly synthesized on the array surface. The Genome-Wide Human SNP Array 6.0 features 1.8 million genetic markers designed to uniformly cover the entire genome, including approximately half in SNPs and half in non-SNP probes for the detection of copy number variation. For the evaluation of copy number changes, the test genome is labeled and hybridized to the array and the signal intensity from the probes is computationally compared with a control set (HapMap individuals). The Illumina BeadChip arrays are made from silica beads that are self-assembled on silica slide microwells and each bead is covered with specific 50-mer SNP-based, oligonucleotide probes. The HumanCNV370-quad DNA Analysis Beadchip platform covers approximately 380,000 SNP and non-SNP-based probes. The test specimen is hybridized with the array and the copy number variations are determined by computationally comparing the signal intensity from probes with a control set provided by the platform manufacturer.

These high-resolution platforms have been successfully used to identify copy number changes in lung cancer and other solid tumors. However, two major characteristics of the solid tumors, the largely abnormal number of chromosomes and the intratumor heterogeneity, make copy number analyses difficult in these platforms. Current array CGH platforms were designed under the assumption that the natural ploidy state of the test DNA specimen is diploid, which is rarely the case in solid tumors. Therefore, the detection of a single-copy gain may represent a gain if the specimen is diploid or actually represent a loss if the specimen is tetraploid, a condition that is most common in solid tumors. Additionally, tumors are often mixtures of distinct types of cells, each of them potentially carrying different copy number changes. Because the DNA from the test specimen is extracted from the cell mixture, the results reflect an average change across the different cell types. Changes occurring in cell-specific compartments are likely to be diluted and remain undetected.

For the genome-wide high-resolution arrays, another perceived limitation is the detection of copy number variations that may not be involved in the disease. Recent studies have shown that normal, healthy individuals carry a large number of copy number variations detected by more than one consecutive probe in BAC and oligonucleotide arrays.15,16 Thus, a more detailed characterization of the variation in the normal genome is necessary before an accurate detection of pathogenic copy number aberrations can be reached in tumors.

Chromosomal abnormalities detected by conventional and molecular technologies and genomic imbalances detected by mCGH or array platforms have been validated by independent laboratory approaches, such as fluorescence in situ hybridization (FISH) or polymerase chain reaction (PCR)-based techniques. FISH is a high-resolution technique able to identify specific regions involved in rearrangements and define them accurately (Fig. 6.2). FISH, as opposed to the PCR-based techniques, has among its critical advantages the ability to investigate the target phenomenon in single cells and to preserve the original tissue architecture. However, FISH is not a highthroughput technology and is unable to answer genome-wide questions. Nevertheless, the development of FISH methods has significantly improved the accuracy of solid tumor cytogenetics. Ultimately, it is the combination of multiple technical approaches that provides the most powerful strategy for understanding the molecular pathways underlying the lung tumor development.


CHROMOSOMAL ABNORMALITIES AND GENOMIC IMBALANCES IN LUNG CANCER: THE PUZZLING PICTURE

Alterations in the DNA content have been well documented in lung carcinomas by flow cytometry and static tissue morphometry. A metaanalysis including data from 4033 NSCLC patients from 35 published studies has shown that the majority of NSCLC were aneuploidy and patients with aneuploid tumors had a significantly shorter survival duration than those with normal DNA content reflecting both diploid and pseudodiploid chromosome NSCLC.17 However, the aneuploid chromosomal complement in the tumor cells included great variety of structural and numerical changes, many of which could be random events.

The search for recurrent abnormalities in lung cancer, the ones most likely to play specific roles in cancer development,
has started long ago. The first recurrent changes in lung cancer, the deletions of 3p in SCLC, were identified by classical karyotypic analysis.18 However, probably because of the complexity of the chromosomal alterations and the limitations of the conventional techniques, few karyotype reports of primary lung tumors or cell lines were published in the 2 decades following that seminal publication.19,20,21,22,23,24,25,26 Loss of large chromosomal segments in 3p and 8p, gain of whole chromosomal arms, such as 5p, and amplification by homogeneously staining regions (HSR) and double minutes (DM) were reported. However, the conclusions of all those studies were by and large limited, often yielding incomplete karyotypes.
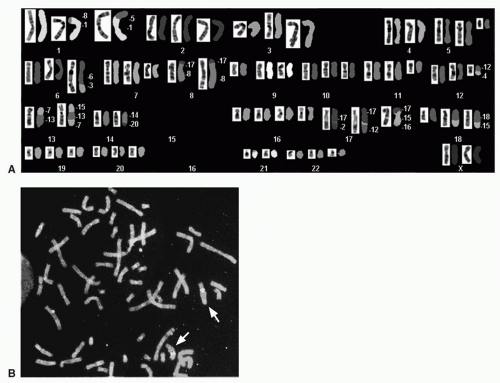


FIGURE 6.2 A: SKY of the non-small cell lung cancer cell line Calu 3 showing multiple abnormalities and two copies of abnormal chromosome 17, derivatives from the translocations between chromosomes 17 and 2 and chromosomes 17 and 12. In addition, the chromosome 17 material identified by SKY in the long arm (q-arm) of these derivative chromosomes was larger than expected if that arm was normal. B: FISH analyses with a probe set including ERBB2 and CEP 17 sequences demonstrated that there was ERBB2 gene amplification in both derivatives (indicated by the arrows). In the FISH assays, ERBB2 probe is highlighted by red color and CEP 17 by green color. (See color plate.)

The advent of the CGH technology brought new momentum to the cancer field and has also impacted discoveries. Novel and histological type-specific gains and losses of chromosome segments in lung cancers were revealed in addition to those previously reported by conventional cytogenetic approaches. Chromosomal gains were detected in the long arms of chromosomes 8, 17, and 19 in NSCLC and chromosome arms 3q, 8p, and Xq in SCLC. Chromosome losses were frequent in 1p, 4q, 5q, 6q, 8p, 9p, 13q, and 17p in NSCLC and in 5q, 13q, and 17p in SCLC.21,22,27,28,29,30,31

In the end of the 1990s, studies using M-FISH and SKY were performed in lung carcinoma cell lines that had been established previously at the National Cancer Institute laboratories or were newly established by other investigators, and from resected tumors. Those studies have resulted in the identification of a greater degree of chromosomal rearrangements than it been detected by previous G-banding and mCGH analyses.32,33,34,35,36,37,38,39,40,41,42,43 Chromosomal abnormalities were also detected in nonmalignant bronchial epithelium of heavy smokers.44 M-FISH and SKY technologies enabled the disclosure of cryptic translocations, enhanced the ability to delineate chromosomal breakpoints when integrating information from conventional banding analysis, and clarified the chromosomal composition of unrecognized marker chromosomes. Important similarities were noticed between karyotypic changes in established cell lines and primary tumors. The vast majority of translocations were unbalanced but a significant number of balanced translocations were also detected. These studies have provided a basis for the search of genes mapped at the breakpoints that were potentially deregulated and associated with tumorigenesis.

Despite all these efforts, discovery of recurrent gene fusions generated by structural rearrangements based on cytogenetics approaches has been quite rare. One such example was the identification of a translocation between the chromosomes 15 and 19 [t(15;19)(q11;p13)] in an aggressive lung cancer metastatic to mediastinum and bone arising in a young woman without a history of smoking or a family history of cancer.45 The breakpoint on chromosome 19 was mapped to the 5′ region of the highly overexpressed NOTCH3 gene, which led to further investigations of the role of this gene in lung cancer.
Notch3 expression was detected in approximately 40% of resected lung tumors and positively correlated with epidermal growth factor receptor (EGFR) expression. Notch inhibition was shown to increase sensitivity to EGFR tyrosine kinase inhibitors (TKIs) and decrease mitogen-activated protein kinase (MAPK) phosphorylation, observations that support a role for NOTCH3 signaling in lung cancer through EGFR-related pathways.46 The translocation breakpoints were later refined to 15q13.2 and 19p13.1 and the cloning of these regions identified a novel fusion transcript in which the 3′ end of the BRD4 gene on chromosome 19p was fused to the 5′ end of the NUT gene on chromosome 15q. The BRD4-NUT fusion was demonstrated to alter the cell cycle kinetics, augmenting the inhibition of the progression G1 to S phase compared with the wild type BRD4 gene. However, the exact role of the BRD4- NUT fusion in the pathogenesis of lung cancers remains unclear and the t(15;19) has not been found in large lung cancer cohorts tested, which suggest that it is not common in lung cancer.47 Gene fusions detected using other strategies are going to be discussed later. The detection of the intracellular targets of these fusions is expected to bring new insights into molecular pathways that trigger tumor development.

A much more detailed picture of genomic copy number variations has been achieved in the last years with the array analyses. A summary of detected focal gain and losses is presented in Table 6.1 for five studies focusing on SCLC specimens19,48,49,50,51 and in Table 6.2 for 13 studies focusing on NSCLC specimens.19,51,52,53,54,55,56,57,58,59,60,61,62 Although data are available for over 70 SCLC and close to 800 NSCLC specimens, including cell lines and primary tumors, it is difficult to compare those results. Different platforms had different probes, and it is not always possible to confirm equivalencies. Despite these limitations, it is evident that there are important recurrent genomic changes in lung cancer. The most frequently occurring high-amplitude focal amplicons in lung cancer determined by at least two studies are listed in Table 6.3. Among those, are members of the MYC family (MYCL1, MYCN, and MYC), participants in the EGFR pathways (EGFR, PIK3CA, KRAS), and other genes, such as FGFR1, TP63, TERT, and the cyclins CCND1 and CCNE1. Some are potentially novel oncogenes in lung (NKX2-1, for instance) that cooperate to promote lung cancer cell proliferation.


TABLE 6.1 Genomic Regions Showing Gains and Losses in Small Cell Lung Carcinoma Primary Tumors and Cell Lines Detected by Comparative Genomic Hybridization


Reference


Technique


Specimen


Genomic Gain


Genomic Loss


Balsara and Testa19


Oncogen


mCGH


3q26-29, 5p12-13, 8q23-24


3p13-14, 4p32-35, 5q32-35, 8p21-22, 10q25, 13q13-14, 17p12-13


Peng et al.50


Cancer Sci


Array CGH


10 primary tumors


1q,2q31-33, 3q21-29, 5p12-14, 7q21-33, 8q21-24, 12q13-23, 18q11-2


1p35-36, 3p14-26, 4q21-31, 5q21-35, 10q, 13q33-34, 16q21-24, 17p11-13, 22q11-13


Zhao et al.51


Cancer Res


SNP array 19 primary tumors, 5 cell lines


1p34.2, 2q24.3-p24.2, 8q24.13-q24.21, 19q12


3q25.1, 9p23, 10q23.31


Coe et al.48


Genes Chromosomes Cancer


32K BAC array CGH


14 cell lines


1p34-36, 2p16-25, 3q21-29, 5p, 6p21, 7p22, 7q11.23, 8q24, 9q34, 11q13-14, 12p13, 12q22-24, 13q32-34, 14q, 16p, 17q, 19p, 19q, 20q, 21q22


3p, 4q, 5q, 8p, 10p, 10q, 13q, 17p,


Kim et al.49


Oncogen


BAC array CGH


24 cell lines


1p36.33, 1p34.2, 2p24.3, 2q22.3, 6p22.3, 8q12.3, 8q22, 8q24.21, 9p24.1, 11q14.2, 11q23.1, 12p13.31, 12p12.1, 12p11.22, 12p11.21, 12q24.33, 13q14.3, 14q11.2, 14q11.2, 14q22.3, 20q11.21, Xq22.2


2q24.3, 3p21.31, 4q21.23, 5q14.3, 5q23.2, 10q22.2, 16q23.1, 16p13.3, 16q23.1


The consolidation of the available data contributes to a growing body of evidence that multiple cooperating oncogenes participate in these amplification events in an apparently nonrandom frequency. These findings have important implications for the design of functional genomic studies projects aimed at identifying cancer-relevant genes because single-gene assays will not uncover activities that rely on interaction among multiple collaborating genes.


ABNORMALITIES IN GROWTH-INHIBITORY PATHWAYS: THE TUMOR SUPPRESSOR GENES

The chromosomal, genomic, and epigenomic studies addressed previously have revealed multiple changes involving tumor suppressor genes and oncogenes in clinically evident lung cancers.

The tumor suppressor genes, also known as recessive oncogenes, are inactivated by genetic mechanisms such as point mutations, chromosomal rearrangements, and mitotic recombinations, and by epigenetic events like hypomethylation or hypermethylation of gene promoter regions. It is largely accepted that the inactivation of tumor suppressor genes commonly occurs through a combination of two or more events, the Knudson hypothesis. Still, it is also recognized that the phenomenon in carcinomas is more complex because of mutational instability and chromosomal instability.63 The major tumor suppressor genes involved in lung cancer are TP53 (17p13.1), RB1 (13q14.11), CDKN2 (p16INK4a or MST1, 9p21), and several genes located at the short arm of chromosome 3. The incidence of abnormalities in each of these genes in lung cancer, their main role in the development of the disease, and their contribution as prognostic or predictive markers will be briefly summarized.


TABLE 6.2 Genomic Regions Showing Gains and Losses in Non-Small Cell Lung Carcinoma Primary Tumors and Cell Lines Detected by Comparative Genomic Hybridization


Reference


Technique


Specimen


Feature


Genomic Gain


Genomic Loss


Balsara and Testa19


Oncogene


mCGH


1q31, 3q25-27, 5p13-14, 8q23-24


3p21, 8p22, 9p21-22, 13q22, 17q12-13


Jiang et al.56


Neoplasia


mCGH and cDNA arrays


6 SqCC, 14 ADC


Amplif, deletion common to both hystologies


1p36.3, 1q21, 1q21.3, 1q32, 2p12, 3q25.1, 5p15.2, 5p15.1, 5q35.3, 6p21.31, 7p22.3, 7q22.1, 8q22.1, 8q23.1, 11q13.3, 16p13.3, 17q23, 20q13.3, 22q11.23, Xp11.23, Xq13.1, Xq28


1p36, 1p35, 1p33, 1p32, 2p12, 2p12, 3p22, 3p21.3, 3p21.1, 4p15.2, 4p15.2, 4q22.1, 4q21, 5q23, 5q34, 6q23, 6p21.3, 8p22, 8p21, 9p21, 9q34.1, 10q21, 10q22.2, 10q23.2, 10q23.3, 12q24.3, 13q34, 15q21, 17q21, 18p11.3, 18p11.2, 18q21, Xq21.3, Xq26.1


Kim et al.57


Clin Cancer Res


1Mb BAC array Sanger


29 scc, 21 adc


Minimal recurrent


1p36.31-p34.1, 1p32.3, 1q21.1-q23.3, 2p16.1-p12, 3q26.1-q28, 5p15.2-p15.1, 6p21.31-p21.1, 8p12, 8q11.21-q12.1, 8q24.11-q24.3, 19p13.2-p13.11, 19q13.12, 20q13.33


5p21.2-q31.1, 13q21.1, 13q34, 20q13.2


Tonon et al.59


Proc Natl Acad Sci U S A


aCGH


1p36.32, 1p34.3, 1q32.2, 2q11.2, 2q31.2, 5p15.33, 5q31.3, 8p12-8p11.22, 10q24.1, 10q26.3, 12q13.2, 14q32.13, 16q22.2, 18q12.1, 19q13.33, 20q11.21


7q34, 11q11, 13q12-11, 13q32.2, 21p11.2-21p11.1


Zhao et al.51


Cancer Res


CentXba and CentHind SNP Affy


51 primary tumors, 26 cell lines


Recurrent regions


3q26.31-q27.1, 7p12.1-q11.22, 8p12-p11.22, 8q24.13-q24.21, 12p11.21, 12q13.3-q14.1, 19q12, 22q11.21-q11.22


2q22.1, 3p14.2, 3q25.1, 9p23, p921.3


Choi et al.52


Lung


1.4K BAC aCGH Macrogen, Korea


15 ADC


Most frequent regions


1p36.33, 2q35, 5q35.3, 7p15.2, 7q35, 8q24.3, 11p15.4, 116p13.3, 17q25.3. 19q13.42, 20113.33, 21q22.3, 22q13.33


1q31.2, 2p16.3-p16.2, 4q35.1, 5q13.1, 7p12.3, 9p11.2, 11p15.1, 11q12.2, 13q33.1, 14q32.33, 19p13.2


Garnis et al.55


Int J Cancer


32,433 BAC aCGH Lam


28 cell lines


>75% for gain, >50% for loss


5p15.33, 7p22.3-7p22.1, 7p15.3-7p11.2, 7q11, 7q11.23, 8q24,21, 11q13.3, 17q25.3, 20q11.21-11.23, 20q13.33


1q21.1, 3p24.2-24.2, 3p24.1, 3p14.2-14.1, 4q13.5-q31.23, 4q33-q35.2, 6p15-q23.1, 6q24.1-q27, 8p23.3-p11.22, 9p23, 9p22.1-p21.1, 9p13-p11.2, 9p13-q21.33, 10p, 10q23.1-q26.3, 13q, 15q13.1-q15.2, 15q22.2, 18q11.2-23, 19p13.11-p12, 21q11.2-q21.3, 22q13.1


Ma et al.58


J Pathol


mCGH after DOP PCR amplification


23 tu


Most frequent regions


3q22-29, 12q23-qter, 16q23-24, 17q12-22, 17q23-25, 19q13, 20q12-13, 21q22, 22q


3p22-24, 4q32-qter, 5q21-23


Yakut et al.61


Lung Cancer


mCGH


21 SqCC, 24 nSQCC


Focal amplifications


3q21-29, 5p, 7p11, 7q21-31, 8q24, 12p, 12q13-15, 18p


Choi et al.53


Lung Cancer


MACArray Karyo 1.4K BAC Macrogen, Korea


14 SqCC


Most frequent regions


1p36.33, 2p22.1, 2q33.2, 3q28, 5p12, 6q21, 7p14.2, 7q33-35, 13q34-qter, 21q22.3, 22q11.2


1p13.3, 5q34, 8p23.3, 10q26.12, 13q14.2, 14q23.33, 15q14, 17q11.2, 19q13.11


Dehan et al.54


Lung Cancer


mCGH and 11K cDNA Agilent


23 NSCLC


Common aberrations


1q22-32.1, 2p21.2-p14, 2q11.2-q32.2, 3p14.3-q26.33, 4p16.1-q34.3, 5p15.33-13.3, 7q22.3-q31.32, 8q11.21-q24.3, 11q14.1-q22.3, 12p13.2-p11.22


1p36.33-32.3, 3p25.3, 5q23.3-q35.3, 6p22.1-p21.1, 9q33.3-q34.3, 10q22.1-26.3, 11p11.2, 11q12.2-13.4, 12q24.11-24.33, 12q13.12-14.1, 15q24.1-24.2, 16p13.3-22.2, 17p13.3-25.3, 19p13.3-13.43, 22q11.1-13.33


Kendall et al.62


Proc Natl Acad Sci U S A


85K oligoarray Nimblegen Systems


77 lines, 184 lung tumors


Focal amplifications


1p34.2, 1q21.2, 2p24.3, 5p15.33, 7p11.2, 8p12, 8p11.21, 8q24.21, 11q13.3, 12p12.1, 12q15, 14q13.2


Weir et al.60


Nature


500K SNP HMA Aff


371 ADC


Focal amplification


1q21.2, 2p15, 3q26.2, 5p15.33, 5p15.31, 5p14.3, 6p21.33, 6p21.1, 7p11.2, 7q21.2, 8p11.23, 8q21.13, 8q24.21, 11q13.3, 12p12.1, 12q14.1, 12q15, 14q13.3, 17q12, 18q11.2, 19q12, 19q13.12, 20q13.32, 22q11.21


5q11.2, 7q11.22, 9p23, 9p21.3, 10q23.31, 13q14.2, 18q23


The TP53 gene is well-known for playing a key role on the negative regulation of G1/S-phase transition of the cell cycle64 and for being the gatekeeper for apoptosis.65 Mutations and overexpression of TP53 are present almost universally in SCLC and in approximately 50% of NSCLC.66,67,68,69 Mutations in TP53 have been associated with smoking70 and more aggressive tumors66,71; nevertheless, some studies have failed to show a prognostic role for this abnormality.72 Physical and functional loss of TP53 and p53 protein overexpression have been identified in dysplastic bronchial epithelium as a highly predictive marker for lung cancer.65,73,74,75,76 TP53 is regulated upstream by the oncogene MDM2 (12q13-q14), which is overexpressed in 25% of NSCLCs.77 The p53 protein also interacts with BCL2, which is a negative regulator of cell death prolonging survival of noncycling cells and inhibiting apoptosis.78 Positive immunostaining for BCL2 was found in approximately 20% of NSCLC patients and 80% of SCLC.78,79,80

The G1/S transition checkpoint is also deregulated in lung cancer cells by changes in RB1, CDKN2, CCND, and CDK4. The retinoblastoma gene (RB1) controls the G1/S transition through E2.81,82 Loss of RB1 function by deletion and nonsense mutation or splicing abnormalities, together with loss of the wild-type RB1 allele, are very common phenomena in SCLC while occurs in less than 30% of NSCL.82,83,84,85,86 In NSCLC, a strong correlation between altered RB1 protein expression and early stage has been documented.87 However, correlation between loss of RB1 and clinical outcome is still controversial, with earlier findings of negative prognostic impact on survival in early stage NSCLC88 not confirmed in later studies.89,90


TABLE 6.3 Genomic Regions Exhibiting Focal Amplification in Lung Cancers, Detected by at Least Two Independent Studies Using Comparative Genomic Hybridization Analyses


Cytoband


Potential Genes


Kim et al.57 50 NSCLC


Zhao et al.51 101 NSCLC


Choi et al.52 15 ADC


Yakut et al.61 45 NSCLC


Choi et al.53 14 SqCC


Kendall et al.62 184 Lung Tumors


Weir et al.60 371 ADC


1p34.3


MYCL1


X


X


1q21.2-q22


ARNT


X


X


X


2p24.3


MYCN


X


X


3q26.3


PIK3CA


X


X


X


3q27-3q29


TP63


X


X


5p15.33


TERT


X


X


X


X


5p15.31


X


X


5p14.3


CDH12


X


X


6p21.3


X


X


7p14.2-14.3


X


X


7p11.2-12


EGFR


X


X


X


X


X


7q21.2-21.3


HGF, CDK6


X


X


X


8p11.23


FGFR1


X


X


X


8q24.21


MYC


X


X


X


X


11p15.4


X


X


11q13.3-13.4


CCND1


X


X


X


12p11.2


KRAG, others


X


X


12p12.1-12p11.2


KRAS, PTHLH


X


X


X


12q13.3-14.1


CDK4


X


X


X


12q15


MDM2


X


X


X


X


14q13


TITF1, FKHL1


X


X


18q11.2


SYT


X


X


19q12


CCNE1


X


X


19q13.1-13.3


X


X


X


22q11.21


CRKL


X


X


X


The CDKN2 gene encodes an inhibitor of the cyclin-dependent kinase 4 and its inactivation occurs through homozygous deletion, or hemizygous deletion coupled with inactivation of the second allele by point mutation or promoter hypermethylation.91 Loss of 9p has been detected frequently in NSCLC (16% to 100%) (Fig. 6.3A) but not in SCLC.92,93,94,95,96 Loss of 9p21 is also relatively frequent in very early epithelial lesions such as hyperplasia or dysplasia70,73,97,98,99 and hypermethylation at this site was found to increase during disease progression, from 17% in hyperplasia to 50% in CIS.97 CDKN2 hypermethylation has been reported to predict poor 5-year survival rate in resectable NSCLC,100 and early recurrence in resected stage I NSCLC.101

In lung cancer, partial deletion of the short arm of chromosome 3 (3p) has been one of the earliest and most common genetic changes (Fig. 6.4). Chromosome 3p deletion occurs in almost 100% of SCLC and 90% of NSCLC.102,103 Searches for tumor suppressor genes in this large region identified several targets at multiple sites, including FHIT (3p14.2), RASSF1 (3p21.3), TUSC2 (FUS1, 3p21.3), SEMA3B (3p21.3), SEMA3F (3p21.3), MLH1 (3p22.3), and RARB (3p24). FHIT is one of the most extensively investigated suppressor genes in lung cancer104,105,106; allelic imbalance at FHIT was observed in 64% of NSCLC patients and loss of protein expression in 50% of lung cancers.105,106,107 Allelic imbalance is associated with physical loss of the chromosomal region (Fig. 6.3B). RASSF1 is inactivated by promoter hypermethylation in the large majority of SCLC and almost half of the NSCLC,108,109,110,111 while not methylated in noncancerous tissues.112 Expression of TUSC2 protein is absent or reduced in the majority of lung cancers
and premalignant lung lesions and restoration of its function in 3p21.3-deficient NSCLC cells significantly inhibits tumor cell growth by induction of apoptosis and alteration of cell cycle kinetics.113 Both SEMA3F and SEMA3B transcripts are underrepresented in lung cancers, mainly squamous cell carcinomas. A recent review114 indicated that downregulation of SEMA3B and SEMA3F is sustained by gene hypermethylation in lung cancer cell lines.115,116 Moreover, the loss of function of these genes correlates inversely with grade and stage of lung cancer.98,117 Additionally, the SEMA3B and SEMA3F genes were found to be targets of TP53,118,119 which suggests that they could be activated during DNA damage or other stress responses. Deregulation in MLH1, a mismatch repair gene, was detected in up to 78% of NSCLC specimens, predominantly
by promoter hypermethylation120 and more recently has been associated with poor prognosis in NSCLC.121 RARB mediates growth control responses122,123 and its expression was found reduced in about 50% of NSCLC and 70% of SCLC.124 Promoter hypermethylation is the leading cause of silencing of this gene. Conclusions have been controversial regarding the prognostic role of RARB suppression in lung cancer125,126 as well as regarding the efficacy of retinoids as chemopreventive agents for this disease.127,128

Only gold members can continue reading. Log In or Register to continue

Stay updated, free articles. Join our Telegram channel

Aug 25, 2016 | Posted by in CARDIOLOGY | Comments Off on Genomic Alterations in Lung Cancer

Full access? Get Clinical Tree

Get Clinical Tree app for offline access