Current data regarding gender disparities in outcomes after acute pulmonary embolism (PE) are limited and controversial. We sought to assess the gender-specific rates and trends in treatment, outcomes, and complications after acute PE. We used the 2003 to 2011 Nationwide Inpatient Sample database for this analysis. All hospital admissions with a principal diagnosis of acute PE were identified using the International Classification of Diseases, Ninth Edition , codes. Inhospital mortality and discharge to nursing facility were co-primary outcomes of our study. Secondary outcomes included shock, transfusion of blood products, utilization of thrombolysis, inferior vena cava filter placement, and cost of hospitalization. Over a 9-year period, a total of 276,484 discharges with acute PE were identified. Compared with men, there was significantly higher inhospital mortality in women admitted with acute PE (odds ratio [OR] 1.09, 95% confidence interval [CI] 1.03 to 1.15). In addition, there was a significantly higher need for discharge to nursing facility among women compared with men (OR 1.30, 95% CI 1.27 to 1.34). Besides this, women experienced a higher need for transfusion (OR 1.38, 95% CI 1.33 to 1.44) and occurrence of shock (OR 1.10, 95% CI 1.01 to 1.18) during hospitalization. Furthermore, there was a significantly lower utilization of vena cava filters (OR 0.86, 95% CI 0.84 to 0.89) in women compared with men. Among patients in shock who were eligible for thrombolysis (age <75 years, no previous stroke, no bleeding on presentation, and not pregnant), the utilization of thrombolysis was similar between men and women (OR 1.19, 95% CI 0.93 to 1.53). Lastly, the cost of hospitalization after acute PE was significantly higher in men than women (adjusted mean difference $425, 95% CI $304 to $546). In conclusion, among patients admitted with acute PE, women tend to have more adverse outcomes and higher incidence of complications compared with men.
Venous thromboembolism represents the third most common vascular disorder affecting adults in the United States. Current data regarding gender disparities in outcomes after acute pulmonary embolism (PE) appear to be limited and controversial. Given the high prevalence of venous thromboembolism and a high case fatality rate of acute PE, it is important to better understand the role of gender on outcome for this common condition. To that end, we conducted a study to assess the sex-specific rates and trends in treatment, outcomes, and complications after acute PE, using a large national representative database of hospitalizations in the United States.
Methods
Data for the current analysis were obtained from the Nationwide Inpatient Sample (NIS) database from 2003 to 2011. The NIS contains discharge-level data from approximately 8 million hospitalizations annually from about 1,000 hospitals across the United States. The NIS database provides up to 15 diagnoses and 15 procedures for each hospitalization record for the years 2003 to 2008. The number of diagnoses coded in the database was expanded to 25 for the years 2009 to 2011. All these have been coded using the standard International Classification of Diseases, Ninth Edition, Clinical Modification ( ICD-9-CM ) codes. The first diagnosis in the database is referred to as the “principal diagnosis” and is considered the primary reason for admission to the hospital. All hospitalizations with the principal diagnosis of acute PE were included in our study. These were identified using ICD-9-CM codes of 415.11, 415.12, 415.13, and 415.19. Because of their heterogeneous nature, the hospitalizations where acute PE was a secondary diagnosis (e.g., postsurgical) were not included. To avoid double counting of hospitalizations, patients who presented as a “transfer-in” from another health care facility were excluded from analysis.
We used the Clinical Classification Software (CCS) to identify patient co-morbidities and procedures. The primary variable of interest was patient gender, which was reported in the NIS database for every hospital admission. Other baseline characteristics available for analysis included age, race, primary source of payment, socioeconomic status (SES, based on residential Zip code), and Elixhauser co-morbidities including obesity, coagulopathy, and cancer along with other clinically relevant co-morbidities like smoking. Hospital characteristics, such as region (Northeast, Midwest, South, and West), bed size (small, medium, and large), location (rural and urban), hospital ownership (federal and private), and teaching status were also included.
Inhospital mortality and residual disability requiring discharge to nursing facilities including long-term acute care or extended care facility or subacute nursing facility were co-primary outcomes of our study. The latter outcome was analyzed for hospital survivors only. Several secondary outcomes were also analyzed to assess disparities in complications and resource utilization. Specific complications that were analyzed in our study included presence of shock during admission (CCS diagnosis code: 249) and transfusion of blood products (CCS procedure code: 222). Resource utilization was assessed using rates of thrombolysis ( ICD-9-CM : 99.10, V45.88), surgical thrombectomy/embolectomy/endarterectomy (38.05 and 38.15), inferior vena cava (IVC) filter placement ( ICD-9-CM : 38.7), and the overall cost of hospitalization. The NIS database provides the total charges for hospital stay that were claimed by the respective hospital. The total charges of each hospital stay were converted to cost estimates using the group average all-payer inhospital cost and charge information from the detailed reports by hospitals to the Centers of Medicare and Medicaid Services. All costs and charges were converted to projected estimates for the year 2011, after accounting for annual inflation rates based on consumer price index data available from the Bureau of Labor Statistics. In addition to analyzing differences in the aggregate outcomes, we also analyzed the trends in outcomes over the entire study duration after stratifying by gender category.
Continuous variables are presented as mean ± SD, and categorical variables are presented as proportions. For comparing the means of continuous variables among ≥3 categories, we used 1-way analysis of variance. The chi-square test was used for comparison of categorical variables. Because the data from NIS represent a collection of scattered hospital clusters, analysis was structured to account for a complex, multistage, probability sampling. Multivariable hierarchical logistic regression analysis was used to compare outcomes between the 2 genders. The analysis of all outcomes has been presented after adjusting for age, race, SES, Elixhauser co-morbidities, smoking, primary payer, and hospital characteristics. Because the variable “race” had ∼22% missing data, we used multiple imputation for missing data using ordered logistic regression accounting for clustered nature of the data set by incorporating hospital characteristics into the multiple imputation model. We have presented our results using “men” as the reference category.
All statistical analyses were performed using the statistical software Stata, v 13.1 (StataCorp, College Station, Texas). All statistical tests were 2 tailed; a p value <0.05 was considered significant.
Results
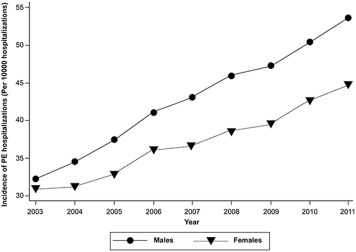
Over a 9-year period (2003 to 2011), a total of 276,484 discharges with a principal diagnosis of acute PE were analyzed. Based on the cluster design of the data set, the estimates derived from the analysis represent outcomes from 1.4 million US patients admitted with acute PE. Figure 1 demonstrates the annual incidence of acute PE during the last decade, stratified by gender. As seen in the Figure 1 , there has been a significant increase in the incidence of acute PE, which might be because of a significant improvement in the detection of acute PE. However, despite this improvement, there appears to be a progressively increasing disparity in acute PE incidence between men and women, suggesting a higher index of suspicion for acute PE among men compared with women. Table 1 demonstrates the baseline characteristics of the entire study population, stratified by gender. Because of the size of the data set, we observed small yet statistically significant differences in the mean age, SES, and the racial distribution across the gender categories. In addition, men were more likely to have private insurance as the primary payment source compared with the women, whereas women were more likely than men to have Medicare as the primary expected payer likely reflecting differences in age.
| Characteristics | Males | Females | P-value |
|---|---|---|---|
| N | 120272 | 146174 | |
| Mean (SE) age (years) | 61.1 (16.2) | 63.1 (18.6) | <0.001 |
| Race ∗ | <0.001 | ||
| White | 73595 (77.7%) | 85130 (74.2%) | |
| Black | 13632 (14.4%) | 19808 (17.3%) | |
| Others | 7524 (7.9%) | 9766 (8.5%) | |
| Primary expected payer | <0.001 | ||
| Medicare | 54804 (45.7%) | 78315 (53.7%) | |
| Medicaid | 7932 (6.6%) | 12612 (8.7%) | |
| Private Insurance | 45121 (37.6%) | 46208 (31.7%) | |
| Uninsured | 6637 (5.5%) | 4894 (3.4%) | |
| Other | 5496 (4.6%) | 3854 (2.6%) | |
| Socioeconomic status † | <0.001 | ||
| Quartile 1 | 28387 (24.2%) | 37611 (26.2%) | |
| Quartile 2 | 30174 (25.7%) | 37032 (25.8%) | |
| Quartile 3 | 30097 (25.6%) | 36269 (25.3%) | |
| Quartile 4 | 28731 (24.5%) | 32426 (22.6%) | |
| Hospital Characteristics | |||
| Region | <0.001 | ||
| Northeast | 20503 (17.1%) | 26133 (17.9%) | |
| Midwest | 30164 (25.1%) | 36890 (25.2%) | |
| South | 45569 (37.9%) | 56631 (38.7%) | |
| West | 24036 (20.0%) | 26520 (18.1%) | |
| Bed size | 0.1 | ||
| Small | 14963 (12.5%) | 18626 (12.8%) | |
| Medium | 29835 (24.9%) | 36126 (24.9%) | |
| Large | 74809 (62.6%) | 90636 (62.3%) | |
| Urban location | 103091 (86.2%) | 125020 (86.0%) | 0.1 |
| Teaching hospital | 49733 (41.6%) | 60741 (41.6%) | 0.9 |
| Private control | 42780 (35.8%) | 51203 (35.2%) | 0.003 |
| Co-morbidities | |||
| Diabetes | 22952 (19.2%) | 27990 (19.3%) | 0.6 |
| Hypertension | 59877 (50.0%) | 76445 (52.6%) | <0.001 |
| Smoking | 31906 (26.5%) | 24731 (16.9%) | <0.001 |
| Drug abuse | 2936 (2.5%) | 1751 (1.2%) | <0.001 |
| Alcohol abuse | 5154 (4.3%) | 1214 (0.8%) | <0.001 |
| Obesity | 14213 (11.9%) | 23855 (16.4%) | <0.001 |
| Solid tumor without metastasis | 7619 (6.4%) | 7266 (5.0%) | <0.001 |
| Metastatic cancer | 9357 (7.8%) | 11194 (7.7%) | 0.3 |
| Lymphoma | 2037 (1.7%) | 1688 (1.2%) | <0.001 |
| Paralysis | 2478 (2.1%) | 2492 (1.7%) | <0.001 |
| Anemia | 17824 (14.1%) | 29885 (19.4%) | <0.001 |
| Coagulopathy | 6796 (5.7%) | 6571 (4.5%) | <0.001 |
| Congestive heart failure | 14513 (12.1%) | 20373 (14.0%) | <0.001 |
| Peripheral vascular disease | 5754 (4.8%) | 5118 (3.5%) | <0.001 |
| Chronic pulmonary disease | 28680 (24.0%) | 36636 (24.5%) | 0.001 |
| Chronic renal failure | 9245 (7.7%) | 9414 (6.5%) | <0.001 |
| Mean (SD) number of Elixhauser co-morbidities | 2.3 (1.7) | 2.6 (1.7) | <0.001 |
∗ Data on race were available on 209455 discharges only.
† Socioeconomic status classification was based on median income of the residential zip code. Quartile 1: $1-$38999; Quartile 2: $39000-$47999; Quartile 3: $48000-63000; Quartile 4: $63000 or more.
The differences in the distribution of medical co-morbidities between the different SES quartiles are also listed in Table 1 . The prevalence of hypertension, obesity, and congestive heart failure was significantly higher in women compared with men. On the contrary, the prevalence of smoking, drug abuse, alcohol abuse, peripheral vascular disease, and chronic renal failure was significantly higher in men compared with women. The rate of pregnancy among patients included in this data set was relatively low at 0.1% of all included women.
Figure 2 demonstrates the incidence and adjusted odds ratio (OR) for the primary and secondary outcomes across the gender categories. In comparison with the men, there was a significantly higher incidence of inhospital death in women admitted with acute PE (adjusted OR 1.09, 95% confidence interval [CI] 1.03 to 1.15). In addition, there was a significantly higher incidence of residual disability requiring discharge to nursing facilities in women (17.0%) compared with men (11.1%; adjusted OR 1.30, 95% CI 1.27 to 1.34). With respect to complications during the hospitalization, women experienced a significantly higher need for transfusion of blood products (adjusted OR 1.38, 95% CI 1.33 to 1.44) and occurrence of shock (adjusted OR 1.10, 95% CI 1.01 to 1.18) during hospitalization. With respect to the resource utilization, there was a significantly lower utilization of IVC filters (adjusted OR 0.86, 95% CI 0.84 to 0.89) among women compared with men. Among patients in shock who were eligible for thrombolysis (age <75 years, no previous stroke, no bleeding on presentation, and not pregnant), there was no significant difference in utilization of thrombolysis in men and women (adjusted OR 1.19, 95% CI 0.93 to 1.53). The utilization of surgical embolectomy/endarterectomy was low in this cohort (women 0.12% and men 0.18%). Among patients presenting with shock, there was no significant difference in the utilization of surgical embolectomy/endarterectomy between men and women (adjusted OR 0.74, 95% CI 0.48 to 1.14). Despite higher incidence of adverse events and complications in women, the adjusted cost of hospitalization was significantly lower among women compared with men admitted for acute PE (adjusted mean difference $425, 95% CI $304 to $546).
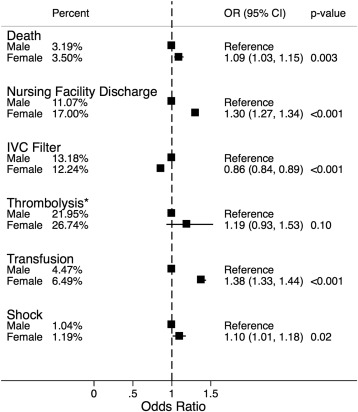
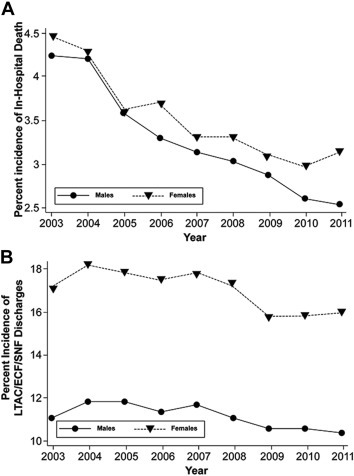
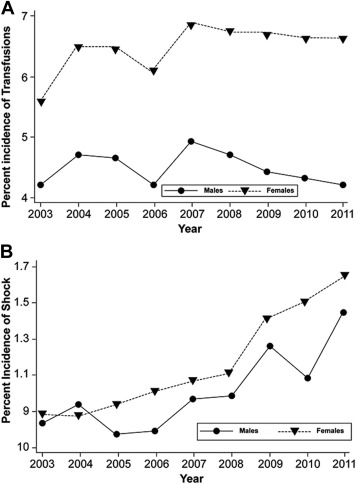
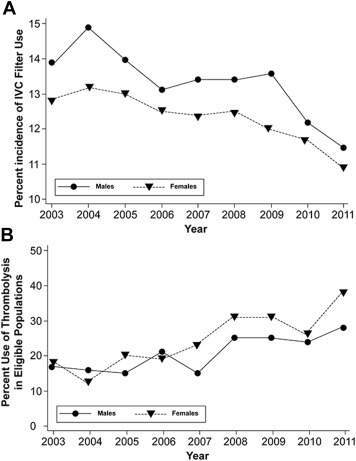
Figure 3 demonstrates the trend of inhospital mortality and residual disability requiring discharge to nursing facility over the study duration, stratified by the gender category. As evident in these figures, there is persistent difference in the incidence of both primary outcomes between women and men, with women having more adverse outcomes compared with men. Figure 4 demonstrates the trend of transfusion and shock between the 2 genders. There has been a large, persisting disparity in the need for transfusion between women and men, with women experiencing this complication considerably more frequently than men. Similarly, there continues to be a persistently higher incidence of shock among women admitted with acute PE compared with men. Figure 5 demonstrates the trend in the utilization of IVC filters and thrombolysis among the 2 study groups. There continues to be a persistently larger utilization of IVC filters among men admitted with acute PE compared with women. Although there was a similar utilization of thrombolysis between the 2 genders during earlier years (2003 to 2006), the utilization rates have increased among women compared with men during the recent years (2007 to 2011).
Subgroup analyses demonstrating the differential impact of race, age, and SES on the primary outcomes (inhospital death and need for discharge to nursing facility) have been listed in Tables 2 and 3 respectively. There was no significant differential impact of race (p interaction = 0.2) or age (p interaction = 0.8) on the incidence of inhospital mortality across the gender categories ( Table 2 ). However, there was a differential impact of SES on inhospital mortality rate in patients admitted with acute PE (p interaction <0.001). Although there was no significant difference in inhospital mortality between men and women in the lower SES quartiles, we observed significantly higher inhospital mortality among women compared with men in the higher SES quartiles. With respect to discharge to nursing facilities, there was a differential impact of gender in the adjusted odds of discharge to nursing facilities in each subgroup strata of age, race, and SES ( Table 3 ; p interaction <0.001 for all comparisons). Higher residual disability requiring discharge to nursing facilities occurred among whites (compared with nonwhites), older patients (compared with younger patients), and higher SES quartiles (compared with lower SES quartiles; p interaction <0.001 for all comparisons). The interplay of SES with outcomes after acute PE hospitalization in the NIS has been extensively explored in our work published elsewhere.
| Gender | N | Percent incidence | Odds ratio (95 % CI) | P-value |
|---|---|---|---|---|
| Whites | ||||
| Males | 92938 | 3.15% | Reference | |
| Females | 108976 | 3.41% | 1.07 (1.01 – 1.12) | 0.045 |
| Other Races | ||||
| Males | 27155 | 3.33% | Reference | |
| Females | 36969 | 3.76% | 1.15 (1.02 – 1.29) | 0.02 |
| Age≥75 | ||||
| Males | 28173 | 5.59% | Reference | |
| Females | 49040 | 5.26% | 1.06 (0.98 – 1.15) | 0.09 |
| Age<75 | ||||
| Males | 92009 | 2.46% | Reference | |
| Females | 97008 | 2.61% | 1.07 (0.99 – 1.15) | 0.09 |
| Socioeconomic status quartiles 1-2 ∗ | ||||
| Males | 58523 | 3.50% | Reference | |
| Females | 74586 | 3.60% | 1.01 (0.94 – 1.09) | 0.8 |
| Socioeconomic status quartiles 3-4 ∗ | ||||
| Males | 58784 | 2.88% | Reference | |
| Females | 68634 | 3.40% | 1.19 (1.09 – 1.28) | <0.001 |
Stay updated, free articles. Join our Telegram channel

Full access? Get Clinical Tree


