Several studies suggest gender differences in ventricular dimensions in athletes. Few studies have, however, made comparisons of data indexed for lean body mass (LBM) using allometry. Ninety Caucasian college athletes (mixed sports) who were matched for age, ethnicity, and sport total cardiovascular demands underwent dual-energy x-ray absorptiometry scan for quantification of LBM. Athletes underwent comprehensive assessment of left and right ventricular and atrial structure and function using 2-dimensional echocardiography and deformation imaging using the TomTec analysis system. The mean age of the study population was 18.9 ± 1.9 years. Female athletes (n = 45) had a greater fat free percentage (19.4 ± 3.7%) compared to male athletes (11.5 ± 3.7%). When scaled to body surface area, male had on average 19 ± 3% (p <0.001) greater left ventricular (LV) mass; in contrast, when scaled to LBM, there was no significant difference in indexed LV mass −1.4 ± 3.0% (p = 0.63). Similarly, when allometrically scaled to LBM, there was no significant gender-based difference in LV or left atrial volumes. Although female athletes had mildly higher LV ejection fraction and LV global longitudinal strain in absolute value, systolic strain rate and allometrically indexed stroke volume were not different between genders (1.5 ± 3.6% [p = 0.63] and 0.0 ± 3.7% [p = 0.93], respectively). There were no differences in any of the functional atrial indexes including strain or strain rate parameters. In conclusion, gender-related differences in ventricular dimensions or function (stroke volume) appear less marked, if not absent, when indexing using LBM allometrically.
Despite several years of investigation, the extent of gender differences in ventricular dimension and function in athletes remains a subject of debate. Part of the controversy may be related to that only few studies took into account body composition when scaling cardiac dimensions. In this study, we sought to determine, in college athletes, whether gender-related differences in ventricular dimensions persisted after adjustment for lean body mass (LBM). In second intention, we sought to compare gender-associated differences in functional parameters including ventricular and atrial strain analysis.
Methods
In 2008, 315 Caucasian college athletes were included in the preseason cardiac screening process at Stanford University using the AHA-12 point questionnaire, electrocardiogram, and a screening echocardiogram. Of these, 124 participants volunteered to undergo dual-energy x-ray absorptiometry (Norland XR 26 Mark II/HS, Norland Corporation, Wisconsin) for assessment of body composition. Of these subjects, we selected 90 subjects (45 men and 45women) and were matched according to age, ethnicity or race, and total cardiovascular demand. We excluded subjects who participated in sports in high dynamic and static component such as rowing, cycling, and triathlon as these were asymmetrically distributed among genders. The sport disciplines included the following: baseball, softball, La Crosse, short distance track running, wrestling, synchronous swimming, sailing, and fencing. Height and weight were measured using standard techniques. Body surface area (BSA) was calculated with Dubois formula. We present also data from 50 age-, gender-, and race-matched sedentary subjects for reference of the values in our laboratory. Body mass index (BMI) was calculated using a standard formula, weight divided height squared (kg/m 2 ). LBM was estimated using dual-energy x-ray absorptiometry scan.
All subjects underwent standard transthoracic 2-dimensional (2D) and color Doppler echocardiography using the Philips IE33 system (Philips Medical Imaging, Eindhoven, The Netherlands) and a 3.5-MHz transducer. The echocardiograms were blindly interpreted by an experienced reader (GG) according to the American Society of Echocardiography (ASE) guidelines. Left ventricular (LV) wall thickness and diameters were measured from the long-axis views using 2-dimensional (2D) measurements at the upper papillary level to avoid any chordal attachments; septal bands were also excluded from the septal wall measurements. LV mass was calculated in diastole by estimating LV mass on the basis of area–length (AL) formula. LV end-diastolic and end-systolic volumes were calculated using the 5/6 AL method as the 4-chamber (4C) end-diastolic volume often underestimates ventricular volumes; we used the 5/6 constant for the volume calculation to have the same constant as for the LV mass calculations. LV ejection fraction was obtained using the Simpson method in 4C view. SV was derived using the difference between end-diastolic and end-systolic volumes using the AL method. Right ventricular (RV) end-diastolic area was measured in the apical 4C view. Tricuspid annular plane systolic excursion was measured using a 2D manual method. Atrial volumes were calculated using the apical 4C views using the AL method.
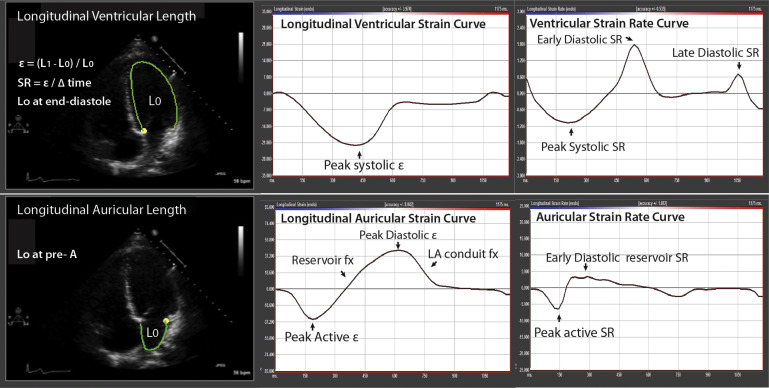
Analysis of LV, RV, and atrial (left and right) global longitudinal strain (GLS) was performed from apical 4C views, using vendor-independent software (TomTec Imaging System, Unterschleissheim, Germany) as shown in Figure 1 . For LVGLS, the 6 segments in the apical 4C view were averaged, whereas the 3 lateral segments were averaged for RVGLS measurements. For ventricular strain measurements, the beginning of the QRS was used as the point of reference. For the atrial GLS measurements, we used the beginning of the p wave as the reference point to allow good discrimination of the atrial systole component, conduit function, and reservoir function ( Figure 1 ).
Scaling of cardiac dimensions, volumetric and mass data to LBM was performed using allometric co-efficients. The choices of co-efficients were based on the previous reports especially the studies of George et al and Bella et al. We also verified that in our study population, the allometric co-efficients used were body size independent (BSI); to be considered BSI, no relation should be observed between the scaled parameter and the scaling parameter. For BSA or height, we used the allometric co-efficients recommend by the ASE guidelines.
Results are expressed as mean ± standard deviation for normally distributed continuous variables or as number of cases and percentage for categorical variables. To determine the best allometric co-efficient, we model the variable according to the following equation: Y = a X b , where b is the allometric coefficient. Comparison of groups was performed using the Student t test for continuous variables assuming equal or unequal variance as appropriate and the chi-square test or Fisher’s exact test, as appropriate for categorical variables. We also used multiple regression analysis to ensure that gender is not an independent determinant of indexed cardiac dimensions after accounting for other factors such as BMI, dynamic, and resistive component of sports according to Mitchell classification according to total cardiovascular demand as high moderate or moderate. Statistical analysis was performed using the PASW software (PASW 18.0 Inc, Chicago, Illinois). Interobserver variability for LV mass measurements were measured from 15 athletes, randomly selected (GG and YK). The absolute bias for the second reader was −6.4 g [−17.1, 4.4], and the relative bias was −4.5% [−11.6%, 2.6%] with only 1 patient having a difference of >10%. The intraclass coefficient was 0.95 with a co-efficient of variation of 3.7%.
Results
Forty-five men and 45 women were included in the study; 22% of women participated in high moderate sport activity compared to 20% of men with the remainder participating in low moderate to moderate activity. Compared to male athletes, female athletes had a smaller stature, lower body mass, and greater percentage body fat ( Table 1 ). Figure 2 shows the relation between body fat percentage and BMI in men and women; the parallel lines suggest that the 2 groups are comparable across a wide range of BMI. Compared to women, men had on average of 21% greater LBM/BSA ratio ( Figure 2 ).
| Characteristic | Female (n=45) | Male (n=45) | P-value |
|---|---|---|---|
| Age (years) | 18.6 ± 0.8 | 19.2 ± 1.3 | 0.01 |
| Height (cm) | 168 ± 6 | 182 ± 7 | <0.001 |
| Mass (kg) | 63 ± 9 | 83 ± 11 | <0.001 |
| Body mass index (kg/m 2 ) | 22.2 ± 2.6 | 24.9 ± 2.7 | <0.001 |
| Body surface area (m 2 ) | 1.71 ± 0.12 | 2.06 ± 0.17 | <0.001 |
| Percentage fat (%) | 19.5 ± 3.6 | 11.6 ± 3.8 | <0.001 |
| Lean body mass (kg) | 50 ± 5.6 | 72.5 ± 8.4 | <0.001 |
| Lean body mass to body surface area ratio (kg/m 2 ) | 29.2 ± 1.6 | 35.2 ± 2.0 | <0.001 |
| Sport Classification ∗ | |||
| High moderate (%) | 10 (22) | 9 (20) | 1.0 |
| Low moderate to moderate (%) | 35 (78) | 36 (80) | |
∗ Sports classification is based on Task Force classification based on total cardiovascular demands. Because of the diversity of sports we combined low moderate and moderate sport classification. combined low.
Because female and male athletes differ with regards to their body size and composition, determining the appropriate scaling parameters is paramount. Table 2 summarizes allometric exponents for LBM and whether scaling outcomes are BSI. Indexing to BSA did not yield BSI scaling metrics for LV mass, LV end-diastolic volume, or ventricular dimensions ( Table 1 , Figure 3 ). Indexing EDV to LBM was best accomplished to the 0.7 power ( Figure 3 ). When scaling to LBM using allometric co-efficients, no significant gender-associated difference was observed for LV mass, LV volume, or left atrial size. In contrast, indexing to BSA was associated with significant differences for all dimensions except LAV. These results are summarized in Tables 3 and 4 and Figure 4 . Using multiple regression analysis and adjusting for co-factors such as cardiovascular demand category of Mitchell et al according to percentage maximal oxygen consumption of exercise active and maximal voluntary contraction, gender did not emerge as an independent correlate of LV mass or dimensions. For the purpose of presenting comparative values in sedentary subjects (<1 hour of active exercise a week), we recruited age-, gender-, and race-matched 50 subjects. Compared to the sedentary subjects, athletes in our cohort had greater LV mass index (71 ± 11 vs 62 ± 11 g/m 2 , p <0.001), average wall thickness (7.3 ± 0.9 vs 6.7 ± 0.9, p = 0.001), LA volume index (28 ± 7 vs 25 ± 6, p = 0.02); there was, however, no significant difference in average relative wall thickness (0.28 ± 0.03 vs 0.27 ± 0.03, p = 0.19).
| Y=aX b | LV mass | LVEDV | LVID | Wall Thickness | RVEDA | LAV | SV |
|---|---|---|---|---|---|---|---|
| LBM | |||||||
| b | 0.92 ± 0.07 | 0.76 ± 0.07 | 0.26 ± 0.03 | 0.39 ± 0.04 | 0.63 ± 0.07 | 0.65 ± 0.12 | 0.62 ± 0.09 |
| r 2 | 0.61 | 0.55 | 0.47 | 0.50 | 0.50 | 0.23 | 0.37 |
| b selected | 1 | 0.70 | 0.33 | 0.33 | 0.66 | 0.70 | 0.70 |
| BSI | Yes | Yes | Yes | Yes | Yes | Yes | Yes |
| BSA | |||||||
| b selected | 1 | 1 | 1 | 1 | 1 | 1 | 1 |
| BSI | No | No | No | No | Yes | Yes | Yes |
| Height | |||||||
| b selected | 2.7 | 2.7 | 1 | 1 | 2.7 | 2.7 | 2.7 |
| BSI | Yes | Yes | Yes | Yes | No | Yes | No |
| Characteristics | Female (n=45) | Male (n=45) | P-value |
|---|---|---|---|
| Left ventricular dimensions | |||
| IVS (mm) | 6.1 ± 1.0 | 7.1 ±0.1 | < 0.001 |
| PW (mm) | 7.0 ± 1.1 | 8.2 ± 1.5 | < 0.001 |
| LVID (mm) | 47.1 ± 4.2 | 52.2 ± 4.1 | < 0.001 |
| r-average SAX (mm) | 6.8 ± 0.7 | 7.9 ± 1.5 | < 0.001 |
| r-average/LBM 0.33 | 1.9 ± 0.2 | 1.9 ± 0.2 | 0.24 |
| LVID average/ LBM 0.33 | 1.33± 0.08 | 1.33 ±0.08 | 0.99 |
| RWT | 0.28 ± 0.06 | 0.30 ± 0.05 | 0.31 |
| Left ventricular mass | |||
| Absolute (g) | 111 ± 20 | 159± 26 | < 0.001 |
| Indexed to BSA (g/m 2 ) | 65 ± 9 | 77±10 | < 0.001 |
| Indexed to LBM | 2.2 ± 0.3 | 2.2 ± 0.3 | 0.63 |
| LV end-diastolic volume | |||
| Absolute (ml) | 142 ± 23 | 193 ± 33 | < 0.001 |
| Indexed to BSA (ml/m 2 ) | 83 ± 12 | 94 ± 1 | < 0.001 |
| Indexed to LBM 0.7 | 9.2 ± 1.3 | 9.7± 1.5 | 0.17 |
| LV Mass-to-Volume ratio | 0.79 ± 0.09 | 0.83 ± 0.11 | 0.015 |
| LV Mass- to-Volume ratio (Allometric correction) | 0.24± 0.03 | 0.23±0.03 | 0.035 |
| Left atrial volume | |||
| Absolute (ml) | 47.5 ± 11.7 | 59.1 ± 16.8 | < 0.001 |
| Indexed to BSA | 27.7 ± 6.0 | 28.6 ± 7.5 | 0.54 |
| Indexed to LBM 0.7 | 3.1 ± 0.7 | 2.9 ± 0.8 | 0.42 |
| Characteristics | Female (n=45) | Male (n=45) | P-value |
|---|---|---|---|
| Right ventricular dimensions (4 chamber view) | |||
| Basal (cm) | 3.7 ± 0.5 | 4.3 ± 0.5 | < 0.001 |
| Mid (cm) | 2.9 ± 0.5 | 3.6 ± 0.5 | < 0.001 |
| Longitudinal (cm) | 8.2 ± 0.7 | 9.1 ± 0.9 | < 0.001 |
| Basal/LBM 0.33 | 1.0 ± 0.1 | 10.5 ± 1.3 | 0.43 |
| Mid/LBM 0.33 | 0.8 ± 0.1 | 0.9 ± 0.1 | 0.054 |
| Longitudinal/LBM 0.33 | 2.3 ± 0.2 | 2.2 ± 0.2 | 0.39 |
| Right ventricular area | |||
| Absolute (cm 2 ) | 22.8 ± 3.5 | 29.7 ± 3.9 | < 0.0001 |
| Indexed to BSA | 13.4 ± 1.8 | 14.5 ± 1.8 | < 0.01 |
| Indexed to LBM 0.66 | 1.7 ± 0.2 | 1.8 ± 0.2 | 0.55 |
| Right atrial volume | |||
| Absolute (ml) | 41.2 ± 10.9 | 56.1 ± 15.3 | < 0.0001 |
| Indexed to BSA | 24.1 ± 5.7 | 27.2 ± 6.7 | 0.02 |
| Indexed to LBM 0.7 | 2.7 ± 0.7 | 2.8 ± 0.7 | 0.37 |
Stay updated, free articles. Join our Telegram channel

Full access? Get Clinical Tree


