Although exercise capacity (EC) and autonomic responses to exercise predict clinical outcomes in various populations, they are not routinely applied in patients with coronary artery disease (CAD). We hypothesized that the composite index of EC and exercise heart rate responses would be a powerful determinant of short-term risk in CAD. Patients with angiographically documented stable CAD and treated with β blockers (n = 1,531) underwent exercise testing to allow the calculation of age- and gender-adjusted EC, maximal chronotropic response index (CRI), and 2-minute postexercise heart rate recovery (HRR, percentage of maximal heart rate). Cardiovascular deaths and hospitalization due to heart failure, registered during a 2-year follow-up (n = 39, 2.5%), were defined as the composite primary end point. An exercise test risk score was calculated as the sum of hazard ratios related to abnormal (lowest tertile) EC, CRI, and HRR. Abnormal EC, CRI, and HRR predicted the primary end point, involving 4.5-, 2.2-, and 6.2-fold risk, respectively, independently of each other. The patients with intermediate and high exercise test risk score had 11.1-fold (95% confidence interval 2.4 to 51.1, p = 0.002) and 25.4-fold (95% confidence interval 5.5 to 116.8, p <0.001) adjusted risk for the primary end point in comparison with the low-risk group, respectively. The addition of this risk score to the established risk model enhanced discrimination by integrated discrimination index and reclassification by categorical and continuous net reclassification index (p <0.001 for all). In conclusion, the composite index of EC and heart rate responses to exercise and recovery is a powerful predictor of short-term outcome in patients with stable CAD.
Poor exercise capacity (EC) and heart rate (HR) responses to exercise and recovery are important risk factors for future cardiac morbidities in various populations, including patients with coronary artery disease (CAD). Although these risk factors are modifiable and can be readily measured in a standard exercise stress test, they have not been routinely used in risk stratification in patients with CAD. Despite numerous positive findings, there have been doubts raised about the prognostic utility of HR responses to exercise in CAD because of the known effects of β-blocking medication on these measurements. The immediate HR recovery (HRR) is considered as a more robust measure of cardiac autonomic function in risk stratification whether the subject is receiving β-blocker therapy. Nevertheless, HRR is totally free from the effects of β blockers and chronotropic HR response to exercise, especially in CAD. In addition, both variables display a strong relation to EC, raising the question of whether EC and HR responses to exercise and recovery provide prognostic value independently of each other. We hypothesized that the combination of these simple exercise test variables would provide informative and supplemental value to the known risk factors and could be implemented in the assessment of short-term risk in patients with stable CAD.
Methods
The study population comprised 1,531 patients from the ARTEMIS (Innovation to Reduce Cardiovascular Complications of Diabetes at the Intersection, ClinicalTrials.gov identifier: NCT01426685 ) study database (n = 1,946) collected in the Division of Cardiology, Oulu University Hospital (Oulu, Finland). The ARTEMIS study aims to assess several traditional and novel cardiovascular risk markers as determinants of risk for sudden cardiac death during 2- and 5-year follow-up in patients with stable CAD and type 2 diabetes. The patients were recruited from a consecutive series of patients who had undergone coronary angiography 3 to 6 months earlier and had >3 months from possible previous acute coronary syndrome (ACS) before enrollment. Detailed exclusion criteria are described elsewhere in details. For the present substudy, the patients with contraindicated exercise test (n = 62) or incomplete follow-up data (n = 118), without β-blocker medication (n = 227), or those who had died because of noncardiovascular reasons (n = 5) were excluded. The study was performed according to the Declaration of Helsinki, and the local committee of research ethics of the Northern Ostrobothnia Hospital District approved the protocol; all the subjects gave written informed consent.
All laboratory measurements and exercise tests were done after a 12-hour overnight fast, and the patients were instructed to avoid smoking before the tests. Venous blood samples and urine samples were obtained for the analysis of renal function, blood lipids, plasma glucose, and glycated hemoglobin (HbA1c) levels. Those subjects without previously diagnosed type 2 diabetes underwent an oral glucose tolerance test to establish their glucose metabolism status. Blood pressure was measured in a supine position after a 10-min resting period. Two-dimensional, M-mode, and tissue Doppler echocardiography was performed using the same ultrasound machine for all the patients (Vivid 7; GE Healthcare, Wauwatosa, Wisconsin). Left ventricular mass index {LVMI = 0.8 · [1.04 · ({LVIDd + PWTd + SWTd} 3 – LVIDd 3 ) + 0.6 g] · body surface area −1 } and left ventricular ejection fraction (LVEF) were measured by the biplane method from 2- and 4-chamber views. Ratio of early transmitral flow velocity to early diastolic mitral annulus velocity (E/E′) was determined for evaluation of left ventricular diastolic function.
An incremental symptom-limited maximal exercise test on a bicycle ergometer started at 30 W, and the work rate was increased by 15 W in men and 10 W in women every minute until voluntary exhaustion. The patients moved to a supine position within 30 seconds after cessation of exercise without cooldown period. Supine resting, maximal (HR max ), peak exercise and recovery (1 and 2 minutes post-exercise) HRs were registered from a 15-lead ECG (GE Healthcare, CAM-14, Freiburg, Germany). EC was calculated as metabolic equivalents (METs) from the mean workload during the last minute of the test. Predicted EC (EC pred = 18 – [0.15 · age] for men, EC pred = 14.7 – [0.13 · age] for women) was used to obtain age- and sex-specific reference values for the calculation of relative EC (EC% = 100 · EC · EC pred −1 ). Predicted EC was based on large database of treadmill tests that result approximately in ∼1 MET larger EC than bicycle ergometer. In the calculation of relative EC, it was assumed that the effects of age and sex on EC are similar regardless of the mode of exercise. Absolute and age-adjusted (% of 220 – age) HR max and chronotropic response index (CRI = 100 · [HR max –resting HR] · [220 – age–resting HR] −1 ) were calculated. HRR was analyzed in absolute (peak exercise HR–post-exercise HR) and relative (HRR% = 100 · HRR · HR max −1 ) values.
The primary end point of this study was the composite of cardiovascular death and hospitalization for congestive heart failure (major adverse composite end point [MACE]) during the 2-year follow-up period. ACS, including acute myocardial infarction and unstable angina pectoris, was defined as the secondary end point. The follow-up information was collected from the patients by mailed enquiry, at the follow-up visit or from the patient records. The cause of death was verified from the death certificate or from the autopsy report.
The Mann–Whitney U test or chi-square test was used to assess statistical significance of differences between the groups. Spearman rho ( r s ) was calculated to test the relation between exercise test variables. The effect sizes of correlations were defined as follows: large if r s >0.5, medium if r s = 0.3 to 0.5, and small if r s = 0.1 to 0.3. The lowest or highest tertile of a continuous risk marker was defined as abnormal. The predictive power of the individual risk marker was assessed by univariate Cox regression followed by adjustment for established risk markers (age, gender, diabetes, smoking status, history of acute myocardial infarction, history of revascularization, body mass index, Canadian Cardiovascular Society class, LVEF, LVMI, and resting HR). Thereafter, the most relevant exercise test variables were entered in the stepwise Cox regression (backward Wald, p >0.10 for removal) to establish their predictive power independently of each other. The exercise test risk score (SCORE Exe ) was then calculated for each patient as the sum of the hazard ratios obtained with this model. The recently published Fitness Risk Score (FIT Score = HR max [%] + 12 · EC [METs] – 4 · age + 43 [if female]) for subjects who did not have established heart disease and had been otherwise referred for an exercise stress test was also used as a reference. The most relevant risk categories, based on SCORE Exe (7 categories) and FIT Score (categories with resolution of 50 points), were then identified by Cox regression and merging of the adjacent categories if no significant differences were observed in the risk.
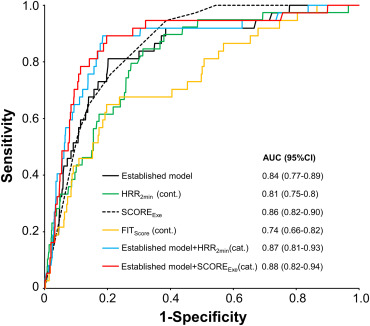
The discrimination abilities of the exercise test variables were assessed by the C-index and the integrated discrimination index (IDI). Categorical and continuous net reclassification index (NRI; risk levels 0 to <6, 6 to <20, and ≥20%) were also calculated. Predicted risk of the models and individual risk markers were entered into a receiver operating characteristic (ROC) analysis to reveal the discrimination capacity of each model. Kaplan–Meier analysis was used to illustrate survival curves of different groups of risk. The data were analyzed using SPSS software (IBM SPSS Statistics 21; IBM Corp., New York) and R Statistics (3.1.2, The R Foundation for Statistical Computing, Vienna, Austria). A p value <0.05 was considered as statistically significant.
Results
The characteristics of the patients are presented in Table 1 . During the follow-up of 2 years, there were 39 primary end points: 18 cardiovascular deaths and 21 hospitalizations due to congestive heart failure. As expected, exercise test variables correlated strongly with each other ( Table 2 ). However, although the effect sizes of correlations between absolute HRR variables and relative HR max and CRI were large , they proved to be only small to moderate after normalization of the HRR indexes according to HR max .
| Variable | No event (n=1382) | MACE (n=39) | ACS (n=110) |
|---|---|---|---|
| Age (years) | 67(8) | 68(9) | 66(9) |
| Men | 954(69%) | 33(85%) ∗ | 67(61%) |
| Body mass index (kg/m 2 ) | 28(5) | 31(5) ∗ † | 28(4) |
| Resting heart rate (bpm) | 61(10) | 67(13) ∗ † | 61(12) |
| Resting systolic blood pressure (mmHg) | 146(23) | 142(27) | 145(22) |
| Resting diastolic blood pressure (mmHg) | 77(11) | 77(10) | 78(11) |
| Smoker | 117(9%) | 7(18%) | 10(9%) |
| History of acute myocardial infarction | 655(48%) | 24(62%) | 58(53%) |
| History of revascularization | 1114(81%) | 34(87%) | 97(88%) |
| CCS class ≥ 2 | 559(41%) | 28(74%) † | 52(49%) |
| Syntax score ‡ | 4.0(6.8) | 4.3(6.1) | 6.2(9.9) |
| Impaired glucose tolerance | 233(17%) | 5(13%) | 9(8%) † |
| Impaired fasting glucose | 80(6%) | 0(0%) | 3(3%) |
| Diabetes mellitus | 578(42%) | 28(72%) ∗ † | 54(49%) |
| Duration of diabetes (months) | 99(103) | 128(112) | 116(112) |
| Medication | |||
| Beta-blockers | 1382(100%) | 39(100%) | 110(100%) |
| Angiotensin converting enzyme inhibitors or receptor blockers | 903(65%) | 27(69%) | 75(68%) |
| Calcium channel blockers | 334(24%) | 9(23%) | 30(27%) |
| Diuretics | 446(34%) | 24(62%) ∗ † | 37(34%) |
| Anticholesterol agents | 1280(93%) | 34(87%) | 102(93%) |
| Echogardiography | |||
| Left ventricular ejection fraction (%) | 65(9) | 58(15) ∗ † | 64(9) |
| Left ventricular mass index (g/m 2 ) | 107(27) | 122(42) ∗ † | 107(24) |
| Left ventricular diastolic function (E/E’) | 10.6(3.7) | 14.3(4.9) ∗ † | 10.7(3.0) |
| Laboratory analyses | |||
| Glycated hemoglobin (%) | 6.3(1.0) | 7.7(2.4) ∗ † | 6.5(1.0) |
| Total cholesterol (mmol/L) | 4.0(0.8) | 4.0(0.9) | 4.0(0.8) |
| (mg/dL) | 153(33) | 156(36) | 155(31) |
| High-density lipoprotein cholesterol (mmol/L) | 1.3(0.3) | 1.2(0.4) | 1.2(0.3) |
| (mg/dL) | 48(12) | 45(16) | 47(12) |
| Low-density lipoprotein cholesterol (mmol/L) | 2.3(0.7) | 2.2(0.7) | 2.4(0.8) |
| (mg/dL) | 88(28) | 87(28) | 91(30) |
| Triglycerides (mmol/L) | 1.4(0.7) | 1.9(1.6) † | 1.5(0.7) |
| (mg/dL) | 123(66) | 171(144) | 135(64) |
| Creatinine clearance (mL/min) | 93(35) | 91(38) | 95(31) |
| U-Albumin/Creatinine-ratio | 2.1(8.0) | 4.3(7.9) ∗ † | 3.6(11.1) |
| Exercise test | |||
| ST-depression > 0.1 mV or angina | 652(47%) | 17(44%) | 45(41%) |
| ST-depression > 0.2 mV or angina | 174(13%) | 5(13%) | 9(16%) |
| Exercise capacity (METs) | 6.1(1.7) | 4.3(1.2) ∗ † | 5.8(1.6) |
| 84(20%) | 58(18%) ∗ † | 80(18) | |
| Maximal heart rate (bpm) | 123(21) | 107(16) ∗ † | 120(23) |
| 81(13%) | 70(12%) ∗ † | 78(14) | |
| Heart rate reserve (bpm) | 63(21) | 40(13) ∗ † | 59(20) |
| Maximal chronotropic response index | 68(21%) | 48(19%) ∗ † | 67(35) |
| Heart rate recovery 1’ (bpm) | 25(12) | 12(10) ∗ † | 25(11) |
| 20(8%) | 11(9%) ∗ † | 20(8) | |
| Heart rate recovery 2’ (bpm) | 37(14) | 21(10) ∗ † | 36(13) |
| 30(9%) | 19(9%) ∗ † | 29(8) | |
| FIT Score § | -102(48) | -142(44) ∗ † | -99(49) |
† p <0.05 compared with No event.
| Absolute values | Relative values | |||||||||
|---|---|---|---|---|---|---|---|---|---|---|
| Exercise capacity | Maximal heart rate | Heart rate reserve | Heart rate recover 1’ | Heart rate recovery 2’ | Exercise capacity | Maximal heart rate | Chronotropic index | Heart rate recover 1’ | Heart rate recovery 2’ | |
| Absolute values | ||||||||||
| Exercise capacity | – | 0.59 | 0.69 | 0.54 | 0.60 | 0.62 | 0.52 | 0.58 | 0.39 | 0.45 |
| Maximal heart rate | – | – | 0.89 | 0.56 | 0.71 | 0.34 | 0.95 | 0.95 | 0.26 | 0.37 |
| Heart rate reserve | – | – | – | 0.66 | 0.81 | 0.46 | 0.83 | 0.91 | 0.42 | 0.55 |
| Heart rate recovery 1’ | – | – | – | – | 0.86 | 0.31 | 0.49 | 0.55 | 0.93 | 0.81 |
| Heart rate recovery 2’ | – | – | – | – | – | 0.35 | 0.64 | 0.70 | 0.71 | 0.90 |
| Relative values | ||||||||||
| Exercise capacity | 0.62 | 0.34 | 0.46 | 0.31 | 0.35 | – | 0.47 | 0.50 | 0.23 | 0.28 |
| Maximal heart rate | 0.52 | 0.95 | 0.83 | 0.49 | 0.64 | – | – | 0.98 | 0.20 | 0.31 |
| Chronotropic index | 0.58 | 0.95 | 0.91 | 0.55 | 0.70 | – | – | – | 0.27 | 0.39 |
| Heart rate recovery 1’ | 0.39 | 0.26 | 0.42 | 0.93 | 0.71 | – | – | – | – | 0.81 |
| Heart rate recovery 2’ | 0.45 | 0.37 | 0.55 | 0.81 | 0.90 | – | – | – | – | – |
The exercise test variables were significant predictors of MACE in the univariate and multivariate analysis ( Table 3 ). The lowest tertile of LVEF (<63%), which also was the best-defined cutoff, was associated with a 2.7-fold risk (95% confidence interval 1.5 to 5.0, p = 0.002) for MACE in the univariate analysis but did not predict the MACE after adjustments for the other established markers. None of the measured variables were associated with ACS.
| Variable | Univariate (n/N=39/1531) | Multivariate (n/N=37/1472) ∗ | |||
|---|---|---|---|---|---|
| % (n/N) | Hazard Ratio (95% CI) | p Value | Hazard Ratio (95% CI) | p Value | |
| Exercise capacity < 73 % | 6.2 (31/504) | 8.1 (3.7-17.7) | <0.001 | 4.0 (1.6-9.7) | 0.002 |
| Maximal heart rate < 74 % | 5.2 (26/496) | 4.3 (2.2-8.3) | <0.001 | 3.3 (1.6-6.9) | 0.002 |
| Maximal chronotropic response index < 57 % | 6.0 (30/500) | 7.1 (3.4-14.9) | <0.001 | 4.9 (2.1-11.3) | <0.001 |
| Heart rate recovery 1’ < 17 % | 6.5 (32/461) | 9.9 (4.4-22.5) | <0.001 | 6.0 (2.5-14.5) | <0.001 |
| Heart rate recovery 2’ < 26 % | 6.6 (33/502) | 11.6 (4.9-27.7) | <0.001 | 7.1 (2.8-18.0) | <0.001 |
| Multimarker Models | |||||
| Exercise capacity < 73 % | 4.0 (1.8-9.1) | 0.001 | 2.2 (0.9-5.7) | 0.10 | |
| Maximal chronotropic response index < 57 % | 2.3 (1.0-5.1) | 0.04 | 2.5 (1.0-5.9) | 0.04 | |
| Heart rate recovery 2’ < 26 % | 6.4 (2.6-15.8) | <0.001 | 4.9 (1.9-12.7) | 0.001 | |
| FIT Score † ≥ -100 | 1.0 (7/733) | Reference | Reference | ||
| -150 – -101 | 2.5 (13/529) | 2.6 (1.0-6.5) | 0.042 | 1.9 (0.7-5.2) | 0.206 |
| < -150 | 7.1 (19/269) | 7.6 (3.2-18.0) | <0.001 | 8.9 (2.8-28.1) | <0.001 |
| SCORE Exe < 6 | 0.2 (2/910) | Reference | Reference | ||
| 6 – 8 | 2.9 (11/378) | 13.4 (3.0-60.4) | 0.001 | 11.1 (2.4-51.1) | 0.002 |
| > 8 | 10.7 (26/243) | 51.5 (12.2-217.1) | <0.001 | 25.4 (5.5-116.8) | <0.001 |
∗ Adjusted for age, sex, diabetes, smoking, history of acute myocardial infarction, history of coronary intervention, body mass index, Canadian Cardiovascular Society grading of angina pectoris, left ventricular ejection fraction and mass index and resting heart rate, 59 patients excluded because of missing values.
In the Cox regression, CRI and relative HRR 2min were stronger determinants of the primary outcome than relative HR max and HRR 1min , respectively. Therefore, CRI, HRR 2min , and EC were included into the multimarker model and in the calculation of the risk score based on exercise test variables (SCORE Exe , Table 3 , Figure 1 ). In the Cox regression, 3 groups with significantly different risk for the primary end point were established (SCORE Exe <6, 6 to 8, and >8; Figure 2 ).
Stay updated, free articles. Join our Telegram channel

Full access? Get Clinical Tree


