Lymphocyte G protein–coupled receptor kinase 2 (GRK2) levels are increased in patients with chronic heart failure, and in this condition, they correlate with cardiac function. The aim of this study was to assess the prognostic role of GRK2 during acute cardiac dysfunction in humans. A study was designed to investigate the role of GRK2 levels in patients with acute coronary syndromes. Lymphocyte GRK2 levels were examined at admission and after 24 and 48 hours in 42 patients with acute coronary syndromes, 32 with ST-segment elevation myocardial infarction and 10 with unstable angina as a control group. Echocardiographic parameters of systolic and diastolic function and left ventricular remodeling were evaluated at admission and after 2 years. GRK2 levels increased during ST-segment elevation myocardial infarction and were associated with worse systolic and diastolic function. This association held at 2-year follow-up, when GRK2 was correlated with the ejection fraction and end-systolic volume, indicating a prognostic value for GRK2 levels during acute ST-segment elevation myocardial infarction. In conclusion, lymphocyte GRK2 levels increase during acute myocardial infarction and are associated with worse cardiac function. Taken together, these data indicate that GRK2 could be predictive of ventricular remodeling after myocardial infarction and could facilitate the tailoring of appropriate therapy for high-risk patients.
In recent years, the overall prevalence of heart failure (HF) has increased. Ischemic heart disease represents a leading cause of HF, and a plethora of studies have assessed the clinical evolution of ST-segment elevation myocardial infarction (STEMI) toward HF. Given the complexity of HF, interest has intensified in developing biologic markers to provide prognostic information about the disease. Indeed, several multivariate prognostic models have been developed to allow risk stratification. Because biomarkers may reflect various pathophysiologic processes, the use of a multimarker approach has been suggested to better identify patients who are at high risk, paving the way for more accurate treatment. A candidate biomarker in cardiovascular scenario is the G protein–coupled receptor kinase 2 (GRK2). This protein is involved in the desensitization and downregulation of G protein–coupled receptors, such as the β-adrenergic receptor, and is the most important G protein–coupled receptor kinase expressed in the heart. Increased cardiac GRK2 levels have been described in chronic HF and are associated with elevated sympathetic nervous system activity. We previously showed that increased cardiac GRK2 levels are associated with the impairment of cardiac function and that cardiac protein levels can be monitored using peripheral lymphocytes, thus circumventing the problem of tissue sampling. Nevertheless, the role of GRK2 as a marker for HF progression after acute myocardial infarction (MI) remains to be clarified. Thus, we designed a study to investigate GRK2 levels during the early phases of MI to define its relevance as a biomarker in the evolution toward HF.
Methods
We enrolled 32 patients consecutively admitted to the Coronary Care Unit of “Federico II” University with a diagnosis of acute (<24-hour) STEMI, defined by typical chest pain and persistent ST-segment elevation on electrocardiography. MI was confirmed by increased serum creatine kinase and assessed by cardiac ultrasound using the wall motion score index. We also recruited 10 age-matched patients with unstable angina pectoris as a control group. Angiography was performed in all patients according to standard indications. GRK2 levels were evaluated at admission and after 24 hours. All patients provided written informed consent. The study was approved by the ethics committee of “Federico II” University. We used a database reporting characteristics of each patient, including clinical, biochemical, and echocardiographic data and anthropomorphic parameters including age, gender, height, weight, body mass index, and body surface area (BSA). Patients were then reexamined at 2-year follow-up. Outcome variables analyzed during this examination were echocardiographic (systolic and diastolic function, MI size, and ventricular remodeling) and clinical (compliance with therapy, rehospitalization).
Patients’ lymphocytes were extracted from 20-ml blood samples, as previously described, by means of Ficoll purification using Histopaque-1077 (Sigma Aldrich, St. Louis, Missouri) at admission and after 24 and 48 hours. Samples thus obtained were frozen and stored at −80°C.
We performed immunodetection of lymphocyte levels of GRK2 and actin using detergent-solubilized cell extracts or cytosol fractions obtained by centrifugation, using polyclonal anti-GRK2 and antiactin antibodies (Santa Cruz Biotechnology, Santa Cruz, California), as previously described. The proteins were visualized using standard enhanced chemiluminescence (ECL Kit; Amersham Biosciences, Piscataway, New Jersey). Quantization was done by scanning the autoradiographic film and using dedicated software (ImageQuant; Molecular Dynamics, Piscataway, New Jersey). GRK2 levels indicate GRK2 expression corrected by actin expression and by lymphocyte levels for each patient (in corrected densitometry units). All laboratory work was performed in blinded fashion with respect to the identity of the samples.
Cardiac ultrasound evaluation was performed using Vivid 7 (GE Healthcare, Milwaukee, Wisconsin) by the same operator (L.S.) in the enrollment phase and at 2-year follow-up. Systolic functional parameters including the ejection fraction, shortening fraction, cardiac output, stroke volume, and cardiac index were analyzed. We also evaluated diastolic functional parameters including E-wave velocity (E), A-wave velocity (A), the E/A ratio, deceleration time, systolic and diastolic pulmonary venous flow, isovolumetric relaxation time, mitral annular motion velocity (E′) with Doppler tissue imaging, and the E/E′ ratio. Infarct size was assessed using the wall motion score index. Left ventricular remodeling was assessed by measuring end-systolic volume (ESV) and its long-term variation corrected by BSA (Δ%-ESV/BSA).
Statistical analysis was performed using SPSS version 18.0 (SPSS, Inc., Chicago, Illinois) and GraphPad Prism version 5.01 (GraphPad Software, San Diego, California). Data are expressed as mean ± SE. We performed chi-square tests to compare categorical variables and independent-samples Student’s t tests for continuous variables. All analyses were performed using a 2-sided model. A p value <0.05 was considered significant. Some continuous variables were transformed into categorical variables using the median values as cutoffs. In particular, we divided our population according to GRK2 level at admission into 2 groups using a cut-off value of 0.47 corrected densitometry units: elevated GRK2 and low GRK2. Moreover, we studied the effects of β-blocker therapy and revascularization on GRK2 levels. Indeed, we subdivided our STEMI population into patients treated with β blockers and those who did not receive β blockers because of contraindications. Similarly, to investigate whether time of revascularization could affect GRK2 levels, we subdivided our population into patients treated with early percutaneous transluminal coronary angioplasty, defined as angioplasty performed on the infarct-related vessel during the first 24 hours of an acute MI, and late percutaneous transluminal coronary angioplasty (patients who received medical therapy and were referred later [>24 hours] to coronary intervention). We also performed independent-samples Student’s t tests, Pearson’s correlations, and linear regressions between GRK2 levels at admission and echocardiographic variables considered at 2-year follow-up. In this case, we considered as continues variables not only the absolute value of ultrasound parameters but also their variations from admission values. Finally, we performed a linear regression analysis to characterize the most significant variables at admission associated with Δ%-ESV/BSA and a back-step multiple regression analysis to define the best predictive model of Δ%-ESV/BSA.
Results
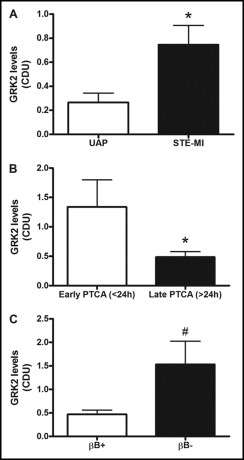
Clinical characteristics of patients are listed in Table 1 . As expected, patients with STEMI presented with impaired cardiac function, as indicated by the ultrasound parameters listed in Table 2 . GRK2 levels at admission were higher in patients with STEMI than in those with unstable angina pectoris ( Figure 1 ). Two pivotal determinants of GRK2 levels were treatment and time. In particular, early revascularization and β-blocker therapy clearly affected GRK2 levels. Indeed, GRK2 levels were higher in patients treated with early percutaneous transluminal coronary angioplasty than in those who received late percutaneous transluminal coronary angioplasty ( Figure 1 ). This finding could be related to the reperfusion injury, consistent with previous reports. Also, patients treated with β blockers had lower GRK2 levels compared with those who did not receive β blockers ( Figure 1 ).
| Variable | Patients With UAP (n = 10) | Patients With STEMI (n = 32) | High GRK2 (n = 15) | Low GRK2 (n = 17) | β-Blocker Therapy (n = 24) | No β-Blocker Therapy (n = 8) |
|---|---|---|---|---|---|---|
| Men/women | 7/3 | 30/2 | 13/2 | 17/0 | 22/2 | 8/0 |
| Age (years) | 60.9 ± 3.1 | 59.9 ± 1.9 | 57.7 ± 3.3 | 61.8 ± 2.3 | 58.4 ± 2.7 | 63.9 ± 3.2 |
| Weight (kg) | 75.7 ± 4.6 | 76.3 ± 1.7 | 75.1 ± 2.8 | 77.4 ± 2.2 | 77.1 ± 1.7 | 73.9 ± 4.9 |
| Height (cm) | 164.6 ± 1.6 | 162.3 ± 5.3 | 166.8 ± 1.4 | 158.3 ± 9.9 | 160.8 ± 7 | 166.9 ± 2.2 |
| Body mass index (kg/m 2 ) | 23.4 ± 3.3 | 27.17 ± 0.59 | 27.1 ± 0.9 | 27.3 ± 0.7 | 27.4 ± 0.6 | 26.5 ± 1.6 |
| BSA (m 2 ) | 1.8 ± 0.1 | 1.85 ± 0.1 | 1.8 ± 0.3 | 1.86 ± 0.4 | 1.8 ± 0.03 | 1.8 ± 0.1 |
| Systolic blood pressure (mm Hg) | 133.1 ± 6.0 | 119.8 ± 3.9 | 123.7 ± 4.8 | 116.5 ± 5.9 | 119.4 ± 4 | 121.2 ± 8.3 |
| Diastolic blood pressure (mm Hg) | 76.9 ± 4.0 | 72.9 ± 2.3 | 75 ± 2.8 | 71.2 ± 3.6 | 73.3 ± 2.7 | 71.9 ± 4.8 |
| Heart rate (beats/min) | 70.5 ± 3.8 | 72.6 ± 2.1 | 73.60 ± 2.8 | 71.65 ± 3.1 | 75.2 ± 2.2 | 64.6 ± 3.9 ⁎ |
| Variable | Patients With STEMI (n = 32) | High GRK2 (n = 15) | Low GRK2 (n = 17) | β-Blocker Therapy (n = 24) | No β-Blocker Therapy (n = 8) |
|---|---|---|---|---|---|
| Systolic parameters | |||||
| Ejection fraction (%) | 43.2 ± 1.4 | 43.9 ± 1.7 | 41.2 ± 2 | 41.4 ± 2.7 | 45.1 ± 1.9 |
| Shortening fraction (%) | 27.7 ± 1.1 | 29.1 ± 1.9 | 26.5 ± 1.2 | 26.8 ± 2.1 | 31.1 ± 2.2 |
| Stroke volume (ml) | 40.1 ± 1.7 | 36.5 ± 1.2 | 43.3 ± 2.9 ⁎ | 40.9 ± 2.2 | 37.6 ± 2.3 |
| Cardiac output (L/min) | 3.0 ± 0.1 | 2.8 ± 0.1 | 3.17 ± 0.1 ⁎ | 3.1 ± 0.2 | 2.6 ± 0.2 |
| Cardiac index (L/min/m 2 ) | 1.6 ± 0.1 | 1.5 ± 0.1 | 1.71 ± 0.1 | 1.7 ± 0.1 | 1.4 ± 0.1 |
| Wall motion score index | 1.9 ± 0.1 | 1.9 ± 0.1 | 1.91 ± 0.1 | 2.0 ± 0.1 | 1.8 ± 0.1 |
| Diastolic parameters | |||||
| E (cm/s) | 66.6 ± 3.4 | 68.7 ± 4.45 | 64.8 ± 5.1 | 64.62 ± 3.8 | 72.6 ± 7.5 |
| A (cm/s) | 68.1 ± 2.8 | 69.7 ± 4.13 | 66.6 ± 4.0 | 64.8 ± 2.9 | 77.9 ± 6.3 ⁎ |
| E/A ratio | 1.0 ± 0.1 | 1.0 ± 0.1 | 1.0 ± 0.1 | 1.1 ± 0.2 | 1.0 ± 0.1 |
| Deceleration time (ms) | 163.9 ± 9.7 | 143.5 ± 10.4 | 183 ± 15.1 ⁎ | 168.2 ± 11.7 | 149.1 ± 17 |
| Isovolumic relaxation time (ms) | 92.2 ± 2.8 | 91.7 ± 2.3 | 92.8 ± 5.9 | 90.3 ± 3.9 | 98.2 ± 5.5 |
| PVs (cm/s) | 47.5 ± 1.9 | 51.7 ± 2.2 | 44.3 ± 2.9 | 46.6 ± 2.3 | 50.4 ± 4.1 |
| PVd (cm/s) | 40.5 ± 2.4 | 38.4 ± 3.1 | 42.1 ± 3.7 | 39.9 ± 3.1 | 42.6 ± 3.8 |
| PVs/PVd ratio | 1.3 ± 0.1 | 1.4 ± 0.1 | 1.2 ± 0.1 | 1.3 ± 0.1 | 1.3 ± 0.2 |
| E′ (cm/s) | 5.7 ± 0.5 | 6.2 ± 0.8 | 5.3 ± 1.3 | 5.44 ± 0.6 | 6.6 ± 1.05 |
| E/E′ ratio | 13.9 ± 1.1 | 13.6 ± 2.01 | 14.2 ± 1.3 | 13.96 ± 1.1 | 13.7 ± 3.3 |
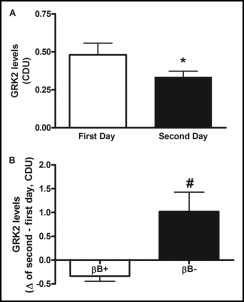
Time also affected GRK2 levels. In particular, during the second day of observation, GRK2 levels decreased ( Figure 2 ), and this trend was more evident in patients who received β blockers ( Figure 2 ). Furthermore, when we considered the β-blocker group (n = 24 [75%]), some patients had reductions of GRK2 levels (responders, 62.5% [n = 15]), whereas others did not have reduced GRK2 levels after treatment (nonresponders, 37.5% [n = 9]) during the 2 days of observation. Of interest, nonresponders had worse wall motion score indexes (2.27 ± 0.23 vs 1.81 ± 0.1) than responders.
Stay updated, free articles. Join our Telegram channel

Full access? Get Clinical Tree


