This study assessed right ventricular (RV) and RV outflow tract (RVOT) function and pressure in response to exercise in patients with an obstructed RV–pulmonary artery (PA) conduit using exercise stress echocardiography (ESE) to evaluate these parameters. RV-PA conduits inevitably develop stenosis and/or regurgitation over time. Assessment of conduit obstruction only at rest may not reveal the extent of physiologic perturbation related to RV pressure loading. Patients with a stenotic RV-PA conduit who were being considered for transcatheter pulmonary valve placement were approached prospectively. ESE was performed and ventricular images were obtained at rest and at peak exercise. Forty patients (median age 17 years) were enrolled. Most patients had tetralogy of Fallot (63%) and were in New York Heart Association class II (59%). Exercise stress echocardiographic images were adequate in 38 patients (95%). With exercise there was a significant increase in maximum instantaneous RVOT gradient from rest (59 vs 96 mm Hg, p <0.001); exercise-induced change in RVOT gradient correlated with global RV strain at rest (r = −0.3, p = 0.05). Compared to measurements at rest there were significant increases in median peak longitudinal strain of the left ventricular free wall, interventricular septum, and global left ventricular strain at peak exercise. There were no significant changes in median RV strain at peak exercise (RV free wall −14.3 [−26, −8] at rest vs −15.2 [−27, −3] at peak exercise, p = 0.87; global RV strain −13.9 [−32, −9] vs −15.1 [−23, −6], p = 0.11). In conclusion, using ESE it was possible to evaluate abnormal ventricular function and conduit dysfunction at peak exercise in patients with an obstructed RV-PA conduit.
Most studies of patients with right ventricular outflow tract (RVOT) dysfunction have focused on anatomic and physiologic cardiac parameters at rest. However, it is with exercise that most patients manifest symptoms. Response of the right ventricle to increased demands of exercise in the setting of RVOT obstruction has not been characterized, and potential clinical implications of how the right ventricle (RV) responds to increased work have not been well understood. The aims of this study were to gauge the feasibility of using exercise stress echocardiography (ESE) to assess RVOT pressure gradients and biventricular function in patients with congenital heart disease and an obstructed RV–pulmonary artery (PA) conduit and to assess relations between at-rest and peak exercise right heart hemodynamics and function. The ultimate goal of this line of investigation is to determine whether cardiac functional abnormalities elicited by exercise can help refine our understanding of when to intervene for RVOT conduit dysfunction.
Methods
This prospective cohort study was performed at our institution from March 2010 to September 2011 under a protocol that was approved by the Children’s Hospital committee for clinical investigations. For logistical reasons regarding ascertainment, patients who were being considered for placement of a transcatheter pulmonary valve (TPV) were approached. Patients with tetralogy of Fallot, truncus arteriosus, or d-loop transposition of great vessels palliated with an RV-PA conduit and a stenotic conduit (defined as mean Doppler gradient ≥20 mm Hg across the conduit on echocardiogram before TPV) with or without pulmonary regurgitation who were referred for ESE as part of the clinical evaluation before TPV were included. Patients with an obstructed conduit after a Ross procedure, patients with mean continuous wave flow Doppler gradient <20 mm Hg across the conduit or in whom ESE was not ordered or not possible because of poor imaging windows were excluded from the study.
Patients who were enrolled in the study had an exercise test (bicycle or treadmill) with metabolic evaluation during the 3 months preceding a planned catheterization procedure. ESE was performed to assess changes in RVOT gradients and RV and left ventricular (LV) function in response to exercise.
Maximal exercise testing was performed using a Bruce protocol on a treadmill or a ramp protocol on an electronically braked cycle ergometer. Equipment was calibrated to the manufacturer’s specification. A treadmill was preferred to a bicycle during stress echocardiographic protocols to facilitate quick and easy transition to the bed for peak exercise imaging.
Expired gases were measured at rest and during the exercise protocol. Oxygen consumption, carbon dioxide production, and minute ventilation were measured. Peak oxygen consumption was defined as the highest oxygen consumption achieved by the subject during the test. Ventilatory anaerobic threshold was measured by the V-slope method when it could be accurately determined. The ventilatory equivalent of carbon dioxide (ratio of minute ventilation to carbon dioxide production) was measured at anaerobic threshold, and respiratory exchange ratio (ratio of carbon dioxide production to oxygen consumption) was measured continuously. Values for oxygen consumption and oxygen were indexed to body weight and expressed as percent predicted values for healthy age- and gender-matched subjects as reported previously.
ESE was performed using commercially available ultrasound equipment (Philips iE33, Koninklijke Philips Electronics, Eindhoven, The Netherlands). The following imaging protocol was performed before exercise and again after the patient reached peak exercise. Exercise was terminated once maximal heart rate (determined by 220 minus age in years) was achieved or if a subject signaled to terminate. A patient was helped off the ergometer or treadmill and positioned supine on an imaging table, and imaging was performed again in the same sequence. All images (3 beats) were acquired at rest and completed within 3 minutes of peak exercise.
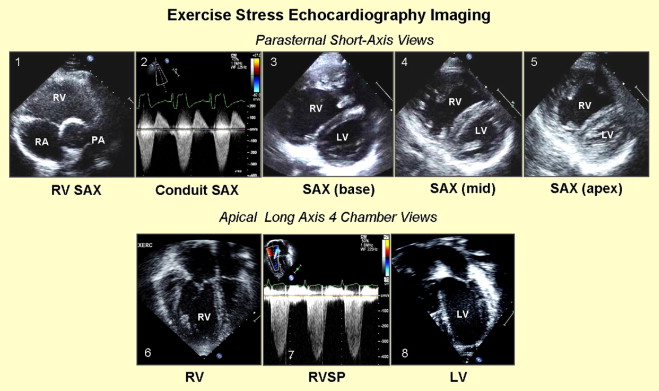
RV and LV parameters were examined using the following protocol ( Figure 1 ): (1) mean instantaneous systolic gradient and maximum instantaneous systolic gradient (MIG) across the RV-PA conduit were obtained using continuous-wave Doppler through the conduit in the parasternal short-axis view; (2) parasternal short-axis view at the base, midcavity, and apex were used to determine RV and LV functions ; (3) apical 4-chamber and short-axis views of the right ventricle at the base, midcavity, and apex were used to determine RV function; (4) apical 4-chamber view using the tricuspid regurgitation jet (if present) was used to determine RV systolic pressure; and (5) apical 4-chamber and short-axis views of the right ventricle at the base, midcavity, and apex were used to determine LV function.
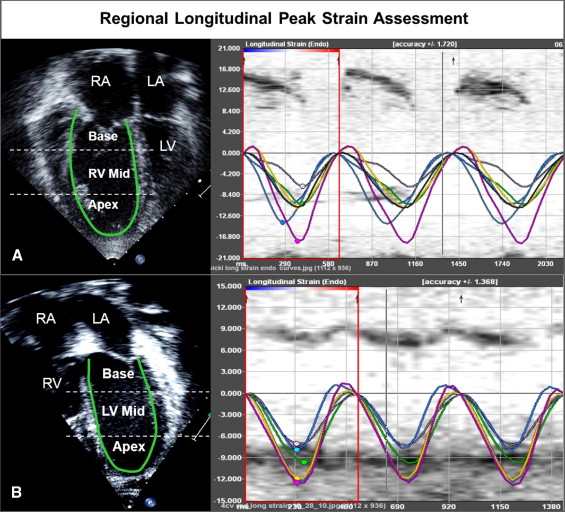
Off-line analysis at rest and peak exercise consisted of the following protocol ( Figure 2 ). (1) RV and LV functions were determined qualitatively and characterized as normal or mildly, moderately, or severely dysfunctional. Augmentation of RV function at peak exercise was qualitatively assessed and characterized as none, mildly augmented, or normally augmented in systolic function. (2) Using planimetry, RV end-diastolic area (square centimeters) was measured by tracing the RV endocardium at end-diastole from the apical 4-chamber view. RV function was also assessed as a RV fractional area change, that is, the change in area (using planimetry) from diastole to systole, at rest, and at peak exercise. Augmentation of RV systolic function at peak exercise was quantitatively assessed as the difference between RV fractional area change at peak exercise and at rest. (3) Longitudinal speckle-tracking imaging-derived strain peak (percentage) was obtained using a novel dedicated software off-line package (TomTec Imaging Systems, Inc., Unterschleissheim, Germany) by tracing images obtained from the apical 4-chamber view. Using the speckle-tracking algorithm, the package tracks 49 points (i.e., speckles) along the ventricular wall and interventricular septum. The ventricle is then divided into 6 segments, 3 along the free wall (basal, mid, and apical free wall) and 3 along the interventricular septum (basal, mid, and apical septum), and the average of the speckles in the respective segments are displayed as the peak longitudinal strain for that segment. We also calculated mean peak longitudinal strain for the RV and LV lateral free walls and interventricular septum as an average of the 3 segmental values (base, mid, and apex). The package also reported global longitudinal strain peak for the right and left ventricles. Because longitudinal fibers shorten during systole, longitudinal strain is reported as a negative value. Higher negative values reflect greater deformation. (4) Time to peak longitudinal strain (milliseconds) was calculated for 3 segments each on the LV free wall, interventricular septum, and RV free wall. Values for the 3 segments were averaged to calculate the average time to peak strain for each wall ( Figure 2 ). Intraventricular RV delay was calculated as the difference between RV free wall and interventricular septum times to peak strain, LV intraventricular delay was calculated as the difference between LV free wall and interventricular septum times to peak strain, and interventricular (between RV and LV) delay was calculated as the difference between RV free wall and LV free wall times to peak strain.
Cardiac catheterization was performed under general endotracheal anesthesia. RV systolic pressure and peak systolic gradient across the RVOT conduit were obtained at the beginning of the case, before any intervention, and compared using precatheterization noninvasive parameters.
In a subset of patients in whom cardiac magnetic resonance imaging was performed clinically, indexed RV end-diastolic volume (milliliters per square meter) and its z score, RV and LV ejection fractions, and pulmonary regurgitation fraction (percentage) were recorded and compared using precatheterization echocardiographic parameters.
Continuous variables were presented as mean ± SD or median (minimum, maximum). Comparison of continuous variables between groups was performed using independent-samples t test or Mann–Whitney U test and categorical variables were compared using chi-square or Fisher’s exact tests. Pearson or Spearman rank correlation coefficients were used to assess correlations between variables.
For assessment of interobserver variability in strain analysis, images from 13 randomly selected patients at rest and immediately after exercise were blinded and analyzed by 2 investigators (F.L. and B.H.). Bland–Altman analysis with mean percent error calculation was used to evaluate interobserver variability for mean longitudinal strain peak measurements of the right ventricle, interventricular septum, and LV walls separately and for global longitudinal strain peak measurements in the right and left ventricles at rest and immediately after exercise. Mean percent error was derived as the absolute difference between the 2 sets of observations (x 1 and x 2 ) divided by the absolute mean of the observations. Reproducibility of longitudinal strain peak measurements was also determined in another 13 randomly selected patients.
Results
Forty patients met the inclusion criteria and were enrolled in the study. All these patients were included in analyses of baseline echocardiographic or catheterization hemodynamic data. Demographic, diagnostic, and clinical data are presented in Table 1 . Three of these 40 patients (8%) had poor echocardiographic images and were excluded from strain analysis.
| Age at time of exercise study (years) | 17 (6, 56) |
| Diagnosis | |
| Tetralogy of Fallot | 25 (63%) |
| Truncus arteriosus | 9 (22%) |
| Transposition of great arteries | 6 (15%) |
| Number of cardiac surgeries in lifetime | 3 (1, 5) |
| Implanted diameter of right ventricle-to-pulmonary artery conduit (mm) | 21 (9, 27) |
| Type of right ventricle-to-pulmonary artery conduit | |
| Aortic homograft | 13 (33%) |
| Pulmonary homograft | 13 (33%) |
| Bioprosthetic valve | 9 (22%) |
| Synthetic tube graft, nonvalved | 2 (5%) |
| Unknown | 3 (7%) |
| New York Heart Association functional class (n = 34) | |
| I | 10 (29%) |
| II | 20 (59%) |
| III | 4 (12%) |
| IV | 0 |
In 35 patients (88%) adequate images were obtained at rest and peak exercise to perform off-line strain analysis of the RV and LV. The conduit gradient was obtained within a median of 30 seconds (10 seconds to 3 minutes) of coming off the treadmill/bicycle, and heart rate at the time of gradient measurement was a median of 80% (47% to 100%) of peak heart rate during ESE. The postexercise imaging protocol was completed within a median of 3 minutes (1.4, 4.5).
Mean percent errors between 2 observers for mean peak longitudinal strain measurements in the RV, interventricular septum, and LV were 23%, 22%, and 14%, respectively, and for the global RV and LV peak longitudinal strain measurements they were 23% and 14% at rest. At peak exercise mean percent errors were slightly higher for mean peak longitudinal strain measurements in the RV and LV walls (26% and 17%, respectively) and for global LV longitudinal peak strain (20%), similar for longitudinal peak strain in the interventricular septum (22%), and lower for global longitudinal strain in the RV (18%).
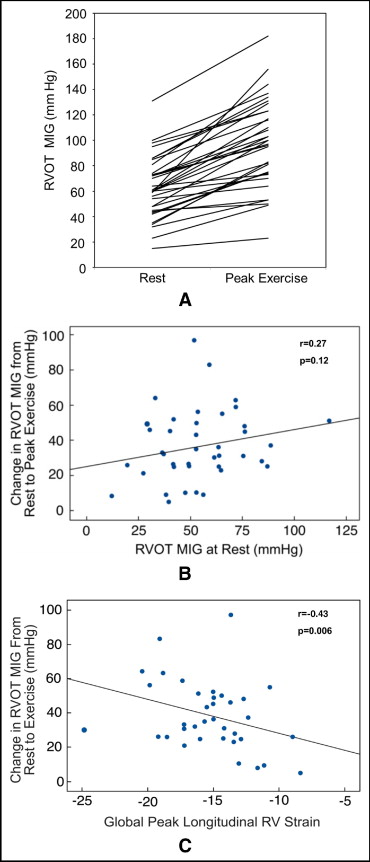
There were significant increases in the pressure gradient across the conduit ( Figure 3 ), RV systolic pressure, and RV pressure-to-systemic systolic blood pressure ratio at peak exercise compared to rest, with exercise-related increases observed in all patients ( Table 2 ). MIG at rest did not correlate with change in MIG at peak exercise (r = 0.27, p = 0.12; Figure 3 ). Overall, there were no significant changes in RV area (surrogate for volume) or fractional area change (surrogate for stroke volume). Qualitative augmentation of RV systolic function at peak exercise was normal in 8 patients (20%) and mild in 13 (33%), but there was no augmentation in 15 patients (37%). There was a positive correlation between magnitude of change in MIG across the RV-PA conduit and qualitative augmentation in RV systolic function at peak exercise (r = 0.37, p = 0.03). There were no associations between changes in RV fractional area change (quantitative augmentation) at peak exercise and qualitative augmentation of RV function or changes in RVOT gradient.
| At Rest | Peak Exercise | Change at Peak Exercise | p Value | |
|---|---|---|---|---|
| Right ventricular outflow tract maximum instantaneous gradient (mm Hg) | 59 (15, 131) | 96 (23, 182) | 31 (5, 97) | <0.001 |
| Mean right ventricular outflow tract gradient (mm Hg) | 33 (16, 73) | 48.5 (25, 115) | 16 (4, 55) | <0.001 |
| Right ventricular systolic pressure (mm Hg) | 65.5 (15, 133) | 105 (54, 169) | 33 (4, 112) | <0.001 |
| Right ventricular pressure: systolic blood pressure | 0.56 (0.1, 1) | 0.72 (0.4, 1.1) | 0.1 (−0.1, 0.8) | <0.001 |
| Right ventricular diastolic area (mm 2 ) | 26.3 (7.2, 41.5) | 24 (12.3, 60) | −1.6 (−12.9, 8.7) | 0.01 |
| Right ventricular systolic area (mm 2 ) | 17 (7.6, 40.7) | 14.3 (6.6, 47) | −0.16 (−7, 11.5) | 0.3 |
| Right ventricular fractional area change (mm 2 ) | 38.3 (5.9, 55.7) | 33.5 (13, 57.3) | −1.2 (−28.8, 17.8) | 0.3 |
| Peak longitudinal systolic strain (%) ⁎ | ||||
| Right ventricle | ||||
| Free wall | −14.3 (−26, −8.2) | −15.2 (−27.7, −3.2) | −0.2 (−7, 18) | 0.87 |
| Global | −13.9 (−25, −8.3) | −15.1 (−23, −6) | −0.9 (−5, 9.5) | 0.11 |
| Left ventricle | ||||
| Free wall | −18.2 (−32, −9.2) | −19.3 (−32, −11.7) | −1.0 (−10.6, 7.2) | 0.03 |
| Global | −15.7 (−24, −8.6) | −17.2 (−26.5, −10.2) | −1.3 (−9.2, 6) | 0.002 |
| Interventricular septum | −13.1 (−23.7, −7.5) | −16 (−24, −8.8) | −1.5 (−10, 6) | 0.01 |
| Ventricular dyssynchrony (ms) | ||||
| Right ventricular intraventricular delay | 44.6 (−40, 193) | 38 (−55, 138) | −9.2 (−111, 153) | 0.19 |
| Left ventricular intraventricular delay | 11 (−61, 111) | 5 (−86, 78) | −5.3 (−125, 91) | 0.53 |
| Interventricular delay | 28.3 (−96, 182) | 3.2 (−42, 148) | −17.3 (−108, 123) | 0.5 |
Stay updated, free articles. Join our Telegram channel

Full access? Get Clinical Tree


