In patients with acute coronary syndromes undergoing percutaneous coronary intervention (PCI), the diagnosis of periprocedural myocardial infarction is often problematic when the pre-PCI levels of cardiac troponin T (TnT) are elevated. Thus, we examined different TnT criteria for periprocedural myocardial infarction when the pre-PCI TnT levels were elevated and also the associations between the post-PCI cardiac marker levels and outcomes. We established the relation between the post-PCI creatine kinase-MB (CKMB) and TnT levels in 582 patients (315 with acute coronary syndromes and 272 with stable coronary heart disease). A post-PCI increase in the CKMB levels to 14.7 μg/L (3× the upper reference limit [URL] in men) corresponded to a TnT of 0.23 μg/L. In the 85 patients with acute coronary syndromes and normal CKMB, but elevated post peak TnT levels before PCI (performed at a median of 5 days, interquartile range 3 to 7), the post-PCI cardiac marker increases were as follows: 21 (24.7%) with a ≥20% increase in TnT, 10 (11.8%) with an CKMB level >3× URL, and 12 (14%) with an absolute TnT increase of >0.09 μg/L (p <0.005 for both). In the patients with stable coronary heart disease and post-PCI cardiac markers >3× URL compared to those without markers elevations, the rate of freedom from death or nonfatal myocardial infarction was 88% for those with TnT elevations versus 99% (p <0.001, log-rank) and 84% for those with CKMB elevations versus 98% (p <0.001, log-rank). Of the patients with acute coronary syndromes, the post-PCI marker levels did not influence the outcomes. In conclusion, in patients with acute coronary syndromes and elevated TnT levels undergoing PCI several days later, ≥20% increases in TnT were more common than absolute increments in the TnT or CKMB levels of >3× URL. Also, periprocedural cardiac marker elevations in patients with acute coronary syndromes did not have prognostic significance.
The importance of the patterns of elevation in the blood levels of markers of myonecrosis has been emphasized in the 2000 and 2007 universal definitions of myocardial infarction (MI). When the troponin levels are elevated before percutaneous coronary intervention (PCI), to meet the recurrent MI criteria, 2 cardiac marker levels are required, preferably troponin, the first immediate and the second 6 hours later. Also, an increase of ≥20% in troponin levels greater than stabilized or decreasing elevated pre-PCI levels is needed. Changes on the electrocardiograms or imaging findings, together with biomarkers, contribute to the recurrent MI criteria. Because few data are available to support this troponin-based definition of reinfarction, we examined the cardiac marker levels in such patients. Initially, we examined the relations between the levels of creatine kinase-MB (CKMB) and troponin T (TnT) in patients with acute coronary syndromes and stable coronary heart disease to develop an algorithm for the absolute increases in TnT levels greater than the upper reference limit (URL). We used this algorithm in patients with acute coronary syndromes with elevated pre-PCI TnT levels, but normal CKMB levels, to compare the percentage and absolute increases in periprocedural cardiac marker levels. We also examined the influence of TnT and CKMB elevations after PCI on the late outcomes in patients with acute coronary syndromes compared to those with stable coronary heart disease.
Methods
All patients undergoing PCI have had clinical, angiographic, and procedural data recorded prospectively in the cardiology database at the Liverpool Hospital cardiac catheterization laboratory (Sydney, Australia). These data included procedural indications, patient demographics, medications, angiographic and lesion characteristics, and stent type, such as drug-eluting stents. The procedural indications were categorized as acute coronary syndromes with or without ST-segment elevation. Those with angina (class II-III) and other stable manifestations of coronary heart disease were classified as having “stable coronary heart disease.” During the study period, 587 PCIs were performed on 582 unique patients (5 underwent staged PCI) who had sufficient cardiac marker data for inclusion ( Figure 1 ). The Liverpool Hospital ethics committee approved the present study as a part of a quality assurance project (QA2008/034).

Aspirin (unless contraindicated), clopidogrel (300 or 600 mg), and a bolus of unfractionated heparin were given at the start of PCI. The use of intravenous glycoprotein IIb/IIIa inhibitors was at the interventional cardiologist’s discretion. Stent deployment and rotational atherectomy were performed according to standard practice. Angiographically successful procedures were defined as a final post-PCI minimum stenosis diameter reduction to <20% after stenting or to <50% after balloon angioplasty in the presence of grade 3 Thrombolysis In Myocardial Infarction flow.
The clinical follow-up data were obtained by trained research staff (nurses or doctors) 8 to 12 months after PCI. The patients, their relatives, or local physicians were interviewed by telephone and asked about recurrent cardiac symptoms requiring hospitalization, in particular, coronary revascularization or MI. Data regarding death were obtained from the family members, physicians, medical records, and death registry. Other clinical outcomes such as repeated procedures for stent thrombosis and restenosis were also documented in our database.
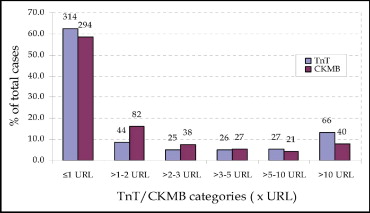
Venous blood samples for assays of TnT and CKMB (mass) levels (Roche, Mannheim, Germany) were obtained before and after PCI. The post-PCI samples were obtained at a median of 18 hours (interquartile range 16 to 20). Additional marker levels were obtained when an ischemic event was suspected or according to physician discretion. Only patients with TnT and CKMB levels measured concurrently and within 24 hours after PCI were included in the analysis of the relation between the TnT and CKMB levels. A cohort of 85 patients with acute coronary syndromes underwent delayed PCI because of scheduling ( Figure 1 ). These patients had had normal CKMB and elevated TnT levels that were either stable or decreasing (after peak). The URL for TnT using the third- and fourth-generation assays (used before and after January 15, 2006, respectively) was 0.03 μg/L, defined as the level at ≤10% of the coefficient of variation. Gender-specific CKMB (mass) levels were used in all analyses. The URL was 4.9 μg/L for men and 2.9 μg/L for women.
Statistical analysis was performed using the Statistical Package for Social Sciences, version 14.0 (SPSS, Chicago, Illinois). The categorical variables are expressed as numbers and percentages per group, continuous variables as the mean ± SD for normally distributed variables, and skewed variables as the median and interquartile range. For group comparisons, Pearson’s chi-square test or Fisher’s exact test was used for unpaired categorical variables. McNemar’s test was used for paired categorical variables. The Student t test or Mann-Whitney U test (for skewed variables) was used for continuous variables. The relation between the post-PCI TnT and post-PCI CKMB were modeled using linear regression analysis with logarithmic transformations of TnT and CKMB levels, accounting for the pre-PCI estimated glomerular filtration rate <30 ml/min/1.73 m 2 , using the Modification of Diet in Renal Disease formula (estimated glomerular filtration rate = 186.3 × serum creatinine 1.154 × age −0.203 × 0.742, if female). Forward stepwise logistic regression analysis was performed to determine the predictors of TnT elevation after PCI and late events (death or nonfatal MI). Age (≥70 years), American College of Cardiology/American Heart Association class B2 and C lesions, lesions in saphenous vein grafts, diabetes mellitus, duration of PCI (as a dichotomous variable at a median PCI duration of 59 minutes), maximum balloon pressure, and duration were included in the model for prediction of the post-PCI TnT elevations. The clinical indications for PCI (acute coronary syndromes and stable coronary heart disease), age (≥70 years), diabetes mellitus, PCI of culprit lesions in saphenous vein grafts, PCI of patients with culprit lesions at coronary bifurcations, post-PCI CKMB elevations (>3× URL), post-PCI TnT elevations (>3× URL), and patients with a pre-PCI estimated glomerular filtration rate <30 ml/min/1.73 m 2 were included in prediction models for late death or nonfatal MI. Comparisons of the frequencies of death or nonfatal MI between the groups were performed using Kaplan-Meier analyses and log-rank testing. p Values <0.05 were considered statistically significant; the 5 patients with staged procedures were included once.
Results
Of the patients who had undergone successful PCI during the study period, October 2003 to October 2006, 587 PCIs were performed on 582 patients (5 underwent staged procedures), who met the present study’s inclusion criteria ( Figure 1 ). Of these 587 PCIs, 315 were performed in patients with acute coronary syndromes and 272 in patients with stable coronary heart disease. The demographic and angiographic characteristics of the patients according to the clinical indication for PCI and the pre-PCI TnT levels are listed in Tables 1 and 2 . Periprocedural glycoprotein IIb/IIIa inhibitors were used in 20% (12.9% tirofiban and 7.5% abciximab). In 98% of PCIs, ≥1 stent was deployed (35% had ≥1 drug-eluting stent); 3 patients underwent rotational atherectomy. The rate of peri-PCI MI for all 587 PCI procedures, as determined by elevated TnT and CKMB levels (both >3× URL), as recommended by the 2007 universal definition of MI, was 23.9% and 16.7%, respectively. The independent predictors of TnT elevation after PCI on multivariate regression analysis were age (≥70 years; odds ratio [OR] 1.68, 95% confidence interval [CI] 1.12 to 2.52, p = 0.011), duration of PCI (as a dichotomous variable at 59 minutes; OR 1.59, 95% CI 1.07 to 2.35, p = 0.022), and American College of Cardiology/American Heart Association class B2 and C lesions (OR 1.54, 95% CI 1.00 to 2.37, p = 0.049).
| Variable | Pre-PCI TnT Level | Clinical Indication for PCI | ||||
|---|---|---|---|---|---|---|
| TnT <0.03 μg/L (stable CHD and ACS; n = 502) | TnT >0.03 μg/L (ACS; n = 85) ⁎ | p Value | ACS (n = 315) | Stable CHD (n = 272) | p Value | |
| Mean age ± SD (years) | 64.3 ± 10.8 | 62 ± 12.7 | 0.11 | 63 ± 11.6 | 65 ± 10.3 | 0.028 |
| Men | 378 (75%) | 65 (77%) | 0.816 | 245 (78%) | 198 (73%) | 0.162 |
| Diabetes mellitus | 101 (20%) | 13 (15%) | 0.298 | 63 (20%) | 51 (19%) | 0.703 |
| Smoker | 64 (13%) | 25 (29%) | <0.0001 | 72 (23%) | 17 (6%) | <0.0001 |
| Hypertension | 278 (55%) | 45 (53%) | 0.676 | 179 (57%) | 144 (53%) | 0.346 |
| Hyperlipidemia † | 340 (68%) | 55 (65%) | 0.583 | 224 (71%) | 171 (63%) | 0.034 |
| Previous percutaneous coronary intervention | 44 (9%) | 1 (1%) | 0.015 | 16 (5%) | 29 (11%) | 0.011 |
| Previous coronary bypass | 28 (6%) | 4 (5%) | 0.495 | 15 (5%) | 17 (6%) | 0.428 |
| Estimated glomerular filtration rate (ml/min/1.73 m 2 ) | ||||||
| <60 | 103 (21%) | 21 (25%) | 0.392 | 62 (20%) | 62 (23%) | 0.33 |
| <30 | 8 (2%) | 4 (5%) | 0.082 | 9 (3%) | 3 (1%) | 0.137 |
⁎ CKMB returned to normal before PCI (median interval from admission to PCI 5 days, interquartile range 3–7).
† Hyperlipidemia defined as previous diagnosis of hypercholesterolemia, including treatment with lipid-lowering agents or fasting low-density lipoprotein cholesterol of ≥130 mg/dl or total cholesterol of ≥200 mg/dl.
| Variable | Pre-PCI TnT Level | Clinical Indication for PCI | ||||
|---|---|---|---|---|---|---|
| TnT <0.03 μg/L (stable CHD and ACS; n = 502) | TnT >0.03 μg/L (ACS; n = 85) | p Value | ACS (n = 315) | Stable CHD (n = 272) | p Value | |
| Percutaneous coronary intervention duration (minutes) | 0.01 | 0.087 | ||||
| Median | 59 | 69 | 64 | 55 | ||
| Interquartile range | 43−80 | 52−88 | 45−83 | 42−80 | ||
| Site of culprit coronary narrowing | ||||||
| Left anterior descending artery | 193 (38%) | 27 (32%) | 0.239 | 119 (38%) | 101 (37%) | 0.872 |
| Right coronary artery | 131 (26%) | 26 (31%) | 0.387 | 90 (29%) | 67 (25%) | 0.282 |
| Left circumflex coronary artery | 83 (17%) | 23 (27%) | 0.020 | 59 (19%) | 47 (17%) | 0.649 |
| Lesion classification (ACC/AHA) | 0.457 ⁎ | 0.028 ⁎ | ||||
| B2 | 179 (36%) | 38 (45%) | 0.113 | 126 (40%) | 91 (34%) | 0.109 |
| C | 152 (30%) | 22 (26%) | 0.406 | 98 (31%) | 76 (28%) | 0.418 |
| Culprit lesion at bifurcation | 133 (27%) | 23 (27%) | 0.921 | 95 (30%) | 61 (23%) | 0.037 |
| Culprit lesion length (mm) | 0.633 | 0.351 | ||||
| Median | 16 | 16 | 16 | 16 | ||
| Interquartile range | 12−24 | 15−24 | 16−25 | 12−23 | ||
| Total stented length (mm) | 0.567 | 0.934 | ||||
| Median | 20 | 20 | 20 | 20 | ||
| Interquartile range | 15−28 | 16−25 | 16−28 | 16−26 | ||
| Stent diameter (mm) | 0.485 | 0.003 | ||||
| Median | 3 | 3 | 3 | 2.75 | ||
| Interquartile range | 2.5−3 | 2.5−3 | 2.5−3 | 2.5−3 | ||
| Stent type | ||||||
| Drug-eluting stent | 181 (36%) | 27 (32%) | 0.444 | 113 (36%) | 95 (35%) | 0.811 |
| Bare metal stent | 309 (62%) | 58 (68%) | 0.239 | 200 (64%) | 167 (61%) | 0.662 |
| Maximum inflation pressure (atm) | 0.952 | 0.027 | ||||
| Median | 18 | 16 | 18 | 16 | ||
| Interquartile range | 16−20 | 16−20 | 16−20 | 15−18 | ||
| Glycoprotein IIb/IIIa inhibitor | ||||||
| Tirofiban | 65 (13%) | 11 (13%) | 0.999 | 56 (18%) | 20 (7%) | <0.001 |
| Abciximab | 34 (7%) | 10 (12%) | 0.106 | 35 (11%) | 9 (3%) | <0.001 |
⁎ p Value for combined American College of Cardiology/American Heart Association (ACC/AHA) class B2 and C lesions.
Of the 502 PCIs performed in patients with normal pre-PCI TnT levels, elevated TnT levels after PCI to greater than the URL occurred in 188 patients (38%; 35% of patients with stable coronary heart disease and 41% of patients with acute coronary syndromes). The median level was 0.15 μg/L (interquartile range 0.07 to 0.65). Elevated CKMB levels after PCI to greater than the URL occurred in 208 patients (41%; 38% with stable coronary heart disease and 46% with acute coronary syndromes). The median CKMB level was 13 μg/L (interquartile range 7 to 38). According to the increased CKMB levels to >3× URL, periprocedural MI occurred in 88 patients (18%). In contrast, TnT levels >3× URL (>0.09 μg/L) indicated that periprocedural MI had occurred in 119 patients (24%; p <0.0001). The relations between the post-PCI TnT and CKMB levels for patients with normal baseline pre-PCI TnT levels are shown in Figure 2 . Of those with elevated post-PCI TnT levels, 13% had normal CKMB levels. In patients without pre-PCI elevated TnT, significantly greater elevations in the post-PCI TnT levels occurred in the patients with acute coronary syndromes compared to those with stable coronary heart disease (median 0.27 μg/L, interquartile range 0.08 to 3.97 vs median 0.12 μg/L, interquartile range 0.06 to 0.28, respectively; p = 0.002).
A high correlation (r = 0.92, 95% CI 0.89 to 0.94, p <0.001) was seen between the elevated levels of TnT and CKMB after PCI when the pre-PCI TnT levels were normal ( Figure 3 ). The regression equation describing this association is TnT (μg/L) = e [(1.202 [In CKMB μg/L]) − 4.693 + 0.264 (if estimated glomerular filtration rate <30)] , e = 2.718. Using this equation and assuming an estimated glomerular filtration rate >30 ml/min/1.73 m 2 , CKMB elevations to 3× URL (14.7 μg/L for men and to 8.7 μg/L for women) corresponded to TnT levels of 0.23 μg/L and 0.12 μg/L respectively. The prediction of CKMB levels from the measured TnT levels can be obtained from the equation: CKMB level (μg/L) = e [3.737 + (0.701 [In TnT μg/L]) − 0.261 (if estimated glomerular filtration rate <30)] , e = 2.718. No significant correlation was seen when either of these biomarker level elevations after PCI were <2× URL (r <0.11, p >0.40 for both).


