The images for Figures 1, 2, and 4 were not correctly depicted. The correct images are shown on the following 2 pages.
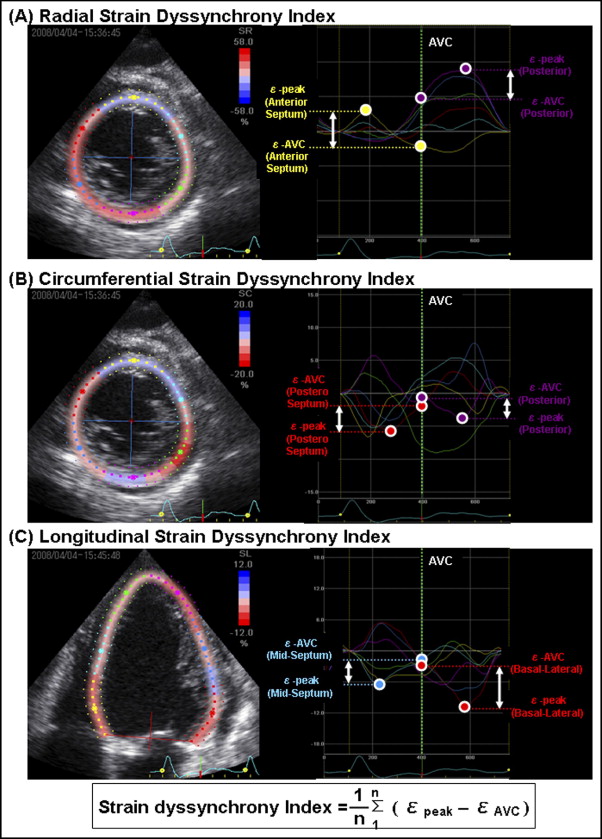
An example of radial (A) , circumferential (B) , and longitudinal (C) SDIs. The SDI was calculated as the wasted energy per segment due to dyssynchrony, which was determined using the average difference between ϵ-peak and ϵ AVC from 6 segments for radial and circumferential SDIs and 18 segments for longitudinal SDI.
Stay updated, free articles. Join our Telegram channel

Full access? Get Clinical Tree


