Energy Utilization (Work and Heat)
Muscle research in the early 19th century centered on the then new field of thermodynamics, notably the first law, which states that the sum of the energies in an isolated system is constant. This means that when a muscle contracts, the chemical energy consumed by the contractile machinery is liberated as work and heat. Muscle work had been quantified since the 17th century, and the first effort to measure heat production by isolated muscle was made by the German physicist and physiologist Hermann von Helmholtz in 1848. However, it was not until the 1920s that A. V. Hill was able to measure muscle heat with sufficient accuracy to obtain insights into the chemistry of muscle contraction. An early effort to measure heat production by cardiac muscle was made in 1925 by L. N. Katz, to whom this text is dedicated, but his effort proved fruitless because the heart generated too little heat to be recorded by the instruments of that time. Subsequent research using better instrumentation has demonstrated important differences between the energetics of cardiac and skeletal muscle, but Hill’s studies continue to provide valuable insights regarding the contractile machinery of the heart.
A Few Terms
Isometric and Isotonic Contractions
Physiologists generally study muscles when they contract at constant length (isometric contraction) or at constant load (isotonic contraction). In an isometric contraction, the ends of the muscle are fixed so that the muscle cannot shorten; even though developed tension is maximal under these conditions, work (the product of force × distance) is zero because muscle length does not change. In an isotonic contraction, the muscle is allowed to shorten while bearing a constant load. If load is zero, the muscle shortens to its maximal extent, but no work is done because no force is developed. Work is maximal when the muscle shortens against an intermediate load. Cardiac myocyte contraction in the beating heart is neither isometric nor isotonic because wall stress first increases and then decreases as the cavities empty (see Chapter 11).
Preload and Afterload
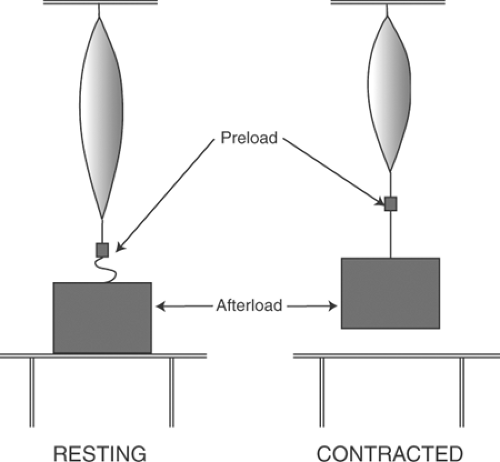
The difference between a preload and an afterload depends on the time that the muscle first interacts with the load. A preload stretches a relaxed skeletal muscle before contraction begins, whereas the muscle does not encounter an afterload until after contraction has begun. In a linear muscle (Fig. 3-1), a weight supported by the resting muscle is a preload, while a weight that rests on a support until after contraction has begun is an afterload.
The beating heart operates with both a preload and an afterload (Chapter 11). In the left ventricle, preload is determined by the pressures and volumes during diastole, while afterload is
determined by the pressures and volumes after left ventricular pressure exceeds aortic pressure. Preload and afterload are important clinically because they are major determinants of the work of the heart and influence the energetics of ventricular performance.
determined by the pressures and volumes after left ventricular pressure exceeds aortic pressure. Preload and afterload are important clinically because they are major determinants of the work of the heart and influence the energetics of ventricular performance.
Influence of Afterload on Muscle Work
The relationship between load (P) and work can be understood by comparing a contracted muscle to a spring that, when loaded with a 10-g weight, has increased in length by 10 cm (Fig. 3-2). If the increase in length is linearly proportional to increasing load (Hooke’s law), length will
have increased 1 cm for each gram of added load; conversely, if an initial 10-g load is decreased in 1-g steps, the spring will shorten 1 cm for each gram removed from the load. These relationships are shown in Table 3-1, where column a describes the stepwise decrease in load when a series of lighter weights is hung on the spring after it had been stretched by the 10-g weight. Column b describes the extent of shortening at each lighter weight, while column c lists the work that would have been done if the stretched spring had lifted each of the lighter weights, calculated by multiplying each new load (column a) by the distance that the spring would have shortened at each new load (10-column b). Plotting the work in column c as a function of load demonstrates that no work is done when the load is the same as the maximal load (P = 10 g), because the spring cannot shorten at this load, nor when the spring is completely unloaded (P = 0) because in spite of the large extent of shortening, no force is generated. Instead, work is maximal at the intermediate loads (Fig. 3-3).
have increased 1 cm for each gram of added load; conversely, if an initial 10-g load is decreased in 1-g steps, the spring will shorten 1 cm for each gram removed from the load. These relationships are shown in Table 3-1, where column a describes the stepwise decrease in load when a series of lighter weights is hung on the spring after it had been stretched by the 10-g weight. Column b describes the extent of shortening at each lighter weight, while column c lists the work that would have been done if the stretched spring had lifted each of the lighter weights, calculated by multiplying each new load (column a) by the distance that the spring would have shortened at each new load (10-column b). Plotting the work in column c as a function of load demonstrates that no work is done when the load is the same as the maximal load (P = 10 g), because the spring cannot shorten at this load, nor when the spring is completely unloaded (P = 0) because in spite of the large extent of shortening, no force is generated. Instead, work is maximal at the intermediate loads (Fig. 3-3).
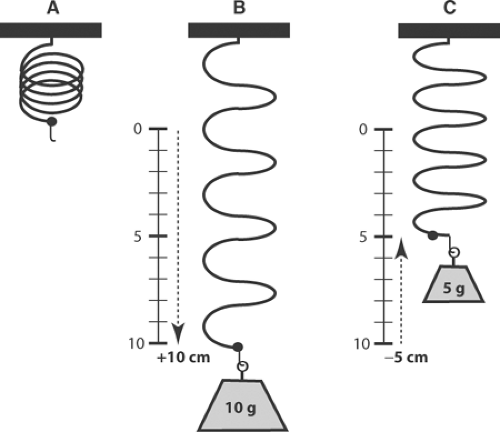 Fig. 3-2: Effect of load on the work done by a spring that obeys Hooke’s law. When the unloaded spring (A) is stretched by a 10-g weight, its length will increase by 10 cm (B). If the 10-g load is then replaced with smaller weights, the spring will shorten by 1 cm for each gram of load that is removed. For example, when the final load is 5 g, the spring will shorten 5 cm (C), and if the weight is removed completely, the spring will shorten 10 cm (A). The work done when the stretched spring in (B) is presented with a series of lighter loads is shown in Table 3-1 and Figure 3-3. |
Table 3-1 Relationship between Shortening and Work Performed When a Spring Stretched by a 10-g Load Is Allowed to Shorten at Lighter Loads | ||||||||||||||||||||||||||||||||||||
|---|---|---|---|---|---|---|---|---|---|---|---|---|---|---|---|---|---|---|---|---|---|---|---|---|---|---|---|---|---|---|---|---|---|---|---|---|
|
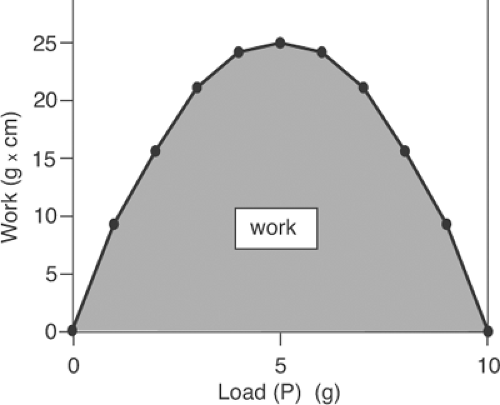 Fig. 3-3: Work-load curve of the spring shown in Figure 3-2. Starting with the spring in its stretched state, the 10-g load is replaced by a series of lighter loads, after which the spring is allowed to life the new load. The amount of work performed in lifting each load is plotted on the ordinate. |
Work-load relationships like that for a spring also describe the influence of load on the work performed by an activated muscle. This similarity led early physiologists to postulate that the transition from rest to activity occurred when a resting muscle formed new spring-like bonds. Although now known to be incorrect, this new elastic body theory is described at this point because recognition of the fundamental error provided the foundation for our modern understanding of muscle energetics.
New Elastic Body Theory of Muscle Contraction
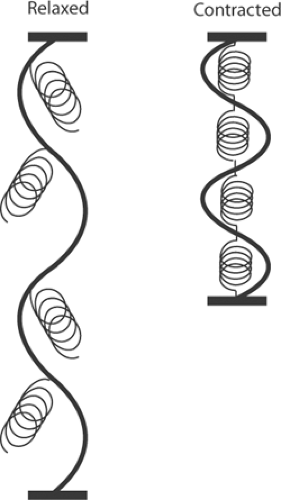
Work-load curves, such as that shown in Figure 3-3, were initially explained by postulating that the transition from rest to activity in a muscle causes new elastic bonds to be formed within the contractile machinery (Fig. 3-4). Contraction was therefore thought to be initiated when chemical energy is used to form spring-like bonds that increase the ability of the muscle to shorten and generate tension. This theory explained why stretching a resting muscle (Fig. 3-4, left) generates only a small amount of tension (resting tension) and the greater stiffness of active muscle (Fig. 3-4, right). According to this theory, activation adds a fixed amount of energy that causes the muscle to become a stiffer spring; that is, a “new elastic body.”
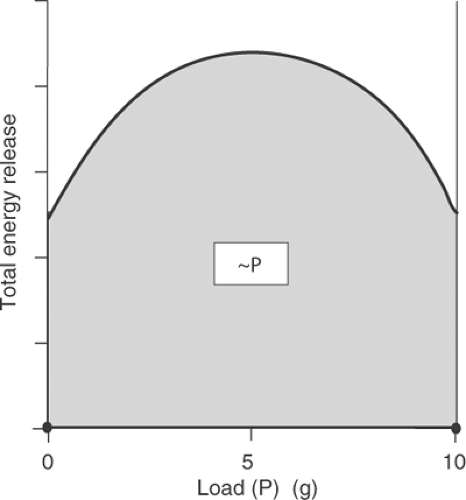
A key assumption of the new elastic body theory was that excitation adds a fixed amount of energy to the muscle to establish the new bonds; for this reason, the total energy available for release by the active muscle (work + heat) should be independent of load. This theory therefore predicted that curves relating load to total energy release would resemble Figure 3-5. At maximum load, all of the energy added during the transition from rest to activity would appear as heat because no work is done. In an unloaded contraction, all of the energy added to establish the new cross-links in the muscle would also appear as heat, again because no work is done. At intermediate loads,
where the release of energy as work is maximal (see Table 3-1 and Fig. 3-3), heat liberation should be minimal because the new elastic body theory predicts that total energy release is independent of load (Fig. 3-5).
where the release of energy as work is maximal (see Table 3-1 and Fig. 3-3), heat liberation should be minimal because the new elastic body theory predicts that total energy release is independent of load (Fig. 3-5).
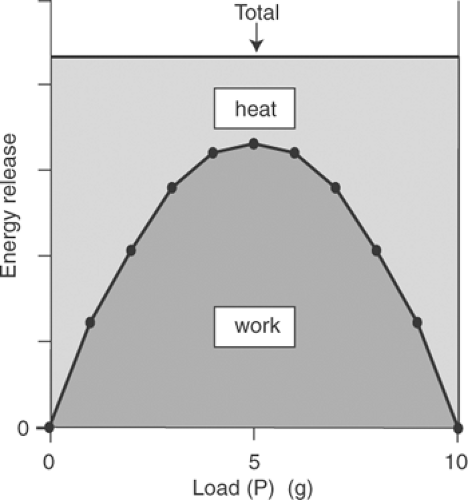 Fig. 3-5: Predicted relationship between loading and total energy released as work plus heat in a muscle that contracts according to the new elastic body theory. Because a fixed amount of energy is added to the muscle during the transition from rest to activity, the total energy released as work and heat should be independent of load. Because the shape of the work-load curve is similar to that of a spring (Fig. 3-3), this theory predicted that heat production would decrease at intermediate loads to maintain a constant amount of energy release. |
The new elastic body theory was widely accepted until Fenn (1923) showed that the total energy liberated by a contracting muscle is not constant, but instead depends on load.
Fenn Effect
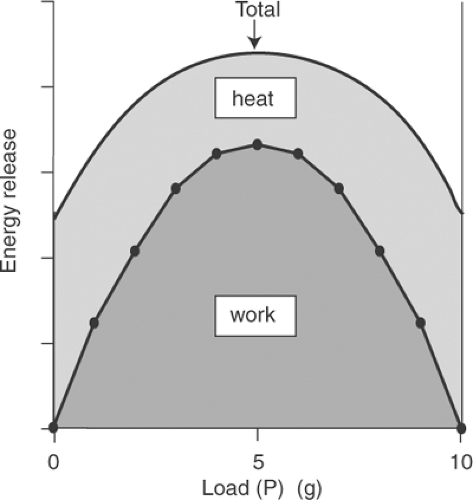
Fenn’s decisive contribution to our understanding of muscle contraction was that the total energy released as work and heat increases when more work is performed (Fig. 3-6). This finding, called the “Fenn effect,” proved that the energy available for release by a contracting muscle is not
determined at the time of activation, but instead depends on load because when muscle does more work, more energy is liberated. This finding indicated that a muscle resembles a gasoline or electric motor, where fuel consumption increases when the motor is more heavily loaded. The Fenn effect was confirmed directly in the early 1960s when high-energy phosphate utilization, like energy release as work plus heat, was shown to be maximal at intermediate loads, where the highest levels of work are performed (Fig. 3-7).
determined at the time of activation, but instead depends on load because when muscle does more work, more energy is liberated. This finding indicated that a muscle resembles a gasoline or electric motor, where fuel consumption increases when the motor is more heavily loaded. The Fenn effect was confirmed directly in the early 1960s when high-energy phosphate utilization, like energy release as work plus heat, was shown to be maximal at intermediate loads, where the highest levels of work are performed (Fig. 3-7).
It is a historical curiosity that the Fenn effect had been documented in cardiac muscle almost a decade before Fenn’s report. In a paper that had been overlooked by most muscle physiologists of the time, but which Fenn cited in his 1923 article, Evans and Matsuoka (1914–1915) reported that cardiac oxygen consumption increases when the heart does more work. This observation led Starling, in his Linacre Lecture describing the “Law of the Heart” (1918), to equate the extra oxygen consumption caused by an increase in cardiac work to the added fuel consumption by a motorcycle when it is ridden up a hill.
Force-Velocity Relationship
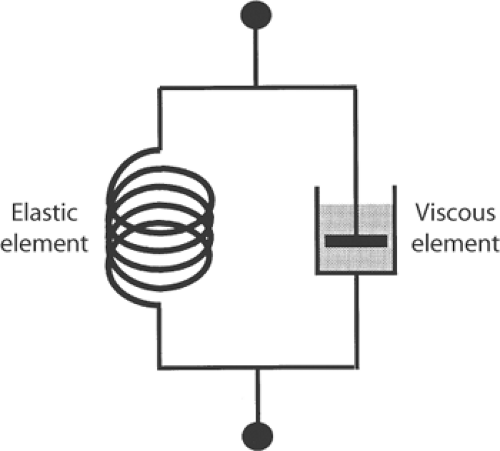
The force-velocity relationship, which plots the influence of load on the velocity of muscle shortening, provides additional evidence that contracting muscle does not behave like a stretched spring. The new elastic body theory, which viewed muscle as made up of parallel elastic and viscous elements (Fig. 3-8), predicted that shortening velocity would increase in a linear manner when load is decreased (curve A, Fig. 3-9). In 1935, however, Fenn and Marsh found this relationship to be hyperbolic (curve B, Fig. 3-9). Although this hyperbolic relationship could be explained in the context of the new elastic body theory by assuming special characteristics for muscle elasticity and viscosity, A. V. Hill demonstrated in 1938 that the hyperbolic shape is also obtained from measurements of work and heat, and so reflects the fundamental energetic properties of the contractile machinery.
Heat Liberation By Muscle
Muscle liberates three types of heat (Fig. 3-10, Table 3-2). Maintenance (resting) heat, the slow liberation of heat by resting muscle, is not related to contraction and so is not considered further. The other two types of heat, which together represent the activity-related heat, are generated when the muscle contracts; these are initial heat and recovery heat. Initial heat appears during contraction, while recovery heat is liberated after the contraction has reached its peak.
Initial Heat
The first component of the heat liberated after stimulation, which for historical reasons is called initial heat, is the extra heat (extra in that it exceeds maintenance heat) released during activation, shortening, and the generation of tension (Fig. 3-10, Table 3-2). The following description relates key biochemical and biophysical processes to different components of initial heat. However, this is imprecise because many processes contribute to more than one phase of heat liberation.
Stay updated, free articles. Join our Telegram channel

Full access? Get Clinical Tree


