Energetics and Energy Production
L arge amounts of chemical energy are expended when the heart pumps blood under pressure into the aorta and pulmonary artery. Most of this energy is derived from the oxidation of fats and carbohydrates so that the heart—which beats without pause—requires an uninterrupted delivery of oxygen via the coronary circulation. Because of this high rate of energy expenditure, the heart’s energy supply is “at the edge,” even under normal conditions; this is why even a brief interruption of coronary flow severely impairs cardiac pump function.
The first clue as to how energy is produced by the heart emerged in the late 18th century when Lavoisier, Priestly, and others observed that oxygen is essential for animal life. Berzelius, an early 19th-century Swedish chemist, identified a role for chemical reactions in muscular contraction when he found that an acid present in sour milk (lactic acid) appeared in the muscles of a stag that had been exhausted during a long hunt. In 1907, Fletcher and Hopkins discovered that this lactate disappears when a fatigued muscle is allowed to recover in the presence of oxygen. Meyerhof, who in the 1920s detailed the enzymatic reactions in glucose metabolism (called glycolysis), showed that lactic acid production is proportional to the amount of work done by a muscle contracting under anaerobic conditions, where lactate cannot be oxidized. This suggested that energy released by glycolysis is directly coupled to muscle contraction:
This attractive hypothesis, although able to explain a large body of experimental data, collapsed in 1930 when Lundsgaard discovered that muscles can contract when glycolysis is blocked with iodoacetic acid. Lundsgaard’s subsequent observation that working muscles hydrolyze phosphocreatine, a labile compound composed of creatine and phosphoric acid, and the demonstration by Eggleton and Eggleton that the decrease in phosphocreatine is proportional to the amount of work performed during muscle contraction, led to a revised hypothesis, that energy is provided for muscle contraction when phosphocreatine is broken down to creatine and inorganic phosphate (Pi):
These observations indicated that glycolysis, instead of delivering energy directly to the contractile machinery, supplies the energy needed to form phosphocreatine from creatine and Pi.
After only a few years, however, the hypothesis that phosphocreatine hydrolysis is directly coupled to muscle contraction had to be abandoned when adenosine triphosphate (ATP) was found to be essential for phosphocreatine breakdown. This led to the discovery that phosphorylation of adenosine diphosphate (ADP), which forms ATP, is essential for the transfer of Pi and its chemical energy from phosphocreatine to energy-consuming reactions. Recognition of the high-energy phosphate bond (∼P) demonstrated that the role of phosphocreatine in cellular energetics is indirect and
depends on transfer of ∼P from phosphocreatine to ADP to form ATP and hydrolysis of ATP to yield ADP, Pi, and chemical energy:
depends on transfer of ∼P from phosphocreatine to ADP to form ATP and hydrolysis of ATP to yield ADP, Pi, and chemical energy:
and
For 30 years, ATP hydrolysis was believed to be coupled directly to muscle contraction, but because muscles contain creatine phosphokinase, an enzyme that regenerates ATP by transferring ∼P from phosphocreatine to ADP (see below), ATP concentration could not be shown to decrease during contraction. It was not until 1962 that discovery of a specific inhibitor of creatine phosphokinase made it possible to demonstrate that ATP hydrolysis is coupled to energy release by working muscle:
The final chapter in this story was written when it was learned how myosin cross-bridges utilize energy released by ATP hydrolysis to effect muscle contraction (see Chapters 4 and 6).
The role of adenine nucleotides in cellular energetics was likened by Albert Szent-Gyárgyi to that of money: ADP accepts chemical energy by incorporating ∼P to form ATP, and ATP supplies chemical energy when its high-energy phosphate bond is hydrolyzed, Like money, ATP can be obtained (regenerated) using energy derived from metabolism of a number of substrates, and ATP can be expended (hydrolyzed) to energize a variety of energy-consuming processes including muscle contraction and relaxation, active transport, and biosynthesis. According to this monetary analogy, the ∼P in phosphocreatine represents a cash reserve.
“Patterns” of Energy Production and Utilization by Different Muscles
Adaptation of the pathways of energy production and energy utilization to the functional needs of different muscle types can be understood by examining the behavior of two long-eared European mammals, the rabbit and the hare (Fig. 2-1). The rabbits live in burrows from which they venture only a short distance in search of food and adventure; to escape predators they rely on a rapid sprint to safety so that survival depends on their ability to accelerate quickly and run rapidly for short distances. Although excellent sprinters, rabbits are poor distance runners, tiring quickly if they cannot reach their burrow. Many species of hare, on the other hand, have no burrow but range widely in their habitat. These hares are excellent distance runners, relying on their staying power to escape pursuers—indeed the coursing of hares has been known since antiquity.
Early in the 20th century, it became clear to scientists—although this information had long been known to hunters and cooks—that the back and leg muscles of rabbits and hares differ in color; those in the rabbit are pale pink, almost white, whereas the back and leg muscles of the hare are deep red. Similar relationships between muscle color and function are found in other vertebrate species: “white” muscle is generally found where the need is for short bursts of intense activity, and “red” muscle where activity is sustained. In common culinary experience the chicken breast, which powers wings that are used only briefly, is white meat, whereas the dark meat of the chicken leg is obtained from muscles that are used for more continuous activity, such as walking
around a barnyard. In birds capable of sustained flight, unlike the chicken, the breast muscles are red (e.g., the dark meat of duck or goose breast), whereas the muscles of a snake, which strikes, and a frog, which hops, are white.
around a barnyard. In birds capable of sustained flight, unlike the chicken, the breast muscles are red (e.g., the dark meat of duck or goose breast), whereas the muscles of a snake, which strikes, and a frog, which hops, are white.
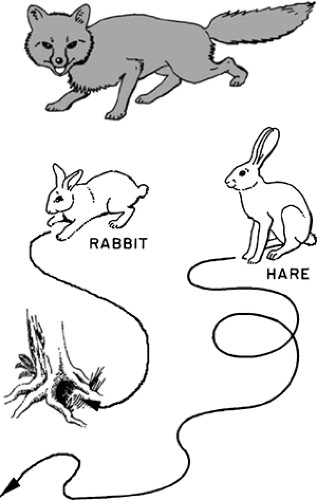 Fig. 2-1: Functional specializations of the European rabbit and hare. When confronted with danger, such as a fox, the rabbit tries to escape by sprinting to its burrow, whereas the hare tries to outrun, and outlast, the pursuing fox. |
The following discussion focuses on red and white muscles, which represent the “extremes” of biochemical specialization (Table 2-1); intermediate muscle types exist and there are exceptions
to the generalizations described below. For clarity in describing how biochemical specializations meet functional needs these exceptions are not considered further.
to the generalizations described below. For clarity in describing how biochemical specializations meet functional needs these exceptions are not considered further.
Table 2-1 Biochemical Differences between Red and White Muscle | |||||||||||||||||||||||||||
|---|---|---|---|---|---|---|---|---|---|---|---|---|---|---|---|---|---|---|---|---|---|---|---|---|---|---|---|
|
Energy Production and Utilization By Red and White Muscle
Red muscle is specialized for sustained activity, during which the rate of energy utilization cannot exceed that of energy production. This requires an uninterrupted supply of large amounts of ATP, which can be produced only by oxidative (aerobic) metabolism. The most important substrates for aerobic energy production are lipids, and to a lesser extent carbohydrates. Although red muscles can carry out anaerobic glycolysis and have a limited reserve of high-energy phosphate in the form of phosphocreatine, these are of little functional significance because neither can regenerate the large supply of ATP needed to sustain intense muscular activity. The red color of these muscles is due mainly to myoglobin, a heme-containing protein that facilitates oxygen diffusion through the muscle.
Red muscles pay a threefold price for their dependence on a high rate of ATP production. First, these muscles depend on an uninterrupted supply of oxygen to generate the ATP consumed during sustained activity. If blood flow is interrupted, lack of oxygen quickly brings oxidative metabolism to a stop and exhausts the phosphocreatine stores. Although anaerobic glycolysis can provide a limited supply of ATP, it is not sufficient for sustained activity. Second, to carry out oxidative metabolism, red muscle myocytes must contain a large volume of mitochondria, which, by occupying space that could otherwise contain contractile proteins, weakens the muscle. The third price, which helps match energy utilization and energy production, is that the contractile proteins have a low intrinsic rate of ATP hydrolysis (ATPase activity); this slows intrinsic shortening velocity and weakens these muscles (see Chapter 6).
In white muscles, a limited supply of ATP can be regenerated from phosphocreatine and by anaerobic glycolysis, but these muscles do not depend on oxidative metabolism during their brief periods of intense activity. Because the rate of energy expenditure exceeds that of energy production, white muscles require periods of rest to allow the lactate produced by glycolysis to be oxidized to CO2 and water. This represents an “oxygen debt” that is repaid by the muscle when lactate is oxidized during periods of inactivity, and by the liver, after the lactate has entered the circulation. White muscles are not required to balance the rates of energy production and energy utilization during their brief bursts of activity so that their contractile proteins can have a high ATPase activity, which allows these muscles to achieve a high shortening velocity (see Chapter 6). Muscle strength is also increased because cell volume otherwise occupied by mitochondria contains contractile proteins.
The physiological consequences of these biochemical specializations allow the rabbit to escape pursuit by a rapid dash to its burrow (the “jackrabbit start”); should the rabbit fail to reach safety, it soon tires because phosphocreatine stores are quickly depleted, anaerobic glycolysis ceases, and lactic acid accumulation causes its muscles to become acidotic. Once in its burrow, the rabbit requires a period of rest to replenish its phosphocreatine reserves and to repay the “oxygen debt”—if the rabbit shown in Figure 2-1 is caught, repaying this debt becomes the fox’s problem. The hare, which relies on its staying power to elude pursuers, can run long distances because, even during intense activity, its red muscles regenerate ATP at the same rate at which it is being consumed. These muscles, however, require the continuous delivery of oxygen and substrate via the bloodstream. Because of the lower intrinsic ATPase of their contractile proteins and the larger volume of muscle occupied by mitochondria, the running muscles of the hare are slower and weaker than those of the rabbit. These differences were summarized by W.F.H.M.
Mommaerts, who said that white muscle operates on a “twitch now, pay later” basis, whereas the modus operandi of red muscle is “pay as you go.”
Mommaerts, who said that white muscle operates on a “twitch now, pay later” basis, whereas the modus operandi of red muscle is “pay as you go.”
In humans, most skeletal muscles contain several fiber types. These include slow oxidative fibers, which are similar to the red muscles described above, fast glycolytic fibers, which are like white muscle (although the muscles are pink in color), and fast oxidative-glycolytic fibers, which have high ATPase contractile proteins but contain numerous mitochondria and so can produce ATP by oxidative reactions (Pette and Staron, 1990). The heart, of course, functions like a red muscle.
Muscular Efficiency
The efficiency of muscular contraction can be viewed in several ways (Backx, 1993). Thermodynamic efficiency, the ratio between the mechanical work performed during contraction and the free energy made available by substrate metabolism, is precise but impractical because the free energy changes in most of the chemical reactions in muscle are not precisely known. It is therefore more useful to estimate mechanical efficiency, the ratio between useful work and the enthalpy changes during substrate metabolism.
An interplay between the load and the intrinsic ATPase activity of the contractile proteins influences the mechanical efficiency of a muscle (see Chapter 3). When contracting against a light load, fast muscles with high ATPase myosins are more efficient than slow muscles, whose contractile proteins hydrolyze ATP at a slower intrinsic rate. However, when lifting a heavy load, slow muscles develop tension at less energy cost than do fast muscles (Awan and Goldspink, 1972). For this reason, muscles with high ATPase contractile proteins are more efficient when shortening rapidly at low tension, whereas muscles with low ATPase contractile proteins are more efficient when developing high levels of tension. Human ventricles, which contain mostly a low ATPase myosin, contract relatively efficiently when wall stress is high.
Enthalpy changes in the working heart are readily calculated by measuring cardiac oxygen consumption because the myocardium regenerates ATP almost entirely by oxidative metabolism. Even though the energy liberated by the oxidation of fat (∼9 kcal/g) is more than twice that of either carbohydrate or protein (∼4 kcal/g) (also see Table 2-5), more oxygen is needed to metabolize fat. As a result, the enthalpies of the oxidation of all three substrates, when calculated per liter of oxygen consumed, are similar: fat 4.69 kcal, carbohydrate 5.05 kcal, and protein 4.60 kcal. Cardiac efficiency can therefore be estimated as the ratio between the work performed and the energy equivalent of the oxygen consumed (see Chapter 12).
Cardiac efficiencies calculated from measurements of external work and oxygen consumption are usually less than 20% to 25%. The efficiency of the contractile process itself is higher because some of the energy consumed by the heart is used for processes other than contraction (e.g., active ion fluxes). A major cause of the heart’s inefficiency is heat liberation during relaxation, when energy that had been expended to stretch elasticities in the walls of the contracting ventricle is dissipated as heat (see Chapter 12). Efficiencies as high as 40% can be calculated during ejection (Suga et al., 1993); these compare favorably with efficiencies of approximately 30% for man-made machines, such as gasoline engines.
Overview of Energy Production by the Heart
The heart can be viewed as an omnivore because it is able to regenerate ATP by metabolizing fats, carbohydrates, and proteins. Most of the energy utilized by the heart is derived from the oxidation of fats; carbohydrate metabolism makes an important contribution, whereas amino
acid metabolism normally contributes little to cardiac energy production. Unlike fat, which can be metabolized only in the well-oxygenated heart, carbohydrates are metabolized by glycolysis under both aerobic and anaerobic conditions. Anaerobic glycolysis, however, has only a limited ability to regenerate ATP and cannot meet the energy needs of the beating heart, which explains why interruption of oxygen supply to mammalian hearts brings effective contraction to a halt within less than a minute (see Chapter 17). Aerobic glycolysis also generates only a fraction of the energy used by normal hearts but plays a key role in supplying substrate for oxidative metabolism.
acid metabolism normally contributes little to cardiac energy production. Unlike fat, which can be metabolized only in the well-oxygenated heart, carbohydrates are metabolized by glycolysis under both aerobic and anaerobic conditions. Anaerobic glycolysis, however, has only a limited ability to regenerate ATP and cannot meet the energy needs of the beating heart, which explains why interruption of oxygen supply to mammalian hearts brings effective contraction to a halt within less than a minute (see Chapter 17). Aerobic glycolysis also generates only a fraction of the energy used by normal hearts but plays a key role in supplying substrate for oxidative metabolism.
Glycogen Formation and Breakdown
Carbohydrate is stored in the heart as glycogen, a polysaccharide made up of glucose 1-phosphate. Glycogen formation and breakdown do not occur by a single reversible reaction, but instead utilize two separate pathways that are catalyzed by different enzymes (Fig. 2-2). The key enzymes in glycogen formation (glycogen synthase) and glycogen breakdown (phosphorylase) exist in active and inactive forms whose interconversions are regulated by sympathetic stimulation, high-energy phosphate levels, and metabolic intermediates (Greenberg et al., 2006).
Glycogen Formation: Glycogen Synthase
Glycogen synthesis begins when phosphoglucomutase catalyzes the isomerization of glucose 6-phosphate, which forms glucose 1-phosphate. The latter is polymerized to form glycogen in a two-step reaction (Fig. 2-2, left). The first, which is catalyzed by glucose 1-phosphate uridylyltransferase, uses energy in uridine triphosphate to form uridine diphosphoglucose. The
latter is added to the glycogen polymer in the second step, which releases uridine diphosphate. The second step, which is rate-limiting, is catalyzed by glycogen synthase whose activity is regulated by covalent modification (phosphorylation and dephosphorylation) and allosteric responses to high-energy phosphate and glucose 6-phosphate levels. A third type of control, translocation to structures linked to the actin cytoskeleton, also regulates glycogen synthase (Prats et al., 2005, 2009).
latter is added to the glycogen polymer in the second step, which releases uridine diphosphate. The second step, which is rate-limiting, is catalyzed by glycogen synthase whose activity is regulated by covalent modification (phosphorylation and dephosphorylation) and allosteric responses to high-energy phosphate and glucose 6-phosphate levels. A third type of control, translocation to structures linked to the actin cytoskeleton, also regulates glycogen synthase (Prats et al., 2005, 2009).
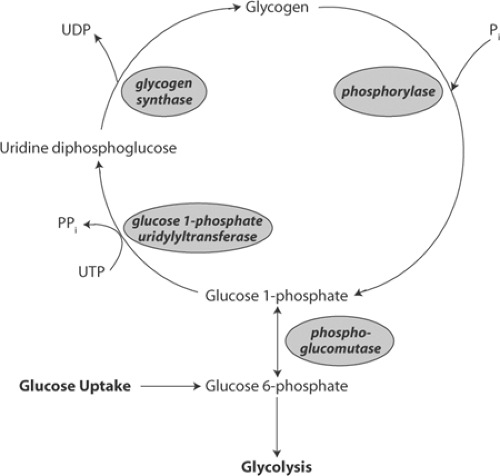 Fig. 2-2: Pathways of glycogen formation (left, reading upward) differ from those of glycogen breakdown (right, reading downward). Glycogen synthesis involves two steps. The first transfers uridine from uridine triphosphate (UTP) to glucose 1-phosphate. The second step adds uridine diphosphoglucose (UDPG) to glycogen and releases uridine diphosphate (UDP). Glycogen breakdown releases glucose 1-phosphate that, after isomerization to glucose 6-phosphate, can enter the glycolytic pathway. Glycogen synthesis is regulated by glycogen synthase, whereas phosphorylase regulates glycogenolysis. |
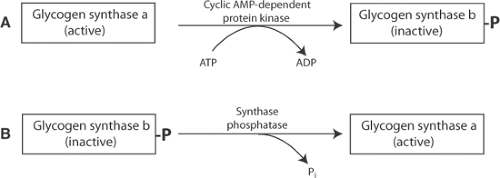 Fig. 2-3: Phosphorylation and dephosphorylation reactions that control glycogen synthase activity. A: Phosphorylation by cyclic adenosine monophosphate (AMP)-dependent protein kinase converts the active, dephosphorylated glycogen synthase a to the less active, phosphorylated glycogen synthase b. B: Dephosphorylation by synthase phosphatase converts phosphorylated glycogen synthase b to the more active, glycogen synthase a. ADP, adenosine diphosphate; ATP, adenosine triphosphate. |
Glycogen synthase exists in two forms whose interconversions are controlled by phosphorylation and dephosphorylation reactions (Fig. 2-3). Glycogen synthesis is slowed when sympathetic stimulation activates a cyclic adenosine monophosphate (AMP)-dependent protein kinase (protein kinase A or PK-A) that converts the more active a (dephospho-) form of glycogen synthase to the less active b (phospho-) form (Fig. 2-3A). Phosphorylation of glycogen synthase a does not directly inhibit the enzyme, but instead increases the stimulatory effects of several substrates and metabolites. Most important are those of ATP and glucose 6-phosphate which, by increasing the catalytic activity of glycogen synthase b, promote glycogen storage when an abundant supply of energy maintains high levels of these activators. Glycogen synthesis returns to its high basal rate when glycogen synthase b is dephosphorylated by synthase phosphatase to form the more active glycogen synthase a (Fig. 2-3B).
Glycogen Breakdown: Phosphorylase
Glycogen breakdown, which releases glucose 1-phosphate (Fig. 2-2, right), is catalyzed by phosphorylase, which, like glycogen synthase, is regulated by phosphorylation and dephosphorylation (Fig. 2-4). In contrast to glycogen synthase, in which the phosphorylated enzyme is less active, phosphorylated phosphorylase a is the active enzyme. The less active phosphorylase b is inhibited by ATP and glucose 6-phosphate, and activated by inorganic phosphate (Pi). Because these inhibitory effects are incomplete, phosphorylase b remains able to hydrolyze glycogen in energy-starved hearts, where ATP and glucose 6-phosphate levels fall and Pi levels rise.
Phosphorylation of phosphorylase b is catalyzed by phosphorylase kinase, which increases glycogen breakdown when cyclic AMP levels are increased in response to sympathetic stimulation.
However, cyclic AMP does not interact directly with phosphorylase kinase, but instead activates a cyclic AMP-dependent protein kinase, called phosphorylase kinase kinase, that phosphorylates phosphorylase b kinase (Fig. 2-5). Increased levels of cytosolic calcium also mobilize glycogen, in this case by activating a calcium/calmodulin-dependent protein kinase that, like phosphorylase kinase kinase, phosphorylates and activates phosphorylase kinase. Glycogen breakdown slows to its basal level when phosphorylase kinase is dephosphorylated and inhibited by phosphorylase kinase phosphatase, which allows phosphorylase a to be dephosphorylated and converted to the less active phosphorylase b by phosphorylase phosphatase.
However, cyclic AMP does not interact directly with phosphorylase kinase, but instead activates a cyclic AMP-dependent protein kinase, called phosphorylase kinase kinase, that phosphorylates phosphorylase b kinase (Fig. 2-5). Increased levels of cytosolic calcium also mobilize glycogen, in this case by activating a calcium/calmodulin-dependent protein kinase that, like phosphorylase kinase kinase, phosphorylates and activates phosphorylase kinase. Glycogen breakdown slows to its basal level when phosphorylase kinase is dephosphorylated and inhibited by phosphorylase kinase phosphatase, which allows phosphorylase a to be dephosphorylated and converted to the less active phosphorylase b by phosphorylase phosphatase.
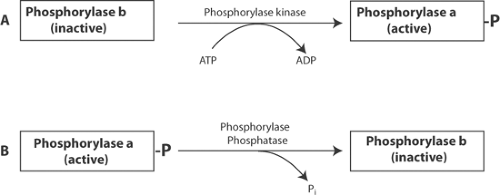 Fig. 2-4: Phosphorylation and dephosphorylation reactions that control phosphorylase activity. A: Phosphorylation by phosphorylase b kinase converts the less active, dephosphorylated phosphorylase b to the more active phosphorylase a. B: Dephosphorylation by phosphorylase phosphatase converts phosphorylase a to the less active, phosphorylase b. ADP, adenosine diphosphate; ATP, adenosine triphosphate. |
The reactions described above provide an integrated control mechanism that allows cyclic AMP to regulate the flux of glucose 1-phosphate into and out of glycogen stores (Fig. 2-6). Cyclic AMP-stimulated phosphorylations increase glucose supply by inhibiting glycogen synthase and
stimulating phosphorylase, while dephosphorylation of these enzymes shifts the balance toward glycogen synthesis. In this way, sympathetic stimulation, which increases cardiac energy utilization (see Chapter 8), increases energy production by favoring glycogen breakdown.
stimulating phosphorylase, while dephosphorylation of these enzymes shifts the balance toward glycogen synthesis. In this way, sympathetic stimulation, which increases cardiac energy utilization (see Chapter 8), increases energy production by favoring glycogen breakdown.
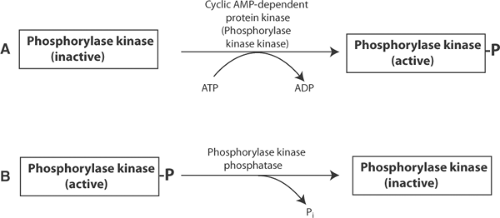 Fig. 2-5: Phosphorylation and dephosphorylation reactions that control the activity of phosphorylase b kinase. A: Phosphorylation is catalyzed by phosphorylase kinase kinase, a cyclic AMP-dependent protein kinase that converts the inactive, dephosphorylated form of phosphorylase kinase to the active form. B: Dephosphorylation of phosphorylated phosphorylase kinase by phosphorylase kinase phosphatase forms the inactive enzyme. ADP, adenosine diphosphate; AMP, adenosine monophosphate; ATP, adenosine triphosphate. |
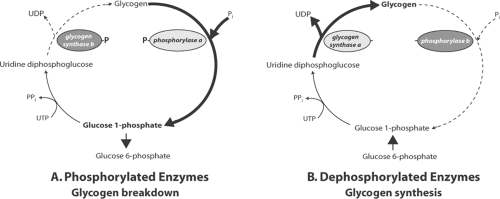 Fig. 2-6: Integrated control of glycogen formation and breakdown by phosphorylation and dephosphorylation of glycogen synthase and phosphorylase. A: Glycogen synthesis is inhibited and glycogen breakdown is accelerated after phosphorylation has converted glycogen synthase a to the less active b form and phosphorylase b to the more active a form. B: Glycogen synthesis is accelerated and glycogen breakdown is inhibited when both enzymes are dephosphorylated, which converts glycogen synthase to the more active a form and phosphorylase to the less active b form. UDP, uridine diphosphate; UTP, uridine triphosphate. |
Debranching Enzymes
Glycogen is a highly branched polysaccharide that requires debranching enzymes to release glucose residues at the branch points. Although these reactions are not normally rate-limiting, molecular abnormalities in the debranching enzymes can cause glycogen storage diseases by preventing the complete breakdown of glycogen.
Glycolysis
Glycolysis describes the process by which glucose, a 6-carbon sugar, is broken down to form 2 moles of pyruvate, a 3-carbon product (Fig. 2-7). Utilization of a series of steps, rather than a single reaction, allows the energy released during glycolysis to be captured as high-energy
phosphate bonds of ATP and the reactive electrons that energize oxidative phosphorylation (see below). In the initial steps of glycolysis, 2 moles of ATP/mole of glucose are utilized to energize the carbohydrate, whereas generation of 4 moles of ATP/mole of glucose toward the end of the glycolytic pathway yields a net of 2 moles of ATP/mole of glucose. Glycolysis also reduces coenzymes that, when oxidized in the mitochondria, regenerate additional ATP (see below). In aerobic (well-oxygenated) hearts, the end-product of glycolysis is pyruvate that is oxidized and decarboxylated to form acetyl-CoA. Under anaerobic conditions, on the other hand, pyruvate is reduced to form lactate.
phosphate bonds of ATP and the reactive electrons that energize oxidative phosphorylation (see below). In the initial steps of glycolysis, 2 moles of ATP/mole of glucose are utilized to energize the carbohydrate, whereas generation of 4 moles of ATP/mole of glucose toward the end of the glycolytic pathway yields a net of 2 moles of ATP/mole of glucose. Glycolysis also reduces coenzymes that, when oxidized in the mitochondria, regenerate additional ATP (see below). In aerobic (well-oxygenated) hearts, the end-product of glycolysis is pyruvate that is oxidized and decarboxylated to form acetyl-CoA. Under anaerobic conditions, on the other hand, pyruvate is reduced to form lactate.
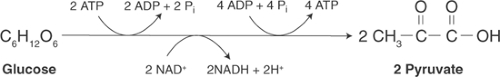 Fig. 2-7: Overall reaction of glycolysis in which glucose is metabolized to form pyruvate. ADP, adenosine diphosphate; ATP, adenosine triphosphate; NAD+, oxidized nicotinamide adenine dinucleotide; NADH, reduced nicotinamide adenine dinucleotide. |
Enzymes, Coenzymes, and the Cytoskeleton
Glycolytic enzymes were once viewed as proteins and protein complexes that diffuse freely through the cytosol. It is now clear, however, that organization of glycolytic enzymes by the cytoskeleton allows substrates to be delivered to appropriate enzymes and ATP to be released near energy-utilizing structures. This structural organization explains why ATP regenerated by glycolytic pathways (“glycolytic ATP”) is used preferentially in some energy-consuming reactions.
Coenzymes, which are much smaller than enzymes, play an essential role in glycolysis and other metabolic processes. Because coenzymes often contain moieties that cannot be synthesized by mammalian cells, they must be included in the diet as vitamins. Several oxidized coenzymes participate in redox reactions by accepting electrons released in a variety of reactions; this generates reduced coenzymes that can be oxidized in the mitochondria to provide energy for ATP regeneration (see below). Coenzymes that participate in redox reactions include nicotinamide adenine dinucleotide (NAD), which contains niacin; coenzyme Q (ubiquinone), an electron carrier with a quinone group; and flavine mononucleotide (FMN) and flavine adenine dinucleotide (FAD), which contain riboflavin. Nicotinamide adenine dinucleotide phosphate (NADP), which is similar to NAD except that it contains an additional phosphate, generally participates in biosynthetic rather than energy-producing reactions.
Additional coenzymes include thiamine pyrophosphate, which serves as a cofactor for decarboxylations, and lipoic acid, which participates in transacetylations. Thiamine deficiency causes beriberi, which can be accompanied by high output heart failure. Coenzyme A (CoA), which contains a vitamin called pantothenic acid, has a reactive sulfhydryl group (hence the abbreviation CoA-SH) that activates acetate, fatty acids, and other substrates by forming a high-energy thioester bond analogous to the high-energy phosphate bond of ATP.
Overview of Glucose Metabolism
Glycolysis is regulated by four different signaling mechanisms (Table 2-2). Three are functional signals that modify the catalytic activity of existing structures, whereas the fourth, proliferative or transcriptional signaling, alters gene expression. Many steps in glucose metabolism are regulated by more than one type of signal.
Functional signals regulate glucose metabolism at the six numbered steps marked by asterisks in Figure 2-8. Humoral control by sympathetic stimulation increases glycolytic rate by accelerating fructose 1,6-bisphosphate formation from fructose 6-phosphate, which is the rate-limiting step for glycolysis in the normal heart. A second type of functional signal also operates at this step to match the rates of energy production and energy utilization by allowing high ATP concentrations to inhibit glycolysis, and ∼P depletion, which increases ADP and AMP and
Pi levels, to stimulate glycolysis. The third type of functional signal responds to changes in redox potential, which defines the tendency of electrons to flow between members of redox pairs like NADH and NAD+. This mechanism, which responds to the balance between oxidized and reduced coenzymes, regulates glyceraldehyde 3-phosphate oxidation and conversion of pyruvate to lactate, and slows glycolysis when NADH accumulates and NAD+ becomes depleted in energy-starved hearts.
Pi levels, to stimulate glycolysis. The third type of functional signal responds to changes in redox potential, which defines the tendency of electrons to flow between members of redox pairs like NADH and NAD+. This mechanism, which responds to the balance between oxidized and reduced coenzymes, regulates glyceraldehyde 3-phosphate oxidation and conversion of pyruvate to lactate, and slows glycolysis when NADH accumulates and NAD+ becomes depleted in energy-starved hearts.
Table 2-2 Signaling Mechanisms That Regulate Energy Production in the Heart | |||||||||||
|---|---|---|---|---|---|---|---|---|---|---|---|
| |||||||||||
The fourth type of control, long-term regulation by proliferative signaling, differs fundamentally from the three functional mechanisms because, instead of modifying the activity of preexisting enzymes, transporters, and so forth, it alters their synthesis. Proliferative signaling, which increases glycolytic capacity in hypertrophied hearts, plays an important role in heart failure (Chapter 18).
An analogy to a factory is useful in understanding how these four types of mechanism regulate glycolysis. Production (glycolytic rate) is determined by the incentive to produce (neurotransmitters and hormones), delivery of raw materials (supply of substrates), stores (ATP level), debt (ADP and AMP levels), supply of parts (oxidized coenzymes), and the availability and types of tools used in production (content and isoform characteristics of glycolytic enzymes).
Glucose Transport
Glucose enters myocardial cells (*1, Fig. 2-8) by moving down a concentration gradient from the extracellular space into the cytosol and so does not require the expenditure of energy. However, glucose uptake is mediated by GLUT4, a transporter that moves between intracellular vesicles, called recycling endosomes, and the plasma membrane. Under basal conditions, most of the GLUT4 is sequestered in the endosomes where it is inactive. Insulin, ischemia, and hypoxia accelerate glucose uptake by recruiting the GLUT4-containing endosomes to the plasma membrane where the transporter is able to bind extracellular glucose for transport into the cell.
Hexokinase
Before glucose can be metabolized, it is phosphorylated by hexokinase in a reaction that “invests” the first of 2 moles of high-energy phosphate per mole of glucose (*2, Fig. 2-8). Hexokinase is regulated by allosteric effects of glucose 6-phosphate, ATP, ADP, AMP, and Pi. Most
important is the inhibitory effect of the product, glucose 6-phosphate, which slows glycolysis when the heart has an abundant supply of energy. ATP potentiates this inhibitory response, whereas ADP, AMP, and Pi—whose concentrations increase when the heart is energy-starved—accelerate glycolysis by reducing the inhibitory effect of glucose 6-phosphate. Together, these responses help match the rates of energy production and energy utilization by accelerating the hexokinase reaction when increased cardiac work lowers glucose 6-phosphate and ATP concentrations and increases ADP, AMP, and Pi levels.
important is the inhibitory effect of the product, glucose 6-phosphate, which slows glycolysis when the heart has an abundant supply of energy. ATP potentiates this inhibitory response, whereas ADP, AMP, and Pi—whose concentrations increase when the heart is energy-starved—accelerate glycolysis by reducing the inhibitory effect of glucose 6-phosphate. Together, these responses help match the rates of energy production and energy utilization by accelerating the hexokinase reaction when increased cardiac work lowers glucose 6-phosphate and ATP concentrations and increases ADP, AMP, and Pi levels.
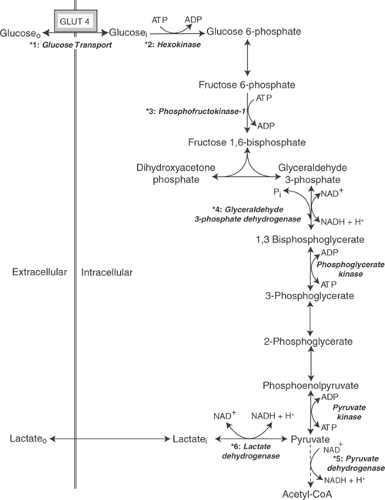 Fig. 2-8: Major control points in glucose metabolism: translocation of GLUT-4 to the plasma membrane, which facilitates glucose transport into the cell (*1); hexokinase, which catalyzes glucose phosphorylation (*2); phosphofructokinase, which catalyzes fructose 6-phosphate phosphorylation (*3); glyceraldehyde 3-phosphate dehydrogenase, which catalyzes glyceraldehyde 3-phosphate oxidation (*4); pyruvate dehydrogenase, which catalyzes acetyl-CoA formation (*5); and lactate dehydrogenase, which catalyzes pyruvate reduction (*6). ADP, adenosine diphosphate; ATP, adenosine triphosphate; NAD+, oxidized nicotinamide adenine dinucleotide; NADH, reduced nicotinamide adenine dinucleotide. |
6-Phosphofructo-1-Kinase
Following an isomerization reaction catalyzed by phosphoglucomutase, which converts glucose 6-phosphate to fructose 6-phosphate, a second mole of ∼P is invested to phosphorylate fructose 6-phosphate, which forms fructose 1,6-bisphosphate (*3, Fig. 2-8). The latter reaction, which is the rate-limiting step of aerobic glycolysis, is catalyzed by 6-phosphofructo-1-kinase (phosphofructokinase-1 or PFK). This highly regulated enzyme complex, like hexokinase, is inhibited by ATP and stimulated by the products of ATP hydrolysis. PFK is especially sensitive to stimulation by AMP, which helps increase energy production in response to increased energy utilization by allowing a small increase in AMP to accelerate glycolysis. PFK activity is also increased by fructose 2,6-bisphosphate, which is produced from fructose 6-phosphate in a “side-reaction” that is catalyzed by 6-phosphofructo-2-kinase (phosphofructokinase-2); the latter, a cyclic AMP-dependent protein kinase, accelerates glycolysis when cardiac energy utilization is increased by sympathetic stimulation. Calcium, which like sympathetic stimulation accelerates cardiac energy utilization, also stimulates PFK. Acidosis, a powerful inhibitor of PFK, slows glycolysis when conversion of pyruvate to lactate releases protons; this is one reason why anaerobic glycolysis, although initially accelerated in the anaerobic heart, quickly slows after coronary artery occlusion (see Chapter 17).
In 1861, Louis Pasteur found that ethanol production by fermenting grapes is inhibited by exposure to air. This inhibition of glycolysis by aerobic metabolism, called the Pasteur effect, is due largely to a decrease in PFK activity that occurs when glucose oxidation increases ATP concentration and reduces ADP, AMP, and Pi levels.
Allosteric control of PFK utilizes a mechanism, called amplification, that allows small changes in ATP, ADP, and especially AMP concentrations to exert large effects on glycolytic rate (see below). Because the free energy available from ATP hydrolysis is proportional to the ATP/ADP ratio, minimizing a fall in this ratio is important for the heart, where as little as a 15% to 25% reduction in the ATP/ADP ratio can reduce the free energy available from ATP hydrolysis to levels that impair vital energy-dependent reactions (Kammermeier et al., 1982; Tian and Ingwall, 1996).
Glyceraldehyde 3-Phosphate Dehydrogenase
The next control point in glycolysis occurs after fructose 1,6-bisphosphate is hydrolyzed to form 2 moles of triose. This step, where glyceraldehyde 3-phosphate is oxidized and phosphorylated to form 1,3-bisphosphoglycerate, is catalyzed by glyceraldehyde 3-phosphate dehydrogenase (GAPDH) (*4, Fig. 2-8). The GAPDH reaction does not determine glycolytic rate in the normal heart, where PFK activity is rate-limiting, but 1,3-bisphosphoglycerate formation can become rate-limiting during hypoxia or ischemia, or when the heart is performing high levels
of work. Under conditions in which PFK is activated by lowered ATP concentration and increased ADP, AMP, and Pi levels (see above), control of glycolysis shifts “downstream” to the GAPDH reaction. In energy-starved hearts, this reaction is eventually slowed by depletion of NAD+, accumulation of NADH and 1,3-bisphosphoglycerate, and acidosis.
of work. Under conditions in which PFK is activated by lowered ATP concentration and increased ADP, AMP, and Pi levels (see above), control of glycolysis shifts “downstream” to the GAPDH reaction. In energy-starved hearts, this reaction is eventually slowed by depletion of NAD+, accumulation of NADH and 1,3-bisphosphoglycerate, and acidosis.
Phosphoglycerate Kinase and Pyruvate Kinase
There are two steps in glycolysis where ATP is regenerated by substrate-level phosphorylation. In the first, the phosphate used to form 1,3-bisphosphoglycerate is energized and transferred to ADP by phosphoglycerate kinase. The second substrate-level phosphorylation is catalyzed by pyruvate kinase, which forms pyruvate and ATP from phosphoenolpyruvate and ADP (Fig. 2-8). Although pyruvate kinase regulates glycolysis in some tissues, it does not play an important regulatory role in the heart.
Pyruvate Metabolism
Pyruvate stands at a metabolic “crossroads” between aerobic and anaerobic energy production because it can be oxidized to form acetyl-CoA or reduced to form lactate. The road taken is determined in part by the activities of two enzymes: pyruvate dehydrogenase (PDH) and lactate dehydrogenase (LDH). In well-oxygenated hearts, PDH catalyzes the conversion of pyruvate to acetyl coenzyme A (acetyl-CoA) (*5, Fig. 2-8), which can be oxidized in the citric acid cycle (see below). In anaerobic hearts, on the other hand, pyruvate is reduced to lactate by LDH, which generates a limited amount of NAD+ (*6, Fig. 2-8).
Lactate Dehydrogenase
LDH functions as a tetramer made up of two isoforms called M and H; all combinations (H4, H3M, H2M2, H1M3, and M4) are found in muscle, but the M isoform occurs mainly in skeletal muscle, whereas H is most prevalent in the heart. The metabolic fate of pyruvate is determined in part by the affinity of LDH for pyruvate, which is higher for the M than the H subunits. In skeletal muscles where energy production depends mainly on anaerobic glycolysis, the M subunits of LDH bind to pyruvate which is then reduced to lactate (*6, Fig. 2-8), whereas in well-oxygenated hearts that have an abundant supply of NAD+, the lower pyruvate affinity of the H subunits of LDH allows pyruvate to be oxidized and decarboxylated by PDH (see below).
Stay updated, free articles. Join our Telegram channel

Full access? Get Clinical Tree


