Serial electrocardiographic monitoring of ΔQTc as an assumed harbinger of proarrhythmia is currently recommended for dofetilide and sotalol initiation. Markers of repolarization heterogeneity such as increased peak to end of T-wave (TpTe) duration and abnormal T-wave morphology may also predict proarrhythmia. We investigated whether such T-wave measurements on baseline electrocardiogram will correlate with ΔQTc after drug initiation. An analysis of 140 consecutive patients with paroxysmal atrial fibrillation hospitalized in sinus rhythm for sotalol or dofetilide initiation was performed. Baseline and serial electrocardiograms were analyzed using QT Guard Plus software (GE Healthcare), which measured QTc and TpTe and scored T-wave morphology for asymmetry, notching, and flatness using T-wave vector magnitude and principal component analysis algorithms. Sotalol and dofetilide were administered in 71% and 29% of patients, respectively. Mean age was 61 ± 14 years, and 34% were women. After a single dose of either drug, there was a statistically significant increase in QTc and TpTe (p <0.01), as well as composite and individual T-wave markers of repolarization heterogeneity (p <0.01). QTc increased by a mean of 19 ± 30 ms after initial antiarrhythmic dose. ΔQTc was inversely related to baseline QTc and TpTe (p <0.01). After controlling for baseline QTc, there was no independent association between T-wave markers of repolarization heterogeneity and ΔQTc. In conclusion, for patients with paroxysmal atrial fibrillation admitted for dofetilide or sotalol loading, T-wave markers of increased repolarization heterogeneity are measurable within hours after initiation. A shorter baseline QTc is associated with an increased ΔQTc; however, there is no independent relation between baseline T-wave markers of repolarization heterogeneity and ΔQTc.
Atrial fibrillation (AF) is common and associated with increased morbidity, mortality, hospitalization, and economic cost. Selective class III antiarrhythmic drugs (AADs), dofetilide and sotalol, are used to maintain sinus rhythm for patients with AF and are associated with torsades de pointes (TdP) in the vulnerable patients because of increased repolarization heterogeneity. Many centers mandate inpatient class III AAD initiation and serial monitoring of the change in ΔQTc. The safety of these agents for maintenance of sinus rhythm in patients with paroxysmal AF without significant heart failure or coronary artery disease is poorly defined. Animal models have identified increased repolarization heterogeneity as a necessary substrate for class III AAD proarrhythmia, but human studies investigating electrocardiographic (ECG) markers of repolarization heterogeneity are lacking. T-wave markers may reflect repolarization heterogeneity better than QTc. The new ECG software has allowed automated quantification of QTc, peak to end of T wave (TpTe), and T-wave morphologic markers of repolarization heterogeneity. Among patients with paroxysmal AF presenting for maintenance of sinus rhythm, we sought to describe serial changes in QTc, TpTe, and T-wave morphologic markers of repolarization heterogeneity after successive initiation doses of dofetilide or sotalol and define their relation to ΔQTc.
Methods
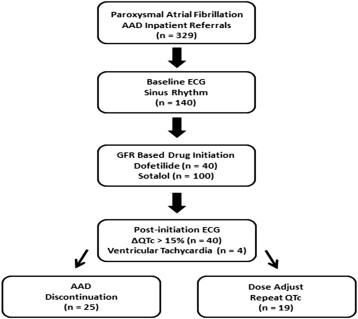
We performed a retrospective analysis of 140 inpatients with symptomatic paroxysmal AF referred for monitored class III AAD initiation (dofetilide or sotalol) at Northwestern Memorial Hospital (Chicago, Illinois) for the maintenance of sinus rhythm. We initially obtained data from 329 consecutive patients who were hospitalized for class III AAD initiation from September 2003 to July 2009. For the purposes of the present analysis, we excluded subjects who presented with baseline atrial arrhythmias leading to irregular RR intervals given the variable influence of irregular rhythms on T-wave markers of repolarization heterogeneity and the potential to confound accurate measurement of QTc and TpTe in these cases. Patients were monitored on continuous telemetry during 5 doses (to achieve a steady-state potency) of either dofetilide or sotalol. Serial QTc measurements were made after each dose of the AAD. The decision to initiate, adjust, and terminate drug initiation was at the discretion of the clinician caring for the patient, but initiation was not performed on any patients with a QTc >500 ms on baseline 12-lead electrocardiogram. Our inpatient protocol calls for cessation of drug loading if the QTc increases by >15% (despite dose adjustment), if at any time QTc is >500 ms, or if ventricular tachycardia (VT) or an increase in premature ventricular beat burden is observed on telemetry after initiating the drug ( Figure 1 ). VT was defined as ≥3 consecutive ventricular beats of >100 beats/min. Standard dosing for dofetilide is 500 μg twice daily for patients with glomerular filtration rate (GFR) >60 ml/min, 250 μg twice daily for patients with GFR 40 to 59 ml/min, and 125 μg twice daily for patients with GFR 20 to 39 ml/min. For patients with GFR <20 ml/min, dofetilide loading was not performed. Standard dosing for sotalol at our center is 80 mg twice daily for patients with GFR >60 ml/min and can be increased to 120 mg twice daily at the discretion of the clinician. Sotalol was generally avoided for patients with chronic kidney disease but can be dosed once daily for those with GFR 40 to 60 ml/min. The study protocol was approved by the Institutional Review Board at Northwestern University Feinberg School of Medicine.
We collected and analyzed the following clinical characteristics of the study participants: demographics, co-morbidities, medications, body mass index, and laboratory data (which included serum potassium, magnesium, and renal function). Estimated GFR was calculated using the Modification of Diet in Renal Disease equation.
Hypertension was defined by systolic blood pressure >140 mm Hg or diastolic blood pressure >90 mm Hg, physician-documented history of hypertension, or use of antihypertensive medications. Coronary artery disease was defined by the presence of physician-documented history of coronary artery disease, known coronary stenosis >50%, history of myocardial infarction, percutaneous intervention, coronary artery bypass grafting, or abnormal stress test result consistent with myocardial ischemia. Diabetes mellitus was defined by the presence of physician-documented history of diabetes or use of oral hypoglycemic agents or insulin for the treatment of hyperglycemia. Heart failure was defined by a physician-documented history of cardiomyopathy or previous treatment for heart failure.
All subjects underwent a baseline 12-lead ECG recording (Marquette MAC 5000 Resting ECG System; GE Healthcare, Wauwatosa, Wisconsin) and a repeat electrocardiography performed 2 hours after each successive dose of either dofetilide or sotalol. We used an automated and previously validated method of analysis using standard 12-lead ECG tracings at 25 mm/s speed and 10 mm/mV amplitude. J points, T-wave end points, averaged RR intervals, and global QT intervals were measured using the most recent version of the 12SL software algorithm (12SL; GE Healthcare, Milwaukee, Wisconsin). A previously described linear baseline correction from J point to T-wave end point allows automated measurement of T-wave onset, offset, and T-wave peak (defined as the absolute maximum of the T wave). The QT intervals were corrected using the Fridericia standardization formula (QTcF = QT/RR 1/3 ). TpTe was measured from the peak of the T wave to the end of the T wave, an approach that has been described in other studies. The advanced T-wave morphology quantification methods (using the QT Guard Plus software; GE Healthcare, Milwaukee, Wisconsin) have been described in detail previously and have been shown to be independent of heart rate. The notching (reflecting size of visible T-wave notches), asymmetry (evaluating variance in slope profile and duration of the ascending and descending T-wave limbs), and flatness (based on the degree of kurtosis, a statistical method for describing peakedness of a probability distribution) scores are dimensionless and together are encapsulated by the dimensionless morphology combination score (MCS), which is calculated using a weighted formula (MCS = 1 × asym + 1.9 × notch + 1.6 × flat).
Clinical characteristics, laboratory, and ECG data are summarized and displayed for the entire cohort. The Student t test or analysis of variance test for independent samples was used to determine differences between baseline ECG markers and subsequent postinitiation electrocardiogram in the normally distributed data. The Wilcoxon rank-sum test or Kruskal-Wallis test was used to compare similarly skewed groups that did not meet normality criteria. We performed unadjusted linear regression analyses to determine whether baseline QTc, TpTe, T-wave notching, T-wave asymmetry, T-wave flatness, or T-wave MCS was associated with change in QTc (ΔQTc) between baseline and subsequent doses. We performed unadjusted logistic regression analyses to determine whether baseline QTc, TpTe, or T-wave MCS was associated with drug dose reduction, discontinuation, or acquired QTc ≥500 ms. All statistical analyses were performed using Stata, version 10.1 (StataCorp, College Station, Texas).
Results
In a sample of 140 consecutive patients with paroxysmal AF referred for dofetilide or sotalol loading to maintain sinus rhythm, co-morbidities were common among the subjects ( Table 1 ). No significant baseline ECG differences were observed between patients receiving dofetilide or sotalol ( Table 2 ). ECG changes observed after the first loading dose are summarized in Table 3 . There were no sudden death events, and only 4 subjects had nonsustained VT (none of which were consistent with TdP or required defibrillator therapy), whereas 29% (40 of 140) had QT prolongation identified as the drug toxicity (prompting discontinuation or dose reduction). When stratified by dosing outcome, baseline ECG parameters were similar, although QTc was greater in those who ultimately required dose decrease or discontinuation ( Table 4 ). For every SD increase in baseline QTc, the odds ratio for dose change or discontinuation was 1.6 (p = 0.008, 95% confidence interval 1.1 to 2.4). Those with acquired QT ≥500 ms during drug initiation were likely to have a greater baseline QRS and QTc, with a nonsignificant increase in the MCS ( Table 5 ). Logistic regression demonstrated that for every SD increase in QTc, the odds ratio was 3.2 (p <0.001, 95% confidence interval 1.7 to 6.2) for developing a QTc ≥500 ms after drug initiation (after adjusting for QRS interval and MCS).
| Characteristic | All Patients (N = 140) |
|---|---|
| Age (years) | 61 ± 14 |
| Women | 47 (34%) |
| Body-mass index (kg/m 2 ) | 29 ± 6 |
| Ejection fraction (%) | 55 ± 13 |
| Hypertension | 73 (52%) |
| Coronary artery disease | 29 (21%) |
| Diabetes mellitus | 19 (14%) |
| Dyslipidemia ∗ | 72 (51%) |
| Heart failure | 18 (13%) |
| Serum potassium (mEq/L) | 4.0 ± 0.4 |
| Serum magnesium (mEq/L) | 2.1 ± 0.2 |
| Glomerular filtration rate (ml/min/1.73 m 2 ) | 80 ± 21 |
| Medications | |
| Beta-blocker | 98 (70%) |
| Statin | 71 (51%) |
| Angiotensin converting enzyme inhibitor or angiotensin receptor blocker | 61 (44%) |
| Calcium channel blocker | 33 (24%) |
| Digoxin | 24 (17%) |
| Thiazide diuretic | 18 (13%) |
| Loop diuretic | 17 (12%) |
| Aldosterone antagonist | 7 (5%) |
∗ Dyslipidemia is defined as a documented history of requiring a cholesterol medication or a documented history of a cholesterol abnormality.
| Parameter | All Patients (N = 140) | Dofetilide (N = 40) | Sotalol (N = 100) |
|---|---|---|---|
| Heart rate (bpm) | 65 ± 13 | 66 ± 15 | 65 ± 13 |
| Heart rate range (bpm) | 45-108 | 48-98 | 45-108 |
| Electrocardiography | |||
| QRS interval (ms) | 100 ± 25 | 101 ± 29 | 100 ± 23 |
| QT interval (ms) | 419 ± 39 | 419 ± 40 | 419 ± 39 |
| QTc (ms) | 427 ± 31 | 429 ± 32 | 427 ± 30 |
| QRS axis (degrees) | 22 ± 51 | 21 ± 49 | 23 ± 53 |
| T wave axis (degrees) | 50 ± 49 | 49 ± 46 | 51 ± 50 |
| T wave parameters | |||
| Peak-to-end of T wave (ms) | 105 ± 15 | 103 ± 16 | 105 ± 15 |
| Asymmetry (dimensionless) | 0.13 ± 0.15 | 0.14 ± 0.14 | 0.13 ± 0.15 |
| Flatness (dimensionless) | 0.42 ± 0.10 | 0.40 ± 0.08 | 0.42 ± 0.11 |
| Notching (dimensionless) | 0.05 ± 0.21 | 0.03 ± 0.16 | 0.06 ± 0.23 |
| Morphology combination score | 0.85 ± 0.41 | 0.81 ± 0.31 | 0.87 ± 0.45 |
| Parameter | All Patients (N = 140) | Dofetilide (N = 40) | Sotalol (N = 100) |
|---|---|---|---|
| Total daily dose (mg) | 0.86 ± 0.25 | 156 ± 40 | |
| Heart rate (bpm) | 62 ± 12 | 62 ± 12 | 61 ± 12 |
| Electrocardiography | |||
| QRS interval (ms) | 100 ± 24 | 104 ± 28 | 98 ± 22 |
| QT interval (ms) | 446 ± 44 ∗ | 457 ± 42 ∗ , † | 441 ± 45 ∗ , † |
| QTc (ms) | 445 ± 33 ∗ | 456 ± 32 ∗ , † | 441 ± 33 ∗ , † |
| Change in QTc (ms) | 19 ± 30 | 27 ± 26 ‡ | 15 ± 31 ‡ |
| QRS axis (degrees) | 14 ± 43 | 18 ± 49 | 13 ± 39 |
| T wave axis (degrees) | 47 ± 47 | 53 ± 39 | 45 ± 50 |
| T wave parameters | |||
| Peak to end of T wave (ms) | 110 ± 24 | 112 ± 26 ∗ | 109 ± 23 |
| Asymmetry (dimensionless) | 0.21 ± 0.23 ∗ | 0.23 ± 0.25 ∗ | 0.20 ± 0.23 ∗ |
| Flatness (dimensionless) | 0.48 ± 0.10 ∗ | 0.49 ± 0.09 ∗ | 0.47 ± 0.10 ∗ |
| Notching (dimensionless) | 0.09 ± 0.23 | 0.08 ± 0.22 | 0.09 ± 0.24 |
| Morphology combination score | 1.06 ± 0.49 ∗ | 1.10 ± 0.49 ∗ | 1.05 ± 0.50 ∗ |
∗ p <0.01 compared to baseline ECG.
† p = 0.021 for dofetilide vs sotalol.
| Parameter | Completed (N = 96) | Dose Decreased (N = 19) | Discontinued (N = 25) |
|---|---|---|---|
| Heart rate (bpm) | 65 ± 14 | 64 ± 13 | 66 ± 12 |
| Electrocardiography | |||
| QRS interval (ms) | 98 ± 23 | 102 ± 28 | 104 ± 29 |
| QT interval (ms) | 415 ± 40 | 435 ± 33 | 425 ± 40 |
| QTc (ms) | 422 ± 28 ∗ | 442 ± 29 ∗ | 436 ± 38 ∗ |
| QRS axis (degrees) | 24 ± 51 | 23 ± 37 | 6 ± 49 |
| T wave axis (degrees) | 54 ± 52 | 48 ± 37 | 38 ± 45 |
| T wave parameters | |||
| Peak to end of T wave (ms) | 104 ± 14 | 109 ± 14 | 107 ± 18 |
| Morphology combination score | 0.86 ± 0.43 | 0.89 ± 0.54 | 0.79 ± 0.17 |
Stay updated, free articles. Join our Telegram channel

Full access? Get Clinical Tree


