Bicuspid aortic valve (BAV) is frequently associated with aortic wall abnormalities, including dilation of the ascending aorta and even dissection. We propose 2 new indexes of aortic wall biophysical properties, the maximum rates of systolic distension and diastolic recoil (MRSD and MRDR, respectively), in patients with BAV and matched control subjects. We evaluated 53 consecutive young patients with BAV (36 males, mean age 16 ± 4 years) with mild aortic valve disease and a control group of 22 age- and gender-matched healthy volunteers. All subjects underwent a cardiac magnetic resonance imaging study that included phase velocity mapping and cine acquisition at several aortic levels. The MRSD and MRDR were measured in the ascending aorta in both patients with BAV and controls. Of the 53 patients with BAV, 26 had enlarged ascending aortas (dilated BAV), and 27 had a normal aortic diameter (nondilated BAV). Compared to controls, the MRSD was significantly lower in the whole BAV group (4.37 ± 1.1 vs 9.1 ± 2.1), in patients with dilated BAV (4.5 ± 1.1 p <0.0001), and in those with nondilated BAV (4.3 ± 1.0, p <0.0001). The MRDR was greater in the whole BAV group (−4 ± 1.2 vs −7.6 ± 2.7, p <0.0001), in the dilated BAV group (−3.9 ± 1.3, p <0.0001), and in the nondilated BAV group (−4.1 ± 1.2, p <0.0001). A receiver operating characteristic curve analysis of MRSD distinguished BAV from controls with 100% sensitivity and 95% specificity. In conclusion, MRSD and MRDR were slower in the patients with BAV than in the controls, regardless of the dimensions of the ascending aorta.
We propose 2 new magnetic resonance imaging (MRI) indexes of aortic elastic properties: the maximum rate of systolic distension (MRSD) and the maximum rate of diastolic recoil (MRDR). These indexes assess the velocities of aortic wall distension and recoil during the cardiac cycle. The purpose of the present study was to test these indexes in both patients with bicuspid aortic valve (BAV) and healthy controls and compare them with the other aortic wall biophysical property indexes currently available.
Methods
We enrolled 63 consecutive patients aged 8 to 25 years with a confirmed diagnosis of BAV. All patients underwent a comprehensive cardiac MRI study. Of the 63 patients, 10 were excluded from the analysis after the MRI examination because of significant aortic valve disease. Our final study population consisted of 53 patients (36 males; mean age 16 ± 4 years) with BAV and without significant aortic valve dysfunction. A total of 22 age- and gender-matched healthy volunteers (17 males; mean age 16 ± 4 years) were enrolled as controls. The patients with BAV were subdivided into 2 groups according to the ascending aortic diameter. The dilated BAV group consisted of patients with an ascending aortic diameter 2 SD greater than the average diameter of the control group, and the nondilated BAV group consisted of patients with a diameter ≤2 SD greater than the control group average.
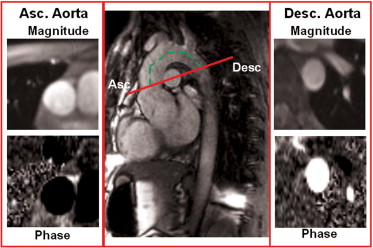
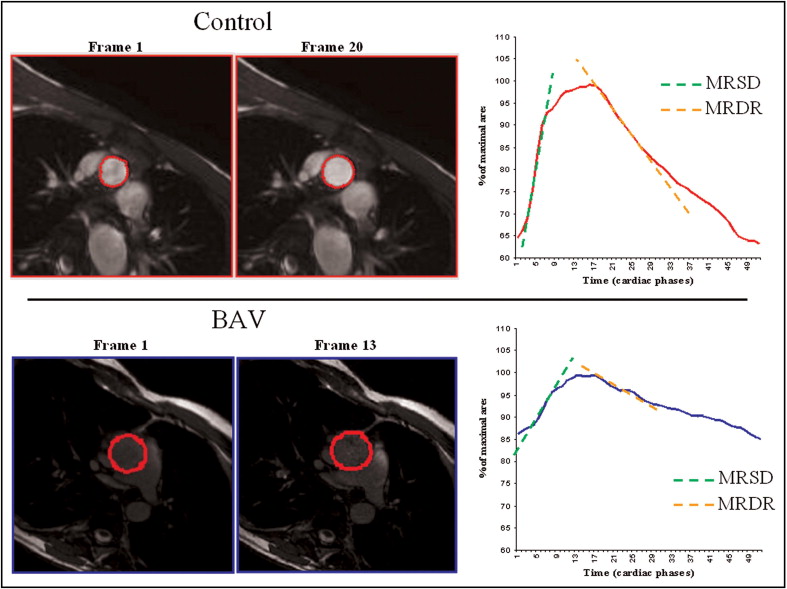
The MRI studies were performed using a 1.5 T Signa CV/I MRI scanner (GE, Milwaukee, Wisconsin) using an 8-channel cardiac phased array coil. The thoracic aorta was visualized by acquiring sagittal-oblique cine images parallel to the major aortic axis using a breath-hold, electrocardiographic-triggered, steady-state free-precession (SSFP) pulse sequence with the following parameters: 400-mm field of view, 8-mm slice thickness, no gap, 1 number of excitations, 12 views per segment, echo time/repetition time 1.6/3.2 ms, flip angle 45°, matrix 224 × 224, and reconstruction matrix 256 × 256. The number of cardiac phases was set according to the heart rate to obtain an aortic wall excursion temporal resolution of approximately 10 −3 seconds. Cross-sectional cine SSFP images with the same parameters were acquired at different aortic levels: (1) at the aortic valve plane to confirm the diagnosis of BAV; (2) at the aortic root; (3) at the sinotubular junction; (4) at the proximal ascending aorta (5 mm above the sinotubular junction) to measure the distensibility, MRSD, and MRDR; and (5) at the level of the maximum diameter of the ascending aorta. The left ventricular volumes and mass were obtained using the conventional approach. A gradient-echo velocity mapping electrocardiographic-triggered sequence (phase velocity cine-MRI) was used to determine the blood flow and regurgitation volume. The through-plane flow was measured orthogonal to the vessels in the ascending aorta (5 mm over the sinotubular junction) and in the descending aorta ( Figure 1 ). The following acquisition parameters were used: repetition time/echo time 12/5 ms, 20° flip angle, field of view 30, phase field of view 1, 192 × 192 matrix, 256 × 256 reconstruction matrix, 5-mm slice thickness, 1 excitation, 2 views per segment, and encoded velocity 250 cm/s. The number of cardiac phases was set according to the heart rate, as above. The systemic arterial pressure was noninvasively measured with an automatic manometer at the brachial artery level at each acquisition. The SSFP and phase velocity cine-MRI imaging sequences for the assessment of ventricular function, flow, and wall excursion were elaborated with commercially available software (Mass Plus and CV Flow, Leiden, The Netherlands). The diameters of the aortic root, sinotubular junction, and ascending aorta (at the maximum dimension level) were measured from the cine SSFP images. The flow through the aortic valve and the ascending and descending aorta was measured as described in a previous study. The blood flow was calculated as the product of the aortic cross-sectional area and mean flow velocity for each cardiac phase. A volume/time curve was obtained for each section (aortic valve and ascending and descending aorta). The anterograde flow was measured as the area under the positive component of the curve, and the retrograde flow was the area under the negative component. The aortic regurgitation fraction was calculated at the level of the aortic valve plane as follows: retrograde flow/anterograde flow × 100, expressed as a percentage. The flow wave velocity propagation was defined as the time delay of the flow between the descending and ascending aorta ( Figure 1 ) and was measured as previously reported. Aortic wall distensibility in the ascending aorta was measured on the SSFP images, using a method described in previous studies. In brief, aortic wall distensibility was then measured as (A max − A min)/[A min × (SP − DP)], where A max is the maximum (systolic) cross-sectional aortic area (in mm 2 ), A min is the minimum (diastolic) cross-sectional aortic area (in mm 2 ), SP is the systolic blood pressure (in mm Hg), and DP is the diastolic blood pressure (in mm Hg). We also defined MRSD and MRDR, 2 new indexes that describe the elastic properties of the aortic wall using cine-MRI in the ascending aorta. In brief, the cross-sectional area of the proximal ascending aorta (5 mm above the sinotubular junction) measured in each cardiac phase was indexed for the maximum end-systolic cross-sectional area and plotted against the time (relative cross-sectional area/time curve; Figure 2 ). In this curve, MRSD, the maximum rate of systolic distension of the ascending aorta cross-sectional area, was measured as the maximum systolic upslope, and MRDR, the maximum rate of diastolic recoil, was measured as the maximum diastolic downslope. The MRSD and MRDR were expressed as the percentile of the maximum area/10 −3 seconds. The systemic vascular resistance was calculated using the cardiac output measured by phase velocity cine-MRI in the ascending aorta and the mean arterial pressure, assuming a right atrial pressure of 5 mm Hg in all patients. The measurement of aortic wall indexes was performed by 3 blinded expert investigators who were unaware of the clinical information of the patients and the presence of BAV.
The values are expressed as the mean ± SD (for normal distribution) or median and 25th to 75th percentile. The group means of numerical data were analyzed using a 2-sample Student’s t test. Differences among the groups were analyzed using analysis of variance and Bonferroni tests, when appropriate. A simple linear correlation with Pearson’s coefficient (r) was used to correlate the MRSD and MRDR with the cross-sectional area and systemic vascular resistance. A receiver operating characteristic analysis was used to compare the specificity and sensitivity of the aortic wall indexes to distinguish between BAV and controls. Observer agreement was quantified by using intraclass correlation coefficients.
Results
In 27 patients with BAV (17 males; the nondilated BAV group), the ascending aorta diameters were not significantly different from those of the healthy controls. In the remaining 26 patients with BAV (19 males; the dilated BAV group), the ascending aorta diameter was greater than the range measured in the controls (greater than the mean + 2 SD; Table 1 ). No significant differences were found in the left ventricle volumes and ejection fraction ( Table 1 ) or the systemic vascular resistance (14.07 ± 4.3 vs 12.6 ± 5.8 Wood units, p = NS) in the patients with BAV and the controls. Figure 3 shows that the ascending aorta wall distensibility was significantly lower in those with BAV than in the controls ( Table 2 ). Both groups of patients with BAV (dilated and nondilated BAV) had lower wall distensibility than did the controls. Flow wave propagation was significantly faster in the patients with BAV than in the controls (1.8 ± 0.75 vs 1.26 ± 0.4. mm/ms, p <0.05), although the overlap was considerable ( Figure 3 ). The patients with BAV had lower MRSD (p <0.0001) than the controls ( Table 2 ). The box-and-whisker plot in Figure 4 shows that only 1 healthy patient had an MRSD within the range of values found in the patients with BAV. No significant gender differences were found for MRSD in the controls (8.6 ± 2 vs 10 ± 2.5, male vs female, p = 0.21) or in those with BAV (4.2 ± 1.1 vs 4.6 ± 1.1, male vs female, p = 0.76). Both BAV groups (dilated and nondilated) had similar MRSD when evaluated separately; both were significantly lower than the MRSD in normal patients. The MRSD did not correlate with the systemic vascular resistance (p = 0.79). Similar results were found for MRDR. The patients with BAV had greater MRDR (greater values are less negative, indicating a slower rate) than the controls (p <0.0001; Figure 5 ). No significant gender differences were found for MRDR in the controls (−7.2 ± 3.5 vs −7.9 ± 2.4, male vs female, p = 0.47) or in those with BAV (−3.7 ± 1.3 vs 4.3 ± 0.9, male vs female, p = 0.18). The MRDR was significantly greater in both BAV groups (nondilated and dilated) than in the healthy subjects. As with the MRSD, the MRDR did not correlate with systemic vascular resistance (p = 0.98). Receiver operating characteristic curve analysis showed that MRSD values >6.6 distinguished between those with BAV and the controls, with 100% sensitivity and 95% specificity. MRDRs with a cutoff of −4.8 identified patients with BAV, with 71.4% sensitivity and 90.9% specificity. Ascending aorta distensibility distinguished between the patients with BAV and controls (cutoff of 5.7), with 98% specificity and 40% sensitivity. Finally, flow wave propagation showed 71.8% specificity and 69.7% sensitivity. The receiver operating characteristic curves for MRSD and MRDR had a significantly greater area under the curve (AUC) compared to the ascending and descending aorta distensibility and flow wave velocity propagation ( Table 3 ).
| Variable | BAV | Nondilated BAV | Dilated BAV | Control | p Value | ||
|---|---|---|---|---|---|---|---|
| BAV vs Control | Nondilated BAV vs Control | Dilated BAV vs Control | |||||
| Patients (n) | 53 | 26 | 27 | 22 | |||
| Males (n) | 36 | 17 | 19 | 17 | 0.41 | 1 | 0.44 |
| Age (years) | 16 ± 4 | 15 ± 4 | 19 ± 4 | 16 ± 4 | 0.9 | 0.39 | 0.012 |
| Body surface area (m 2 ) | 1.63 ± 0.3 | 1.51 ± 0.26 | 1.76 ± 0.2 | 1.62 ± 0.23 | 0.88 | 0.12 | 0.03 |
| Diameter | |||||||
| Aortic root | 31.6 ± 5.5 | 30 ± 5.2 | 34 ± 5.7 | 29 ± 5.7 | 0.16 | 0.34 | 0.03 |
| Aortic junction | 28.2 ± 5.3 | 24.1 ± 4.3 | 31.2 ± 4.3 | 22 ± 5.3 | 0.0002 | 0.13 | <0.0001 |
| Ascending aorta | 30.9 ± 6.8 | 24.3 ± 5.1 | 35.3 ± 5.3 | 23.8 ± 3.7 | 0.0002 | 0.6 | <0.0001 |
| End-diastolic volume index (ml/m 2 ) | 92 ± 20 | 87 ± 21 | 96 ± 17 | 87 ± 15 | 0.38 | 0.99 | 0.06 |
| End-systolic volume index (ml/m 2 ) | 32 ± 12 | 29 ± 11 | 34 ± 12 | 31 ± 11 | 0.96 | 0.53 | 0.37 |
| Ejection fraction (%) | 67 ± 6 | 69 ± 7 | 66 ± 6 | 66 ± 6 | 0.57 | 0.12 | 0.99 |
| Mass index (g/m 2 ) | 74 ± 14 | 71 ± 14 | 76.5 ± 15 | 70 ± 12 | 0.39 | 0.35 | 0.9 |
Stay updated, free articles. Join our Telegram channel

Full access? Get Clinical Tree


