The combination of fibrate and statin therapies may be a treatment option for women with multiple lipid abnormalities. We, therefore, initiated the present safety and efficacy analysis to address the paucity of such data in women with mixed dyslipidemia. A total of 1,393 women with mixed dyslipidemia (low-density lipoprotein [LDL] cholesterol ≥130 mg/dl, triglycerides [TG] ≥150 mg/dl, high-density lipoprotein [HDL] cholesterol <50 mg/dl), who had enrolled in any 1 of 3 randomized clinical trials, were evaluated. The eligible women were randomized to receive fenofibric acid plus a low- or moderate-dose statin (combination treatment); or low-, moderate-, or high-dose statin monotherapy; or fenofibric acid monotherapy. With low-dose combination treatment, the baseline HDL cholesterol level increased 20% and TG decreased 46% compared to an 8% HDL cholesterol increase and 20% TG decrease with low-dose statins alone. With the moderate-dose combination, the baseline HDL cholesterol increased 21% and TG decreased 44% compared to an 8% HDL cholesterol increase and 26% TG decrease with moderate-dose statins alone. The reduction in baseline LDL cholesterol with low-dose and moderate-dose combinations (37% and 39%, respectively) was comparable to the reduction with corresponding-dose statins (36% and 43%, respectively). High-dose statins decreased the baseline LDL cholesterol 47%; however, the increase in HDL cholesterol (9%) and decrease in TG (25%) were similar to the changes observed with lower doses of statins. The safety profiles of the combinations were comparable to those of the component therapies. In conclusion, these data suggest that a combination of fenofibric acid and a statin could be considered safe and efficacious for treating women with mixed dyslipidemia.
The pharmacologic reduction of low-density lipoprotein (LDL) cholesterol with statins reduces the risk of cardiovascular disease, the leading cause of death among women in the United States. Relatively few data from controlled trials have described the effectiveness of nonstatin medications in reducing the risk of cardiovascular disease in women. The Action to Control Cardiovascular Risk in Diabetes (ACCORD) study observed an 8% relative reduction in major cardiovascular events with fenofibrate plus simvastatin versus simvastatin alone (p = 0.32) but found a significant interaction (p = 0.01 for the interaction) between treatment and gender among patients with type 2 diabetes mellitus. A possibility was found of an increased risk in women treated with the simvastatin/fenofibrate combination that was not observed in the men. However, such an interaction was not observed in the subgroup of patients in the ACCORD study with dyslipidemia, in which a 31% risk reduction (p = 0.057 for the interaction) was observed with fenofibrate plus simvastatin compared to simvastatin monotherapy. Consistently, combination therapy with a statin and a fibrate has been shown to be effective for treating multiple lipids beyond LDL cholesterol in patients with mixed dyslipidemia. The objective of the present post hoc subgroup analysis was to evaluate the effects of fenofibric acid co-administered with low- or moderate-dose statins (e.g., simvastatin, rosuvastatin, and atorvastatin) in women.
Methods
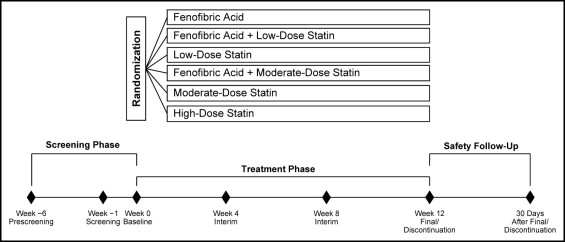
The study population for the present analysis included nonpregnant women aged ≥18 years with mixed dyslipidemia, defined as triglycerides (TG) ≥150 mg/dl, high-density lipoprotein (HDL) cholesterol <50 mg/dl, and LDL cholesterol ≥130 mg/dl after a 6-week washout of lipid-altering medications. The full inclusion/exclusion criteria have been previously described. The data for the present analysis of women were pooled from 3 similarly designed, large, multicenter, randomized, double-blind, controlled studies that evaluated fenofibric acid (Trilipix, Abbott, North Chicago, Illinois) 135 mg combined with rosuvastatin, simvastatin, or atorvastatin. Each study had a 6-week screening/washout period, a 12-week treatment period, and a 30-day safety follow-up period. Randomization was stratified by diabetic status (with vs without type 2 diabetes mellitus) and screening TG level (≤250 vs >250 mg/dl). Patients were assigned in a 2:2:2:2:2:1 ratio to randomized treatment with fenofibric acid; low-dose statin (rosuvastatin 10 mg, simvastatin 20 mg, or atorvastatin 20 mg); fenofibric acid plus low-dose-statin; moderate-dose statin (rosuvastatin 20 mg, simvastatin 40 mg, or atorvastatin 40 mg); fenofibric acid plus moderate-dose-statin; or high-dose statin (rosuvastatin 40 mg, simvastatin 80 mg, or atorvastatin 80 mg; Figure 1 ). In each study, 1/2 as many patients were enrolled in the high-dose statin group as in the other treatment groups, according to the regulatory guidance, because this group was primarily for the safety comparison and not used for the lipid efficacy statistical comparisons. The planned sample size of the fenofibric acid plus rosuvastatin study was designed to be approximately twice that of the fenofibric acid plus simvastatin or atorvastatin studies. The institutional review boards at the participating sites approved all the studies, and all patients gave informed consent.
The baseline characteristics were compared among treatment groups using a one-way analysis of variance (continuous variables) or chi-square test (categorical variables). The data from the corresponding dose groups in the 3 studies were pooled to provide a broader and more robust efficacy and safety assessment of fenofibric acid plus statin therapy. Comparisons of the percentage change from baseline to the final visit (12 weeks) in all efficacy parameters were made between each combination therapy group and the corresponding monotherapy groups, as previously described. All women with both a baseline and ≥1 postbaseline value were included in the efficacy analyses. Missing postbaseline values were imputed using the last observation carried forward method. Adverse events were assessed and recorded at each visit and coded using the Medical Dictionary for Regulatory Activities . Adverse events and laboratory measurements occurring through 30 days after the last dose of the study drug were included in the analyses.
Results
The overall population included 1,393 women (51.6%), who were randomly assigned to treatment and had received ≥1 dose of the study drug. We report the results for the subgroup of female patients. The baseline demographic and clinical characteristics are listed in Table 1 . The baseline lipid data are shown in Figures 2 and 3 . At baseline, the concomitant diabetic and hormone replacement medications reported for ≥2% of women enrolled included the diabetes therapies metformin (12%), rosiglitazone (3%), pioglitazone (3%), and glipizide (3%) and the hormone replacement therapy estradiol (2%). The mean ± SD age of the women was 56.5 ± 10.32 years. All baseline demographic, clinical characteristics, lipid values, and use of diabetic medications at baseline were comparable among the treatment groups.
| Characteristic | Fenofibric Acid (n = 277) | Low-Dose Statin (n = 234) | Fenofibric Acid Plus Low-Dose Statin (n = 263) | Moderate-Dose Statin (n = 245) | Fenofibric Acid Plus Moderate-Dose Statin (n = 249) | High-Dose Statin (n = 125) |
|---|---|---|---|---|---|---|
| Age (years) | ||||||
| Mean ± SD ⁎ | 56.3 ± 10.8 | 55.8 ± 9.8 | 58.4 ± 9.6 | 56.3 ± 10.3 | 55.5 ± 11 | 57.0 ± 9.9 |
| <65 years | 217 (78%) | 194 (83%) | 197 (75%) | 195 (80%) | 190 (76%) | 96 (77%) |
| ≥65 years | 60 (22%) | 40 (17%) | 66 (25%) | 50 (20%) | 59 (24%) | 29 (23%) |
| Race | ||||||
| White | 263 (95%) | 224 (96%) | 236 (90%) | 227 (93%) | 227 (91%) | 115 (92%) |
| Black | 7 (3%) | 7 (3%) | 17 (7%) | 12 (5%) | 14 (6%) | 8 (6%) |
| Other | 7 (3%) | 3 (1%) | 10 (4%) | 6 (2%) | 8 (3%) | 2 (2%) |
| Weight (kg) | ||||||
| Mean (SD) | 84.6 (18.6) | 85.9 (19.2) | 84.6 (17.9) | 85.5 (19.7) | 86.2 (19.8) | 86.6 (20) |
| <70 kg | 59 (21%) | 46 (20%) | 59 (22%) | 49 (20%) | 49 (20%) | 29 (23%) |
| ≥70 kg | 218 (79%) | 188 (80%) | 204 (78%) | 196 (80%) | 200 (80%) | 96 (77%) |
| Body mass index † (kg/m 2 ) | 32.1 ± 6.6 | 32.4 ± 6.8 | 32.2 ± 6.5 | 32.5 ± 7.2 | 33.0 ± 7.5 | 32.6 ± 6.3 |
| Waist ‡ (cm) | 99.8 ± 13.6 | 99.3 ± 13.7 | 100.5 ± 14.8 | 99.6 ± 14.8 | 100.9 ± 15.1 | 101.0 ± 14.1 |
| Nicotine user | 57 (21%) | 42 (18%) | 52 (20%) | 48 (20%) | 44 (18%) | 30 (24%) |
| Alcohol drinker | 130 (47%) | 103 (44%) | 118 (45%) | 101 (41%) | 107 (43%) | 55 (44%) |
| Coronary artery disease | 10 (4%) | 7 (3%) | 11 (4%) | 22 (9%) | 13 (5%) | 1 (1%) |
| Hypertension | 150 (54%) | 115 (49%) | 164 (62%) | 132 (54%) | 131 (53%) | 65 (52%) |
| Framingham risk category | ||||||
| High | 75 (27%) | 61 (26%) | 82 (31%) | 77 (31%) | 86 (35%) | 44 (35%) |
| Moderate | 121 (44%) | 99 (42%) | 125 (48%) | 100 (41%) | 96 (39%) | 46 (37%) |
| Low | 81 (29%) | 74 (32%) | 56 (21%) | 68 (28%) | 67 (27%) | 35 (28%) |
| Diabetes mellitus | 54 (20%) | 56 (24%) | 61 (23%) | 52 (21%) | 62 (25%) | 35 (28%) |
| Metabolic syndrome | 197 (71%) | 160 (68%) | 199 (76%) | 182 (74%) | 179 (72%) | 93 (74%) |
| Concomitant medications | ||||||
| Diabetes medication | 49 (18%) | 45 (19%) | 48 (18%) | 43 (18%) | 49 (20%) | 25 (20%) |
| Hormone replacement | 19 (7%) | 8 (3%) | 15 (6%) | 16 (7%) | 17 (7%) | 3 (2%) |
⁎ Statistically significant difference among treatment groups from one-way analysis of variance (p = 0.023).
† Patient numbers less than total patient numbers for each treatment group by 4–13 patients.
‡ Patient numbers less than total patient numbers for each treatment group by 0–5 patients.
The percentage change from baseline to the final visit in lipid variables for women with mixed dyslipidemia treated with fenofibric acid plus low- or moderate-dose statin are shown in Figures 2 and 3 (primary variables) and listed in Table 2 (secondary variables). Compared with low-dose statin monotherapy, combination fenofibric acid plus low-dose statin treatment resulted in a significantly greater mean percentage increase from baseline in HDL cholesterol and a significantly greater mean percentage decrease in TG, non-HDL cholesterol, very low-density lipoprotein (VLDL) cholesterol, total cholesterol, and apolipoprotein B. The mean percentage decrease in LDL cholesterol and the median percentage decrease in high-sensitivity C-reactive protein achieved with fenofibric acid plus low-dose statin versus low-dose statin monotherapy was similar.
| Parameter | Fenofibric Acid | Low-Dose Statin | Fenofibric Acid Plus Low-Dose Statin | Moderate-Dose Statin | Fenofibric Acid Plus Moderate-Dose Statin | High-Dose Statin |
|---|---|---|---|---|---|---|
| Non–high-density lipoprotein cholesterol | ||||||
| Patients (n) | 233 | 215 | 226 | 210 | 212 | 109 |
| Baseline mean (mg/dl) | 226.8 | 221.4 | 225.9 | 224.6 | 223.0 | 226.9 |
| Mean percentage change | −22.1 ± 1.0% | −37.3 ± 1.1% | −43.7 ± 1.0% | −43.6 ± 1.1% | −45.9 ± 1.1% | −46.2 ± 1.5% |
| p Value | <0.001 ⁎ | 0.127 † | ||||
| Very low-density lipoprotein cholesterol | ||||||
| Patients (n) | 250 | 221 | 240 | 225 | 224 | 117 |
| Baseline mean (mg/dl) | 65.0 | 64.2 | 64.9 | 65.6 | 62.5 | 63.6 |
| Mean percentage change | −39.8 ± 2.8% | −32.0 ± 2.9% | −49.9 ± 2.8% | −38.4 ± 2.9% | −52.6 ± 2.9% | −36.7 ± 4.0% |
| p Value | <0.001 ⁎ | <0.001 † | ||||
| Total cholesterol | ||||||
| Patients (n) | 256 | 226 | 252 | 234 | 233 | 118 |
| Baseline mean (mg/dl) | 266.7 | 263.9 | 267.1 | 266.9 | 264.5 | 268.8 |
| Mean percentage change | −16.2 ± 0.8% | −30.0 ± 0.9% | −33.5 ± 0.8% | −35.0 ± 0.9% | −35.5 ± 0.9% | −38.5 ± 1.2% |
| p Value | 0.003 ⁎ | 0.727 † | ||||
| Apolipoprotein B | ||||||
| Patients (n) | 254 | 223 | 249 | 232 | 231 | 116 |
| Baseline mean (mg/dl) | 148.2 | 147.2 | 149.5 | 149.1 | 148.7 | 151.4 |
| Mean percentage change | −21.3 ± 1.0% | −32.7 ± 1.1% | −39.4 ± 1.0% | −37.3 ± 1.1% | −40.5 ± 1.1% | −42.2 ± 1.5% |
| p Value | <0.001 ⁎ | 0.026 † | ||||
| High-sensitivity C-reactive protein | ||||||
| Patients (n) | 255 | 224 | 250 | 233 | 231 | 117 |
| Baseline median (mg/L) | 3.68 | 3.59 | 4.44 | 3.89 | 3.93 | 3.70 |
| Median percentage change | −15.7% (−44.7%, 21.4%) | −23.7% (−46.5%, 8.9%) | −33.5% (−51.7%, −6.9%) | −28.9% (−52.6%, −3.7%) | −39.0% (−57.6%, −14.8%) | −28.5% (−59.1%, −3.7%) |
| p Value | 0.051 † ⁎ | 0.020 † |
⁎ Fenofibric acid plus low-dose statin versus low-dose statin monotherapy.
† Fenofibric acid plus moderate-dose statin versus moderate-dose statin monotherapy.
Compared with moderate-dose statin monotherapy, combination fenofibric acid plus moderate-dose statin treatment resulted in a significantly greater mean percentage increase in HDL cholesterol, a significantly greater mean percentage decrease in TG, VLDL cholesterol, and apolipoprotein B, and a median percentage decrease in high-sensitivity C-reactive protein. The mean percentage decrease in non-HDL cholesterol and total cholesterol were not significantly different for combination fenofibric acid plus moderate-dose statin treatment versus moderate-dose statin monotherapy. The mean percentage decrease in LDL cholesterol was less with fenofibric acid plus moderate-dose statin than with moderate-dose statin monotherapy; however, a statistically significant mean percentage decrease in LDL cholesterol was noted for the combination compared with fenofibric acid monotherapy.
The adverse events are listed in Table 3 . One woman in the fenofibric acid monotherapy group died during the conduct of the study from septic shock. One woman in the high-dose statin group died from an injury. Both deaths were determined to be not related to the study drug.
| Adverse Events | Fenofibric Acid (n = 277) | Low-Dose Statin (n = 234) | Fenofibric Acid Plus Low-Dose Statin (n = 263) | Moderate-Dose Statin (n = 245) | Fenofibric Acid Plus Moderate-Dose Statin (n = 249) | High-Dose Statin (n = 125) |
|---|---|---|---|---|---|---|
| Any treatment-emergent | 203 (73%) | 158 (68%) | 188 (72%) | 174 (71%) | 183 (74%) | 92 (74%) |
| Serious | 10 (4%) | 4 (2%) | 8 (3%) | 7 (3%) | 5 (2%) | 5 (4%) |
| Leading to discontinuation ⁎ | 33 (12%) | 11 (5%) | 36 (14%) | 19 (8%) | 25 (10%) | 2 (2%) |
| Death | 1 (<1%) † | 0 | 0 | 0 | 0 | 1 (1%) ‡ |
| Any treatment-related | 82 (30%) | 43 (18%) | 75 (29%) | 55 (22%) | 70 (28%) | 30 (24%) |
| Treatment-related in ≥3% of patients § | ||||||
| Arthralgia | 3 (1%) | 1 (0.4%) | 4 (2%) | 2 (1%) | 3 (1%) | 5 (4%) |
| Dyspepsia | 4 (1%) | 2 (1%) | 3 (1%) | 1 (0.4%) | 9 (4%) | 0 |
| Headache | 12 (4%) | 8 (3%) | 9 (3%) | 12 (5%) | 4 (2%) | 2 (2%) |
| Nausea | 9 (3%) | 5 (2%) | 5 (2%) | 5 (2%) | 7 (3%) | 4 (3%) |
| Myalgia | 6 (2%) | 4 (2%) | 8 (3%) | 6 (2%) | 5 (2%) | 4 (3%) |
Stay updated, free articles. Join our Telegram channel

Full access? Get Clinical Tree


