The concept of the J-curve effect has been around for a long time and is a subject of contention among various investigators. The J-curve effect describes an inverse relation between low blood pressure (BP) and cardiovascular complications. Because the coronary arteries are perfused during diastole, this effect is seen mostly with low diastolic BP in the range of 70 to 80 mm Hg, depending on preexisting coronary artery disease, hypertension, or left ventricular hypertrophy. Although national and international guidelines recommend aggressive BP control to <140/90 mm Hg for uncomplicated hypertension or <130/80 mm Hg for hypertension associated with coronary artery disease, diabetes, or chronic kidney disease, recent large clinical outcomes trials have observed a J-curve effect between diastolic BP <80 mm Hg as well as systolic BP <130 mm Hg and have cast some doubt regarding the aggressive BP treatment, or “the lower the better,” concept. Other recent studies have shown no benefit with respect to cardiovascular complications between aggressive and less aggressive BP control. In contrast to cardiovascular complications, no J-curve effect has been noted for strokes. A Medline search of English-language reports published from 1992 to 2010 regarding this topic was conducted, and 11 reports were selected and are discussed in this brief review, together with collateral published research. In conclusion, most of the reviewed publications suggest a J-curve effect with low diastolic and systolic BP for cardiovascular disease complications but not stroke complications.
Guidelines for the treatment of hypertension by major national and international societies recommend reductions of blood pressure (BP) to <140/90 mm Hg for patients with uncomplicated hypertension and to <130/80 mm Hg for those with diabetes mellitus, cardiovascular disease (CVD) or chronic kidney disease. However, as Zanchetti et al stated, these recommendations are based mostly on wisdom and little on fact. Recent large clinical outcomes trials have shown that the aggressive treatment of systolic and diastolic BP is associated with increases in CVD complications. These studies brought to life the perennial argument regarding the existence of a J-curve effect between low diastolic BP and cardiovascular risk. This phenomenon, first reported by Stewart in 1979, involves increased cardiovascular morbidity and mortality when diastolic BP is lowered below a certain point, usually 70 to 80 mm Hg. Most publications have ascribed the J-curve effect to low diastolic BP, and only 2 recent studies have seen a J-curve effect with low systolic BP as well. For this brief review of the subject, a Medline search was conducted for English-language reports published from 1992 to 2010, since this subject was reported in a meta-analysis by Farnett et al in 1991. From this search, 11 pertinent reports were selected and are discussed in this concise review, together with collateral published research. Most of the reviewed publications suggest a J-curve effect with low diastolic and systolic BP for CVD complications, but not stroke complications.
The J-Curve or U-Curve Phenomenon
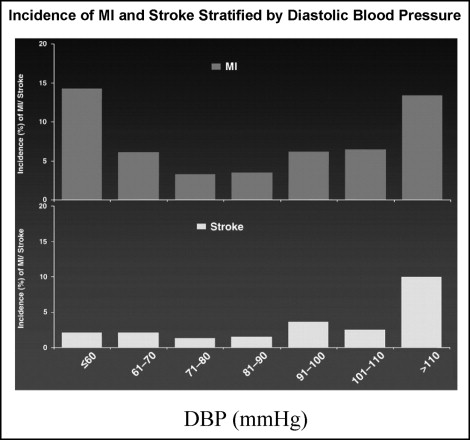
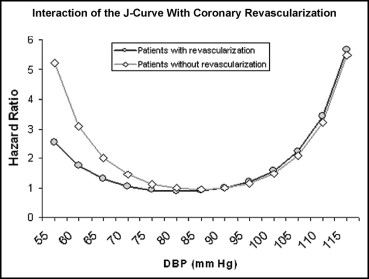
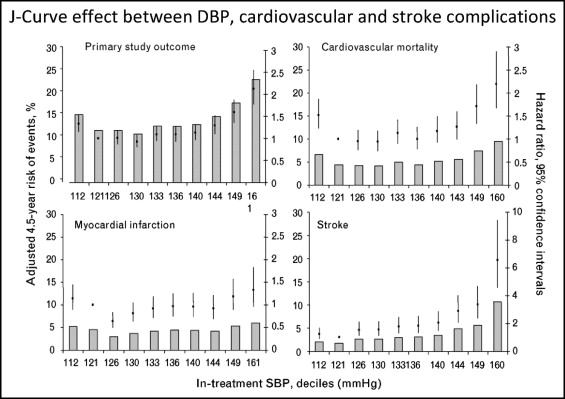
The J-curve phenomenon describes a situation whereby cardiovascular complications increase when diastolic BP is lowered below a certain point, usually 70 to 80 mm Hg. It was first described by Stewart in 1979, with an incidence of myocardial infarction >5 times higher in patients with diastolic BP <90 mm Hg compared to those with diastolic BP of 100 to 109 mm Hg. Similar observations were reported by Cruickshank et al in 1987, who observed a J-curve relation between diastolic BP of 85 to 90 mm Hg and increased incidence of myocardial infarction and death in patients with ischemic heart disease. Several other investigators followed with similar observations. In a critical review by Farnett et al of 13 studies, comprising 48,000 patients treated for hypertension for ≥1 year, the investigators observed a definite J-curve effect with a threshold diastolic BP of 85 mm Hg and increased cardiovascular morbidity and mortality, but not stroke. In most studies, the J-curve effect has been observed with diastolic BP. However, 2 recent large clinical outcomes trials observed J-curve relations with systolic BP besides diastolic BP and cardiovascular complications. In these studies, J-curve effects were observed with systolic BP ≤130 mm Hg and diastolic BP ≤80 mm Hg for cardiovascular complications, but not stroke complications ( Figures 1 to 3 ). The J-curve effect was steeper in patients with coronary artery disease (CAD) without revascularization compared to those with revascularization ( Figure 2 ). All the published studies exhibiting J-curve effects are listed in Table 1 .


| Study | Subjects | Age (years) | Follow-Up (years) | Baseline DBP (mm Hg) | CAD | J-Curve Effect | ||
|---|---|---|---|---|---|---|---|---|
| MI | Stroke | DBP (mm Hg) | ||||||
| Stewart | 169 | 44 | 6.3 | 124 | No | Yes | — | 100–109 |
| Cruickshank et al | 902 | 55 | 6.1 | 109 | Yes | Yes | No | 80–90 |
| Fletcher et al | 2,145 | 51 | 4.0 | 107 | Yes | Yes | No | 86–91 |
| Alderman et al | 1,765 | 51 | 4.2 | 102 | Yes | Yes | No | 84–88 |
| Samuelsson et al | 686 | 52 | 12.0 | 106 | Yes | Yes | No | 81 |
| McCloskey et al | 912 | 30–79 | 3–21 | 104 | Yes | Yes | No | 84 |
| Lindblad et al | 2,574 | 59 | 7.4 | 92 | Yes | Yes | No | 84 |
| Pastor-Barriuso et al | 7,830 | 54 | 15.0 | 82 | No | Yes | No | 80 |
| Messerli et al | 22,576 | 66 | 2.7 | 86 | Yes | Yes | No | 76–86 |
| Protogerou et al | 331 | 85 | 3–4 | — | Yes | Yes | No | <70 |
| Fagard et al | 4,695 | 70 | 1–8 | 85 | Yes | Yes | No | 70–75 |
| Sleight et al | 25,620 | 55 | 4.7 | 82 | Yes | Yes | No | 75–79 |
Hemodynamic Interrelations Between Blood Pressure and Coronary Artery Blood Flow Regarding the J-Curve Effect
Physiologically, there is no argument with respect to the occurrence of the J-curve effect and CAD complications, because BP of 0 mm Hg is associated with 100% mortality. The question is, at which pathophysiologic BP range does the J-curve occur? Because coronary artery perfusion happens during the diastolic phase of the cardiac cycle, there should be an association between diastolic BP and coronary perfusion. Coronary artery perfusion depends on the pressure gradient between the coronary arteries and the left ventricle in diastole. When coronary perfusion pressure is lowered to 40 to 50 mm Hg, the so-called pressure at 0 flow, diastolic blood flow in the coronary arteries of the dog ceases. In patients with hypertension, especially in those with left ventricular hypertrophy (LVH), there is an upward shift of the coronary autoregulation perfusion pressure to 70 and 90 to 80 mm Hg, respectively, compared to normotensive controls of 60 mm Hg, under maximum vasodilation with intravenous infusion of sodium nitroprusside. Below these pressures, coronary blood flow is decreased, and oxygen extraction is increased. Coronary pressure autoregulation provides relatively constant blood perfusion to myocardium over a fairly wide perfusion pressure range of 45 to 125 mm Hg. Consequently, coronary BP autoregulation will protect myocardial perfusion against a fairly wide range of epicardial coronary pressure changes. However, in patients with CAD, autoregulation could be compromised, and a decrease in diastolic BP might lower perfusion pressure distal to an epicardial coronary artery stenosis below a critical level at which autoregulation is functional. The coexistence of hypertension and LVH further narrows the range of coronary arterial pressure autoregulation, because these patients require higher perfusion pressures than normal individuals. Therefore, patients with CAD, hypertension, and LVH are at greater risk for manifesting the J-curve effect with low diastolic BP than patients without LVH.
Stay updated, free articles. Join our Telegram channel

Full access? Get Clinical Tree


